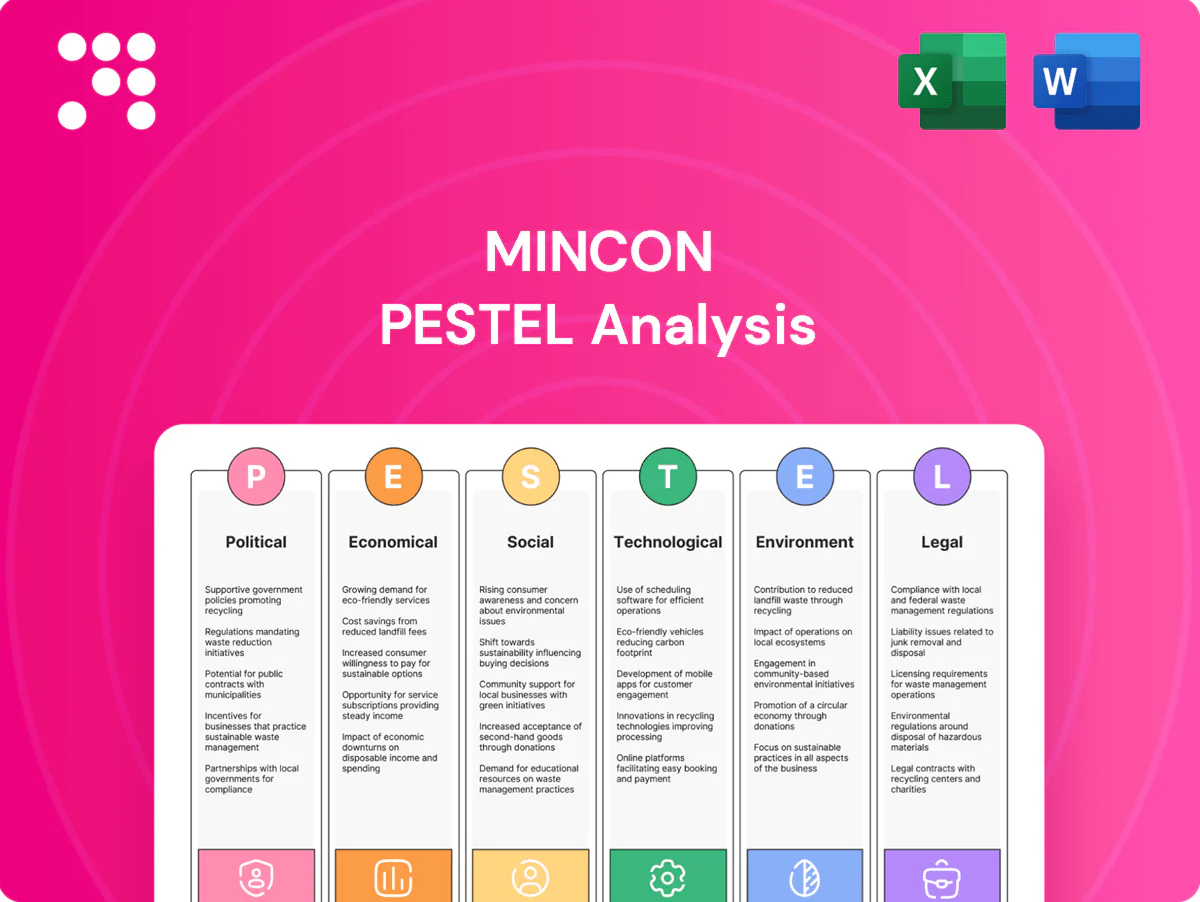
Mincon PESTLE Analysis

Skip the Research. Get the Strategy.
Gain a competitive edge with our Mincon PESTLE Analysis—three to five expert-level sentences packed with political, economic, social, technological, legal and environmental insights. Use this concise briefing to spot risks and growth areas fast. Purchase the full report for the complete, actionable breakdown and ready-to-use charts.
Political factors

Resource nationalism & local content
Host governments can mandate local ownership, content or processing, as seen with Indonesia’s nickel onshore-processing requirements since 2020 and Chile’s tighter lithium sector controls introduced in 2023, forcing tooling and service shifts. Such rules affect where Mincon manufactures, sources and services drilling tools and increase capex for regional assembly. Aligning with local partners and building regional assembly lines mitigates compliance risk. Diversifying country exposure reduces vulnerability to sudden policy shocks.
Trade policy & tariffs
Tariffs on steel, components or finished tools—such as the US Section 232 steel tariff of 25%—can compress margins and force price adjustments for Mincon. Shifting supply chains to tariff-favored routes or low-tariff origins preserves competitiveness. Free-trade agreements like USMCA or CPTPP unlock smoother market access. Continuous monitoring enables proactive pricing and sourcing adjustments.

Infrastructure & public spending
Government-backed infrastructure spending—eg US Infrastructure Investment and Jobs Act $1.2 trillion, EU Recovery and Resilience Facility €723.8bn, India NIP ₹111 trillion—directly lifts demand for construction and HDD drilling, while Global Infrastructure Hub estimates a $3.7tn/yr infrastructure need to 2040. Fiscal cycles drive order visibility and backlog conversion; targeting regions with multi-year plans stabilizes utilisation, and public procurement rules shape tender strategy and win rates.

Geopolitical instability & sanctions
Conflict zones and sanctioned markets can halt deliveries and service support for Mincon, requiring export screening and route diversification to maintain continuity; recent post-2022 sanction regimes have increasingly constrained access to certain supply corridors.
- Export screening
- Route diversification
- Inventory in stable hubs
- Insurance & contractual risk-sharing
Mining permitting & policy direction
Pro-mining policy accelerates project starts while restrictive regimes can delay permitting for an average of 4–7 years at federal level; fast-tracked permits for critical minerals (USGS list: 50 critical minerals) materially boost demand for drilling and downhole tools. Active engagement with industry bodies shapes regulatory outcomes and scenario planning lets Mincon reallocate sales and service teams quickly to capture windows of opportunity.
- Permitting delay: 4–7 years
- Critical minerals: 50 (USGS)
- Fast-track = higher tool demand
- Industry engagement shapes rules
- Scenario planning enables agile field deployment
Local-content rules, tariffs and long permitting cycles reshape mining capex
Host-country local-content rules (eg Indonesia 2020, Chile 2023) raise regional capex and shift manufacturing. Tariffs (US Section 232 steel 25%) and sanctions compress margins and disrupt routes. Large infrastructure programmes (US IIJA $1.2tn; EU RRF €724bn) and 4–7yr permitting cycles for mining (USGS 50 critical minerals) drive demand and timing.
| Risk | Impact | 2024/25 data |
|---|---|---|
| Local mandates | Higher capex | Indonesia/Chile |
| Tariffs | Margin squeeze | US 25% |
| Infra spend | Demand boost | US $1.2tn; EU €724bn |
| Permitting | Schedule risk | 4–7 yrs; 50 minerals |
What is included in the product
 Detailed Word Document
Explores how macro-environmental forces uniquely affect Mincon across Political, Economic, Social, Technological, Environmental, and Legal dimensions, with each section grounded in current market and regulatory data to highlight risks and opportunities; designed for executives and investors to support strategic planning, fundraising, and scenario analysis.

 Customizable Excel Spreadsheet
A concise, visually segmented Mincon PESTLE summary that streamlines external risk discussions, is easily dropped into presentations or planning decks, and allows users to add region- or business-specific notes for quick team alignment.
Economic factors

Commodity price cycles
Metal and aggregate price cycles directly drive Mincon's capex and consumables spend; LME copper averaged about $9,300/t in H1 2024, supporting higher drilling budgets. Upcycles historically lift drill programs and tool consumption—Mincon saw demand spikes aligned with commodity rallies—while downcycles defer replacements and lower spare-parts turnover. Balanced exposure across mining, quarrying and water and flexible production capacity help smooth revenue volatility and match run-rate demand.
Input costs & inflation
Steel and tungsten carbide costs, plus energy, remain key COGS drivers; HRC steel prices retraced roughly 25% from 2022 peaks by 2024 and APT tungsten averaged near $300/MTU in 2024, easing raw-material pressure. Pricing discipline and value-led selling have preserved gross margins despite inflation. Long-term contracts and hedges reduce input volatility, while lean operations and automation offset wage inflation and contain unit costs.

FX volatility & translation
Global revenue receipts in multiple currencies versus euro- or dollar-denominated inputs create material translation and transaction risk for Mincon, especially across project cycles. Natural hedging through local sourcing and local-currency procurement reduces exposure by aligning costs with local revenues. Pricing contracts in customer currencies enhances competitiveness and preserves margins in volatile FX environments. Active hedging programs smooth earnings translation and provide forecastable cash flows.

Interest rates & customer capex
Logistics & supply chain resilience
Freight rate volatility—Drewry World Container Index averaged about 1,200 USD per 40ft in 2024—raises delivery cost and lead-time risk for Mincon, making reliability-sensitive contracts more expensive. Regional stocking and modular designs shorten service cycles and raise fill rates, while dual-sourcing critical parts mitigates single-source bottlenecks. Data-driven forecasting aligns production to demand peaks, reducing emergency airfreight and expediting costs.
- Freight volatility: Drewry WCI ~1,200 USD (2024)
- Regional stocking: reduces lead time risk
- Modular design: improves serviceability
- Dual-sourcing: lowers single-source disruption
- Forecasting: cuts expedited shipping spend
Local-content rules, tariffs and long permitting cycles reshape mining capex
Metal cycles (LME copper ~9,300 USD/t H1 2024) drive capex and consumables; upcycles boost drill programs while downcycles defer replacements. COGS shaped by HRC and APT tungsten (~300 USD/MTU in 2024) and freight (Drewry WCI ~1,200 USD/40ft), partially offset by contracts, hedges and local sourcing. Higher policy rates (Fed 5.25–5.50%, ECB ~4.0%, RBA ~4.35%) raise project hurdles and favor leasing/service models.
| Metric | 2024 Value |
|---|---|
| LME copper H1 | ~9,300 USD/t |
| APT tungsten | ~300 USD/MTU |
| Drewry WCI | ~1,200 USD/40ft |
| Policy rates | Fed 5.25–5.50% / ECB ~4.0% / RBA ~4.35% |
Preview the Actual Deliverable
Mincon PESTLE Analysis
The preview shown here is the exact Mincon PESTLE Analysis you’ll receive after purchase—fully formatted and ready to use. This is a real screenshot of the product you’re buying, delivered exactly as shown with no placeholders or surprises. The layout, content, and structure visible here are what you’ll download immediately after checkout.

Skip the Research. Get the Strategy.
Gain a competitive edge with our Mincon PESTLE Analysis—three to five expert-level sentences packed with political, economic, social, technological, legal and environmental insights. Use this concise briefing to spot risks and growth areas fast. Purchase the full report for the complete, actionable breakdown and ready-to-use charts.
Political factors
Resource nationalism & local content
Host governments can mandate local ownership, content or processing, as seen with Indonesia’s nickel onshore-processing requirements since 2020 and Chile’s tighter lithium sector controls introduced in 2023, forcing tooling and service shifts. Such rules affect where Mincon manufactures, sources and services drilling tools and increase capex for regional assembly. Aligning with local partners and building regional assembly lines mitigates compliance risk. Diversifying country exposure reduces vulnerability to sudden policy shocks.
Trade policy & tariffs
Tariffs on steel, components or finished tools—such as the US Section 232 steel tariff of 25%—can compress margins and force price adjustments for Mincon. Shifting supply chains to tariff-favored routes or low-tariff origins preserves competitiveness. Free-trade agreements like USMCA or CPTPP unlock smoother market access. Continuous monitoring enables proactive pricing and sourcing adjustments.
Infrastructure & public spending
Government-backed infrastructure spending—eg US Infrastructure Investment and Jobs Act $1.2 trillion, EU Recovery and Resilience Facility €723.8bn, India NIP ₹111 trillion—directly lifts demand for construction and HDD drilling, while Global Infrastructure Hub estimates a $3.7tn/yr infrastructure need to 2040. Fiscal cycles drive order visibility and backlog conversion; targeting regions with multi-year plans stabilizes utilisation, and public procurement rules shape tender strategy and win rates.
Geopolitical instability & sanctions
Conflict zones and sanctioned markets can halt deliveries and service support for Mincon, requiring export screening and route diversification to maintain continuity; recent post-2022 sanction regimes have increasingly constrained access to certain supply corridors.
- Export screening
- Route diversification
- Inventory in stable hubs
- Insurance & contractual risk-sharing
Mining permitting & policy direction
Pro-mining policy accelerates project starts while restrictive regimes can delay permitting for an average of 4–7 years at federal level; fast-tracked permits for critical minerals (USGS list: 50 critical minerals) materially boost demand for drilling and downhole tools. Active engagement with industry bodies shapes regulatory outcomes and scenario planning lets Mincon reallocate sales and service teams quickly to capture windows of opportunity.
- Permitting delay: 4–7 years
- Critical minerals: 50 (USGS)
- Fast-track = higher tool demand
- Industry engagement shapes rules
- Scenario planning enables agile field deployment
Local-content rules, tariffs and long permitting cycles reshape mining capex
Host-country local-content rules (eg Indonesia 2020, Chile 2023) raise regional capex and shift manufacturing. Tariffs (US Section 232 steel 25%) and sanctions compress margins and disrupt routes. Large infrastructure programmes (US IIJA $1.2tn; EU RRF €724bn) and 4–7yr permitting cycles for mining (USGS 50 critical minerals) drive demand and timing.
| Risk | Impact | 2024/25 data |
|---|---|---|
| Local mandates | Higher capex | Indonesia/Chile |
| Tariffs | Margin squeeze | US 25% |
| Infra spend | Demand boost | US $1.2tn; EU €724bn |
| Permitting | Schedule risk | 4–7 yrs; 50 minerals |
What is included in the product
Detailed Word Document
Explores how macro-environmental forces uniquely affect Mincon across Political, Economic, Social, Technological, Environmental, and Legal dimensions, with each section grounded in current market and regulatory data to highlight risks and opportunities; designed for executives and investors to support strategic planning, fundraising, and scenario analysis.
Customizable Excel Spreadsheet
A concise, visually segmented Mincon PESTLE summary that streamlines external risk discussions, is easily dropped into presentations or planning decks, and allows users to add region- or business-specific notes for quick team alignment.
Economic factors
Commodity price cycles
Metal and aggregate price cycles directly drive Mincon's capex and consumables spend; LME copper averaged about $9,300/t in H1 2024, supporting higher drilling budgets. Upcycles historically lift drill programs and tool consumption—Mincon saw demand spikes aligned with commodity rallies—while downcycles defer replacements and lower spare-parts turnover. Balanced exposure across mining, quarrying and water and flexible production capacity help smooth revenue volatility and match run-rate demand.
Input costs & inflation
Steel and tungsten carbide costs, plus energy, remain key COGS drivers; HRC steel prices retraced roughly 25% from 2022 peaks by 2024 and APT tungsten averaged near $300/MTU in 2024, easing raw-material pressure. Pricing discipline and value-led selling have preserved gross margins despite inflation. Long-term contracts and hedges reduce input volatility, while lean operations and automation offset wage inflation and contain unit costs.
FX volatility & translation
Global revenue receipts in multiple currencies versus euro- or dollar-denominated inputs create material translation and transaction risk for Mincon, especially across project cycles. Natural hedging through local sourcing and local-currency procurement reduces exposure by aligning costs with local revenues. Pricing contracts in customer currencies enhances competitiveness and preserves margins in volatile FX environments. Active hedging programs smooth earnings translation and provide forecastable cash flows.
Interest rates & customer capex
Logistics & supply chain resilience
Freight rate volatility—Drewry World Container Index averaged about 1,200 USD per 40ft in 2024—raises delivery cost and lead-time risk for Mincon, making reliability-sensitive contracts more expensive. Regional stocking and modular designs shorten service cycles and raise fill rates, while dual-sourcing critical parts mitigates single-source bottlenecks. Data-driven forecasting aligns production to demand peaks, reducing emergency airfreight and expediting costs.
- Freight volatility: Drewry WCI ~1,200 USD (2024)
- Regional stocking: reduces lead time risk
- Modular design: improves serviceability
- Dual-sourcing: lowers single-source disruption
- Forecasting: cuts expedited shipping spend
Local-content rules, tariffs and long permitting cycles reshape mining capex
Metal cycles (LME copper ~9,300 USD/t H1 2024) drive capex and consumables; upcycles boost drill programs while downcycles defer replacements. COGS shaped by HRC and APT tungsten (~300 USD/MTU in 2024) and freight (Drewry WCI ~1,200 USD/40ft), partially offset by contracts, hedges and local sourcing. Higher policy rates (Fed 5.25–5.50%, ECB ~4.0%, RBA ~4.35%) raise project hurdles and favor leasing/service models.
| Metric | 2024 Value |
|---|---|
| LME copper H1 | ~9,300 USD/t |
| APT tungsten | ~300 USD/MTU |
| Drewry WCI | ~1,200 USD/40ft |
| Policy rates | Fed 5.25–5.50% / ECB ~4.0% / RBA ~4.35% |
Preview the Actual Deliverable
Mincon PESTLE Analysis
The preview shown here is the exact Mincon PESTLE Analysis you’ll receive after purchase—fully formatted and ready to use. This is a real screenshot of the product you’re buying, delivered exactly as shown with no placeholders or surprises. The layout, content, and structure visible here are what you’ll download immediately after checkout.
Original: $10.00
-65%$10.00
$3.50Description
Skip the Research. Get the Strategy.
Gain a competitive edge with our Mincon PESTLE Analysis—three to five expert-level sentences packed with political, economic, social, technological, legal and environmental insights. Use this concise briefing to spot risks and growth areas fast. Purchase the full report for the complete, actionable breakdown and ready-to-use charts.
Political factors
Resource nationalism & local content
Host governments can mandate local ownership, content or processing, as seen with Indonesia’s nickel onshore-processing requirements since 2020 and Chile’s tighter lithium sector controls introduced in 2023, forcing tooling and service shifts. Such rules affect where Mincon manufactures, sources and services drilling tools and increase capex for regional assembly. Aligning with local partners and building regional assembly lines mitigates compliance risk. Diversifying country exposure reduces vulnerability to sudden policy shocks.
Trade policy & tariffs
Tariffs on steel, components or finished tools—such as the US Section 232 steel tariff of 25%—can compress margins and force price adjustments for Mincon. Shifting supply chains to tariff-favored routes or low-tariff origins preserves competitiveness. Free-trade agreements like USMCA or CPTPP unlock smoother market access. Continuous monitoring enables proactive pricing and sourcing adjustments.
Infrastructure & public spending
Government-backed infrastructure spending—eg US Infrastructure Investment and Jobs Act $1.2 trillion, EU Recovery and Resilience Facility €723.8bn, India NIP ₹111 trillion—directly lifts demand for construction and HDD drilling, while Global Infrastructure Hub estimates a $3.7tn/yr infrastructure need to 2040. Fiscal cycles drive order visibility and backlog conversion; targeting regions with multi-year plans stabilizes utilisation, and public procurement rules shape tender strategy and win rates.
Geopolitical instability & sanctions
Conflict zones and sanctioned markets can halt deliveries and service support for Mincon, requiring export screening and route diversification to maintain continuity; recent post-2022 sanction regimes have increasingly constrained access to certain supply corridors.
- Export screening
- Route diversification
- Inventory in stable hubs
- Insurance & contractual risk-sharing
Mining permitting & policy direction
Pro-mining policy accelerates project starts while restrictive regimes can delay permitting for an average of 4–7 years at federal level; fast-tracked permits for critical minerals (USGS list: 50 critical minerals) materially boost demand for drilling and downhole tools. Active engagement with industry bodies shapes regulatory outcomes and scenario planning lets Mincon reallocate sales and service teams quickly to capture windows of opportunity.
- Permitting delay: 4–7 years
- Critical minerals: 50 (USGS)
- Fast-track = higher tool demand
- Industry engagement shapes rules
- Scenario planning enables agile field deployment
Local-content rules, tariffs and long permitting cycles reshape mining capex
Host-country local-content rules (eg Indonesia 2020, Chile 2023) raise regional capex and shift manufacturing. Tariffs (US Section 232 steel 25%) and sanctions compress margins and disrupt routes. Large infrastructure programmes (US IIJA $1.2tn; EU RRF €724bn) and 4–7yr permitting cycles for mining (USGS 50 critical minerals) drive demand and timing.
| Risk | Impact | 2024/25 data |
|---|---|---|
| Local mandates | Higher capex | Indonesia/Chile |
| Tariffs | Margin squeeze | US 25% |
| Infra spend | Demand boost | US $1.2tn; EU €724bn |
| Permitting | Schedule risk | 4–7 yrs; 50 minerals |
What is included in the product
Detailed Word Document
Explores how macro-environmental forces uniquely affect Mincon across Political, Economic, Social, Technological, Environmental, and Legal dimensions, with each section grounded in current market and regulatory data to highlight risks and opportunities; designed for executives and investors to support strategic planning, fundraising, and scenario analysis.
Customizable Excel Spreadsheet
A concise, visually segmented Mincon PESTLE summary that streamlines external risk discussions, is easily dropped into presentations or planning decks, and allows users to add region- or business-specific notes for quick team alignment.
Economic factors
Commodity price cycles
Metal and aggregate price cycles directly drive Mincon's capex and consumables spend; LME copper averaged about $9,300/t in H1 2024, supporting higher drilling budgets. Upcycles historically lift drill programs and tool consumption—Mincon saw demand spikes aligned with commodity rallies—while downcycles defer replacements and lower spare-parts turnover. Balanced exposure across mining, quarrying and water and flexible production capacity help smooth revenue volatility and match run-rate demand.
Input costs & inflation
Steel and tungsten carbide costs, plus energy, remain key COGS drivers; HRC steel prices retraced roughly 25% from 2022 peaks by 2024 and APT tungsten averaged near $300/MTU in 2024, easing raw-material pressure. Pricing discipline and value-led selling have preserved gross margins despite inflation. Long-term contracts and hedges reduce input volatility, while lean operations and automation offset wage inflation and contain unit costs.
FX volatility & translation
Global revenue receipts in multiple currencies versus euro- or dollar-denominated inputs create material translation and transaction risk for Mincon, especially across project cycles. Natural hedging through local sourcing and local-currency procurement reduces exposure by aligning costs with local revenues. Pricing contracts in customer currencies enhances competitiveness and preserves margins in volatile FX environments. Active hedging programs smooth earnings translation and provide forecastable cash flows.
Interest rates & customer capex
Logistics & supply chain resilience
Freight rate volatility—Drewry World Container Index averaged about 1,200 USD per 40ft in 2024—raises delivery cost and lead-time risk for Mincon, making reliability-sensitive contracts more expensive. Regional stocking and modular designs shorten service cycles and raise fill rates, while dual-sourcing critical parts mitigates single-source bottlenecks. Data-driven forecasting aligns production to demand peaks, reducing emergency airfreight and expediting costs.
- Freight volatility: Drewry WCI ~1,200 USD (2024)
- Regional stocking: reduces lead time risk
- Modular design: improves serviceability
- Dual-sourcing: lowers single-source disruption
- Forecasting: cuts expedited shipping spend
Local-content rules, tariffs and long permitting cycles reshape mining capex
Metal cycles (LME copper ~9,300 USD/t H1 2024) drive capex and consumables; upcycles boost drill programs while downcycles defer replacements. COGS shaped by HRC and APT tungsten (~300 USD/MTU in 2024) and freight (Drewry WCI ~1,200 USD/40ft), partially offset by contracts, hedges and local sourcing. Higher policy rates (Fed 5.25–5.50%, ECB ~4.0%, RBA ~4.35%) raise project hurdles and favor leasing/service models.
| Metric | 2024 Value |
|---|---|
| LME copper H1 | ~9,300 USD/t |
| APT tungsten | ~300 USD/MTU |
| Drewry WCI | ~1,200 USD/40ft |
| Policy rates | Fed 5.25–5.50% / ECB ~4.0% / RBA ~4.35% |
Preview the Actual Deliverable
Mincon PESTLE Analysis
The preview shown here is the exact Mincon PESTLE Analysis you’ll receive after purchase—fully formatted and ready to use. This is a real screenshot of the product you’re buying, delivered exactly as shown with no placeholders or surprises. The layout, content, and structure visible here are what you’ll download immediately after checkout.











