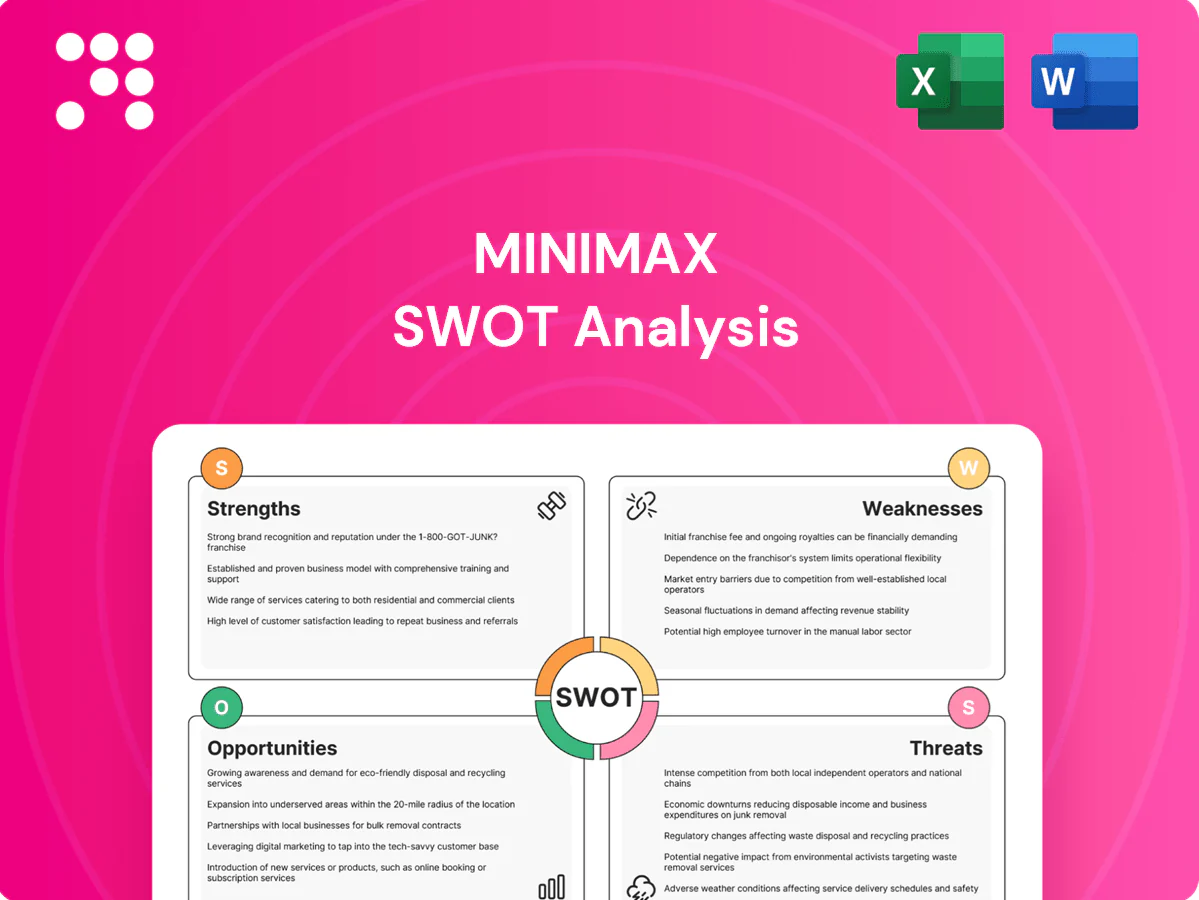
Minimax SWOT Analysis

Elevate Your Analysis with the Complete SWOT Report
Unlock the strategic story behind Minimax with our Minimax SWOT Analysis—three concise sections revealing core strengths, market risks, and untapped growth levers. Want deeper, actionable intelligence? Purchase the full SWOT for a research-backed, editable Word report plus an Excel matrix to plan, pitch, and invest with confidence.
Strengths

End-to-end fire protection portfolio
Minimax delivers detection, suppression, extinguishing and lifecycle services from planning through maintenance, enabling fully integrated, tailored solutions across industrial, commercial and maritime risk profiles. Single-vendor accountability reduces coordination complexity and project lead times, while bundled service offerings support cross-selling and extend customer lifetime value through recurring maintenance and upgrade contracts.
Deep expertise in special hazards
Minimax’s deep expertise in complex industrial and special-hazard environments differentiates it from generalist safety providers and underpins turnkey solutions for refineries, LNG and chemical plants. Engineering depth ensures designs that meet stringent codes and insurer conditions, reducing project delays and rejection risk. With the industrial fire protection market projected to reach about USD 83.8 billion by 2026, Minimax is positioned as a partner for mission-critical facilities.

Global footprint and multi-industry reach
Serving buildings and industrial facilities worldwide diversifies Minimax revenue streams and aligns with a global fire-protection market projected to reach about USD 126 billion by 2028 at ~7% CAGR (MarketsandMarkets). Exposure to varied geographies reduces reliance on any single market, while multisector experience speeds solution reuse and best-practice transfer. This scale supports competitive pricing and wider service availability.

Integrated project delivery and lifecycle service
In-house planning, project management, installation and maintenance streamline delivery, reducing coordination delays and rework; end-to-end control improves quality, schedules and cost predictability. Recurring service revenues stabilize cash flows beyond one-off projects and enhance client retention; up to 80% of total lifecycle costs occur during operations, underlining the value of lifecycle services.
- Integrated delivery: unified control of design-to-maintenance
- Predictability: fewer delays, tighter cost forecasting
- Recurring revenue: stabilizes cash flow, deepens client ties
- Defensibility: long-term contracts and operational expertise
Strong compliance and certification orientation
Minimax’s roots since 1902 and ISO 9001-certified quality systems give it strong alignment with global and local fire-protection standards, de-risking procurement for customers in highly regulated industries. Broad certification coverage shortens approval cycles and enables faster project wins, supporting premium pricing power in regulated segments.
- Founded 1902
- ISO 9001-certified quality
- Shorter approval cycles, premium positioning
End-to-end fire protection, ISO 9001 quality, access to a USD 126B market
Minimax offers end-to-end fire protection and lifecycle services, enabling single-vendor accountability, faster project delivery and recurring maintenance contracts. Deep engineering for complex hazards and ISO 9001 quality support premium pricing and insurer acceptance. Global exposure — industrial market ~USD 83.8B by 2026, total fire-protection ~USD 126B by 2028 (~7% CAGR) — diversifies revenue and supports scale.
| Metric | Value |
|---|---|
| Founded | 1902 |
| Certification | ISO 9001 |
| Industrial market | USD 83.8B (2026) |
| Total market | USD 126B (2028, ~7% CAGR) |
| Lifecycle ops cost | Up to 80% |
What is included in the product
 Detailed Word Document
Provides a concise SWOT assessment of Minimax’s internal capabilities and external market threats, identifying growth drivers, operational weaknesses, strategic opportunities, and risks shaping its competitive position.

 Customizable Excel Spreadsheet
Minimax SWOT Analysis condenses risks and opportunities into a prioritized matrix for rapid decision-making, reducing analysis paralysis and focusing teams on high-impact actions; its compact visual layout enables quick alignment and easy updates as priorities shift.
Weaknesses

High project complexity and execution risk
Large bespoke installations face high schedule and cost overrun risk: research shows 9 of 10 megaprojects exceed budgets with an average cost overrun around 28%. Cross‑trade and multi‑site integration strains skilled resources and logistics, elevating rework. Any quality lapse risks safety incidents and reputational loss, and execution variability frequently compresses margins and ties up working capital.
Capital and working capital intensity
Manufacturing, inventory and long project cycles tie up cash—inventory and WIP can consume over 25% of operating assets and extend working capital days by 30–90 days. Retentions and milestone billing commonly withhold 5–15% of contract value, delaying collections and inflating receivables. Service networks force ongoing investment in parts and technicians (often 5–10% of revenue), limiting flexibility in downturns.

Dependence on regulatory-driven demand
Dependence on regulatory-driven demand ties Minimax sales to code and insurer mandates, which often elongate sales cycles and make revenue cyclical with construction activity; global construction output was about $12 trillion in 2023, amplifying that seasonality. Code changes force product updates and compliance costs, while budget-driven clients frequently delay upgrades despite elevated risk.

Potential product and regional concentration
Concentration in specific systems or regions raises volatility for Minimax; regional slowdowns (global GDP ~3.1% in 2024 per IMF) and China growth ~5.2% in 2024 can dent demand, while FX swings and local permitting delays compress margins and extend project timelines. Uneven service coverage weakens competitiveness and amplifies operational risk during localized downturns.
- Exposure: high regional/product concentration
- Macro risk: IMF global growth 3.1% (2024)
- FX/permits: compress margins
- Operational risk: vulnerable in regional slowdowns
Legacy installed base and technology refresh burden
Maintaining backward compatibility slows product innovation and time-to-market; diverse legacy systems amplify service complexity and spare-parts inventory needs. Cyber and IoT advances force continuous firmware and platform upgrades, pressing R&D and training budgets—Deloitte 2024 estimates legacy systems can absorb up to 40% of IT maintenance spend.
- Compatibility burden: slows new features
- Service complexity: higher inventory and field support
- Security/IoT: continuous upgrade costs
- Budget impact: outsized R&D and training pressure
+28% overruns, >25% WIP, 30–90d WC
High schedule and cost-overrun risk (megaprojects +28% average) and complex cross‑site integration compress margins and tie up working capital. Large inventories/WIP can be >25% of assets, extending WC by 30–90 days; retentions often 5–15% of contract value. Regulatory dependence and regional concentration amplify cyclical demand (global growth 3.1% 2024; China 5.2% 2024) and force continuous legacy/IoT upgrades (IT maintenance ~40%).
| Metric | Value |
|---|---|
| Cost overrun | +28% |
| Inventory/WIP | >25% assets |
| Working capital delay | 30–90 days |
| Retentions | 5–15% |
| Global GDP (2024) | 3.1% |
| China GDP (2024) | 5.2% |
| IT maintenance (legacy) | ~40% |
Full Version Awaits
Minimax SWOT Analysis
This is the actual Minimax SWOT analysis document you’ll receive upon purchase—no surprises, just professional quality. The preview below is taken directly from the full report and reflects the same structured, editable file you’ll download after checkout. Buy now to unlock the complete, detailed version.

Elevate Your Analysis with the Complete SWOT Report
Unlock the strategic story behind Minimax with our Minimax SWOT Analysis—three concise sections revealing core strengths, market risks, and untapped growth levers. Want deeper, actionable intelligence? Purchase the full SWOT for a research-backed, editable Word report plus an Excel matrix to plan, pitch, and invest with confidence.
Strengths
End-to-end fire protection portfolio
Minimax delivers detection, suppression, extinguishing and lifecycle services from planning through maintenance, enabling fully integrated, tailored solutions across industrial, commercial and maritime risk profiles. Single-vendor accountability reduces coordination complexity and project lead times, while bundled service offerings support cross-selling and extend customer lifetime value through recurring maintenance and upgrade contracts.
Deep expertise in special hazards
Minimax’s deep expertise in complex industrial and special-hazard environments differentiates it from generalist safety providers and underpins turnkey solutions for refineries, LNG and chemical plants. Engineering depth ensures designs that meet stringent codes and insurer conditions, reducing project delays and rejection risk. With the industrial fire protection market projected to reach about USD 83.8 billion by 2026, Minimax is positioned as a partner for mission-critical facilities.
Global footprint and multi-industry reach
Serving buildings and industrial facilities worldwide diversifies Minimax revenue streams and aligns with a global fire-protection market projected to reach about USD 126 billion by 2028 at ~7% CAGR (MarketsandMarkets). Exposure to varied geographies reduces reliance on any single market, while multisector experience speeds solution reuse and best-practice transfer. This scale supports competitive pricing and wider service availability.
Integrated project delivery and lifecycle service
In-house planning, project management, installation and maintenance streamline delivery, reducing coordination delays and rework; end-to-end control improves quality, schedules and cost predictability. Recurring service revenues stabilize cash flows beyond one-off projects and enhance client retention; up to 80% of total lifecycle costs occur during operations, underlining the value of lifecycle services.
- Integrated delivery: unified control of design-to-maintenance
- Predictability: fewer delays, tighter cost forecasting
- Recurring revenue: stabilizes cash flow, deepens client ties
- Defensibility: long-term contracts and operational expertise
Strong compliance and certification orientation
Minimax’s roots since 1902 and ISO 9001-certified quality systems give it strong alignment with global and local fire-protection standards, de-risking procurement for customers in highly regulated industries. Broad certification coverage shortens approval cycles and enables faster project wins, supporting premium pricing power in regulated segments.
- Founded 1902
- ISO 9001-certified quality
- Shorter approval cycles, premium positioning
End-to-end fire protection, ISO 9001 quality, access to a USD 126B market
Minimax offers end-to-end fire protection and lifecycle services, enabling single-vendor accountability, faster project delivery and recurring maintenance contracts. Deep engineering for complex hazards and ISO 9001 quality support premium pricing and insurer acceptance. Global exposure — industrial market ~USD 83.8B by 2026, total fire-protection ~USD 126B by 2028 (~7% CAGR) — diversifies revenue and supports scale.
| Metric | Value |
|---|---|
| Founded | 1902 |
| Certification | ISO 9001 |
| Industrial market | USD 83.8B (2026) |
| Total market | USD 126B (2028, ~7% CAGR) |
| Lifecycle ops cost | Up to 80% |
What is included in the product
Detailed Word Document
Provides a concise SWOT assessment of Minimax’s internal capabilities and external market threats, identifying growth drivers, operational weaknesses, strategic opportunities, and risks shaping its competitive position.
Customizable Excel Spreadsheet
Minimax SWOT Analysis condenses risks and opportunities into a prioritized matrix for rapid decision-making, reducing analysis paralysis and focusing teams on high-impact actions; its compact visual layout enables quick alignment and easy updates as priorities shift.
Weaknesses
High project complexity and execution risk
Large bespoke installations face high schedule and cost overrun risk: research shows 9 of 10 megaprojects exceed budgets with an average cost overrun around 28%. Cross‑trade and multi‑site integration strains skilled resources and logistics, elevating rework. Any quality lapse risks safety incidents and reputational loss, and execution variability frequently compresses margins and ties up working capital.
Capital and working capital intensity
Manufacturing, inventory and long project cycles tie up cash—inventory and WIP can consume over 25% of operating assets and extend working capital days by 30–90 days. Retentions and milestone billing commonly withhold 5–15% of contract value, delaying collections and inflating receivables. Service networks force ongoing investment in parts and technicians (often 5–10% of revenue), limiting flexibility in downturns.
Dependence on regulatory-driven demand
Dependence on regulatory-driven demand ties Minimax sales to code and insurer mandates, which often elongate sales cycles and make revenue cyclical with construction activity; global construction output was about $12 trillion in 2023, amplifying that seasonality. Code changes force product updates and compliance costs, while budget-driven clients frequently delay upgrades despite elevated risk.
Potential product and regional concentration
Concentration in specific systems or regions raises volatility for Minimax; regional slowdowns (global GDP ~3.1% in 2024 per IMF) and China growth ~5.2% in 2024 can dent demand, while FX swings and local permitting delays compress margins and extend project timelines. Uneven service coverage weakens competitiveness and amplifies operational risk during localized downturns.
- Exposure: high regional/product concentration
- Macro risk: IMF global growth 3.1% (2024)
- FX/permits: compress margins
- Operational risk: vulnerable in regional slowdowns
Legacy installed base and technology refresh burden
Maintaining backward compatibility slows product innovation and time-to-market; diverse legacy systems amplify service complexity and spare-parts inventory needs. Cyber and IoT advances force continuous firmware and platform upgrades, pressing R&D and training budgets—Deloitte 2024 estimates legacy systems can absorb up to 40% of IT maintenance spend.
- Compatibility burden: slows new features
- Service complexity: higher inventory and field support
- Security/IoT: continuous upgrade costs
- Budget impact: outsized R&D and training pressure
+28% overruns, >25% WIP, 30–90d WC
High schedule and cost-overrun risk (megaprojects +28% average) and complex cross‑site integration compress margins and tie up working capital. Large inventories/WIP can be >25% of assets, extending WC by 30–90 days; retentions often 5–15% of contract value. Regulatory dependence and regional concentration amplify cyclical demand (global growth 3.1% 2024; China 5.2% 2024) and force continuous legacy/IoT upgrades (IT maintenance ~40%).
| Metric | Value |
|---|---|
| Cost overrun | +28% |
| Inventory/WIP | >25% assets |
| Working capital delay | 30–90 days |
| Retentions | 5–15% |
| Global GDP (2024) | 3.1% |
| China GDP (2024) | 5.2% |
| IT maintenance (legacy) | ~40% |
Full Version Awaits
Minimax SWOT Analysis
This is the actual Minimax SWOT analysis document you’ll receive upon purchase—no surprises, just professional quality. The preview below is taken directly from the full report and reflects the same structured, editable file you’ll download after checkout. Buy now to unlock the complete, detailed version.
Description
Elevate Your Analysis with the Complete SWOT Report
Unlock the strategic story behind Minimax with our Minimax SWOT Analysis—three concise sections revealing core strengths, market risks, and untapped growth levers. Want deeper, actionable intelligence? Purchase the full SWOT for a research-backed, editable Word report plus an Excel matrix to plan, pitch, and invest with confidence.
Strengths
End-to-end fire protection portfolio
Minimax delivers detection, suppression, extinguishing and lifecycle services from planning through maintenance, enabling fully integrated, tailored solutions across industrial, commercial and maritime risk profiles. Single-vendor accountability reduces coordination complexity and project lead times, while bundled service offerings support cross-selling and extend customer lifetime value through recurring maintenance and upgrade contracts.
Deep expertise in special hazards
Minimax’s deep expertise in complex industrial and special-hazard environments differentiates it from generalist safety providers and underpins turnkey solutions for refineries, LNG and chemical plants. Engineering depth ensures designs that meet stringent codes and insurer conditions, reducing project delays and rejection risk. With the industrial fire protection market projected to reach about USD 83.8 billion by 2026, Minimax is positioned as a partner for mission-critical facilities.
Global footprint and multi-industry reach
Serving buildings and industrial facilities worldwide diversifies Minimax revenue streams and aligns with a global fire-protection market projected to reach about USD 126 billion by 2028 at ~7% CAGR (MarketsandMarkets). Exposure to varied geographies reduces reliance on any single market, while multisector experience speeds solution reuse and best-practice transfer. This scale supports competitive pricing and wider service availability.
Integrated project delivery and lifecycle service
In-house planning, project management, installation and maintenance streamline delivery, reducing coordination delays and rework; end-to-end control improves quality, schedules and cost predictability. Recurring service revenues stabilize cash flows beyond one-off projects and enhance client retention; up to 80% of total lifecycle costs occur during operations, underlining the value of lifecycle services.
- Integrated delivery: unified control of design-to-maintenance
- Predictability: fewer delays, tighter cost forecasting
- Recurring revenue: stabilizes cash flow, deepens client ties
- Defensibility: long-term contracts and operational expertise
Strong compliance and certification orientation
Minimax’s roots since 1902 and ISO 9001-certified quality systems give it strong alignment with global and local fire-protection standards, de-risking procurement for customers in highly regulated industries. Broad certification coverage shortens approval cycles and enables faster project wins, supporting premium pricing power in regulated segments.
- Founded 1902
- ISO 9001-certified quality
- Shorter approval cycles, premium positioning
End-to-end fire protection, ISO 9001 quality, access to a USD 126B market
Minimax offers end-to-end fire protection and lifecycle services, enabling single-vendor accountability, faster project delivery and recurring maintenance contracts. Deep engineering for complex hazards and ISO 9001 quality support premium pricing and insurer acceptance. Global exposure — industrial market ~USD 83.8B by 2026, total fire-protection ~USD 126B by 2028 (~7% CAGR) — diversifies revenue and supports scale.
| Metric | Value |
|---|---|
| Founded | 1902 |
| Certification | ISO 9001 |
| Industrial market | USD 83.8B (2026) |
| Total market | USD 126B (2028, ~7% CAGR) |
| Lifecycle ops cost | Up to 80% |
What is included in the product
Detailed Word Document
Provides a concise SWOT assessment of Minimax’s internal capabilities and external market threats, identifying growth drivers, operational weaknesses, strategic opportunities, and risks shaping its competitive position.
Customizable Excel Spreadsheet
Minimax SWOT Analysis condenses risks and opportunities into a prioritized matrix for rapid decision-making, reducing analysis paralysis and focusing teams on high-impact actions; its compact visual layout enables quick alignment and easy updates as priorities shift.
Weaknesses
High project complexity and execution risk
Large bespoke installations face high schedule and cost overrun risk: research shows 9 of 10 megaprojects exceed budgets with an average cost overrun around 28%. Cross‑trade and multi‑site integration strains skilled resources and logistics, elevating rework. Any quality lapse risks safety incidents and reputational loss, and execution variability frequently compresses margins and ties up working capital.
Capital and working capital intensity
Manufacturing, inventory and long project cycles tie up cash—inventory and WIP can consume over 25% of operating assets and extend working capital days by 30–90 days. Retentions and milestone billing commonly withhold 5–15% of contract value, delaying collections and inflating receivables. Service networks force ongoing investment in parts and technicians (often 5–10% of revenue), limiting flexibility in downturns.
Dependence on regulatory-driven demand
Dependence on regulatory-driven demand ties Minimax sales to code and insurer mandates, which often elongate sales cycles and make revenue cyclical with construction activity; global construction output was about $12 trillion in 2023, amplifying that seasonality. Code changes force product updates and compliance costs, while budget-driven clients frequently delay upgrades despite elevated risk.
Potential product and regional concentration
Concentration in specific systems or regions raises volatility for Minimax; regional slowdowns (global GDP ~3.1% in 2024 per IMF) and China growth ~5.2% in 2024 can dent demand, while FX swings and local permitting delays compress margins and extend project timelines. Uneven service coverage weakens competitiveness and amplifies operational risk during localized downturns.
- Exposure: high regional/product concentration
- Macro risk: IMF global growth 3.1% (2024)
- FX/permits: compress margins
- Operational risk: vulnerable in regional slowdowns
Legacy installed base and technology refresh burden
Maintaining backward compatibility slows product innovation and time-to-market; diverse legacy systems amplify service complexity and spare-parts inventory needs. Cyber and IoT advances force continuous firmware and platform upgrades, pressing R&D and training budgets—Deloitte 2024 estimates legacy systems can absorb up to 40% of IT maintenance spend.
- Compatibility burden: slows new features
- Service complexity: higher inventory and field support
- Security/IoT: continuous upgrade costs
- Budget impact: outsized R&D and training pressure
+28% overruns, >25% WIP, 30–90d WC
High schedule and cost-overrun risk (megaprojects +28% average) and complex cross‑site integration compress margins and tie up working capital. Large inventories/WIP can be >25% of assets, extending WC by 30–90 days; retentions often 5–15% of contract value. Regulatory dependence and regional concentration amplify cyclical demand (global growth 3.1% 2024; China 5.2% 2024) and force continuous legacy/IoT upgrades (IT maintenance ~40%).
| Metric | Value |
|---|---|
| Cost overrun | +28% |
| Inventory/WIP | >25% assets |
| Working capital delay | 30–90 days |
| Retentions | 5–15% |
| Global GDP (2024) | 3.1% |
| China GDP (2024) | 5.2% |
| IT maintenance (legacy) | ~40% |
Full Version Awaits
Minimax SWOT Analysis
This is the actual Minimax SWOT analysis document you’ll receive upon purchase—no surprises, just professional quality. The preview below is taken directly from the full report and reflects the same structured, editable file you’ll download after checkout. Buy now to unlock the complete, detailed version.











