Mirum Porter's Five Forces Analysis

Elevate Your Analysis with the Complete Porter's Five Forces Analysis
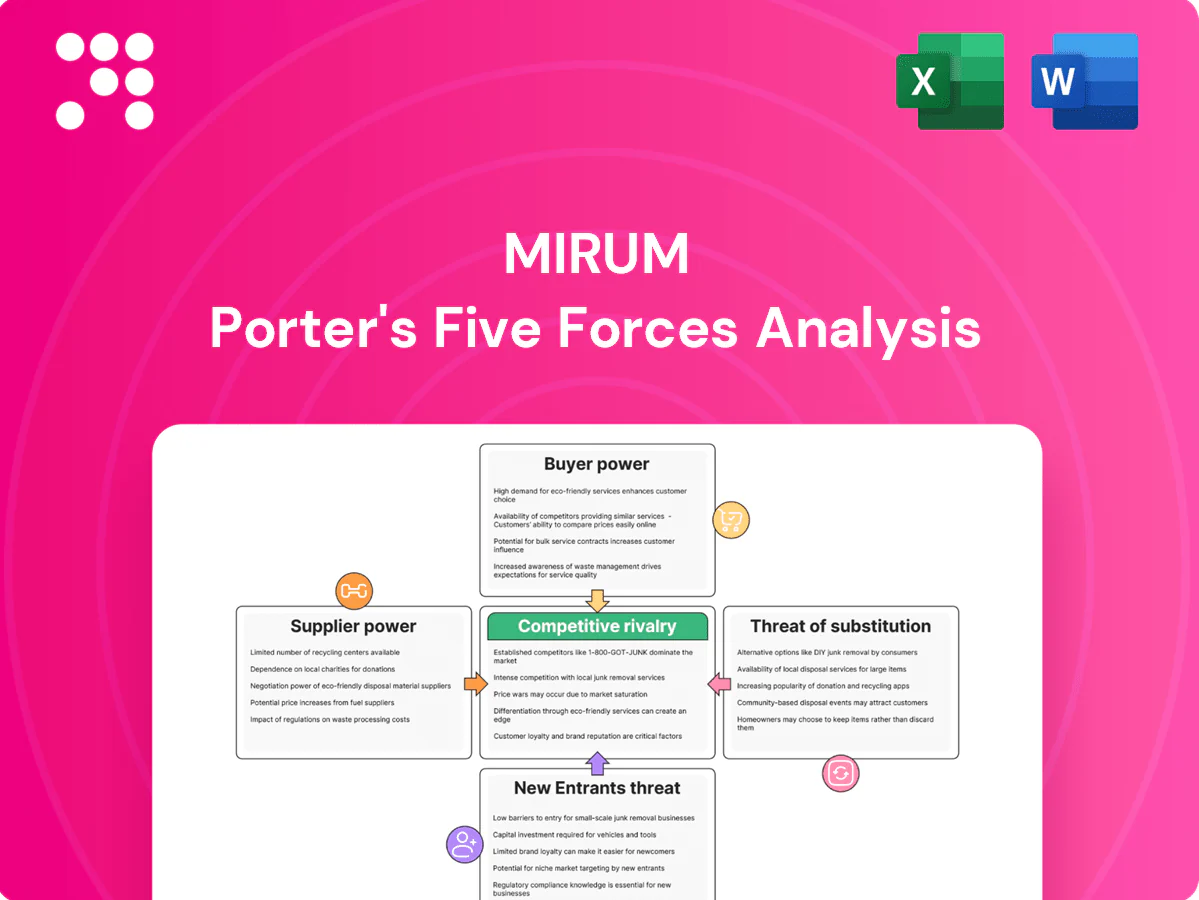
Mirum’s Porter's Five Forces snapshot highlights competitive intensity, supplier and buyer pressures, and key substitute threats shaping its market position. This brief overview teases strategic implications and risks you need to consider. Unlock the full Porter's Five Forces Analysis to explore Mirum’s competitive dynamics, market pressures, and strategic advantages in detail.
Suppliers Bargaining Power

Specialty API/CDMO concentration
Mirum depends on a narrow set of specialty API/CDMO suppliers for cholestatic liver therapies, creating concentrated supplier power; tech transfers and regulatory comparability commonly take 12–24 months, raising switching costs. Quality deviations or capacity constraints can impose 6–12 month timeline setbacks, and dual-sourcing is often infeasible due to strict comparability requirements.
Clinical trial sites/KOL dependence
Rare disease trials rely on scarce experienced centers and KOLs, and as of 2024 ClinicalTrials.gov lists over 7,000 rare disease studies, concentrating demand on a limited pool of investigators. These sites can dictate timelines, per-patient pricing and patient access, increasing development costs and delay risk. Competition for the same investigators amplifies supplier leverage, while geographic concentration raises operational and regulatory exposure.

Biologic materials and assays
Specialized biomarkers, assays and biologic reagents for Mirum often come from niche vendors, giving suppliers high leverage; in 2024 custom antibody and assay lead times commonly remained 8–12 weeks. Validation and consistency needs (acceptable assay CVs typically <15%) make rapid substitution impractical, while proprietary platforms create buyer lock-in and batch variability can delay release testing and compromise study integrity.

Specialty distribution/cold chain
Specialty distribution and cold chain are critical for rare disease drugs, which serve patients across ~7,000 distinct rare conditions, concentrating demand on a small set of qualified logistics partners. Limited qualified partners command service fees and strict SLAs, and distribution failures directly harm patient adherence and outcomes, raising the financial and clinical cost of errors. Manufacturers gain negotiating leverage primarily as volume and portfolio breadth increase.
- Concentration: few qualified distributors
- Cost: premium service fees and SLA penalties
- Leverage: improves only with scale and portfolio diversification
Licensing and IP holders
Pipeline access for Mirum often requires in-licensing from academia or other pharmas; biotech licensing typically carries royalty rates of about 3–7% and milestone payments that can reach low-double to triple-digit millions of dollars, making terms potentially onerous. Renegotiation is rare once clinical value is proven (usually after positive Phase II/III), and IP encumbrances can legally restrict geographic expansion and additional indications.
- royalty rates: 3–7%
- milestones: low-double to triple-digit millions
- renegotiation: uncommon post-Phase II/III
- impact: IP can limit territories and indications
Supply squeeze: tech transfers 12–24 months, assays 8–12 weeks, royalties 3–7%
Mirum relies on narrow API/CDMO suppliers (tech transfers 12–24 months) and scarce rare-disease sites (ClinicalTrials.gov >7,000 studies in 2024), concentrating supplier power; dual-sourcing often infeasible. Specialized assays (lead times 8–12 weeks) and limited cold-chain distributors raise costs and delay risk. In-licensing carries royalties 3–7% and milestones in low-double to triple millions.
| Supplier | Metric | 2024 |
|---|---|---|
| API/CDMO | Tech transfer | 12–24 months |
| Sites/KOLs | Rare-disease studies | >7,000 |
| Assays | Lead time | 8–12 weeks |
| Licensing | Royalties | 3–7% |
What is included in the product
 Detailed Word Document
Tailored Porter's Five Forces analysis for Mirum, uncovering key drivers of competition, buyer and supplier power, entry barriers, substitutes, and emerging threats to its market share, with strategic commentary for investor and management use.

 Customizable Excel Spreadsheet
Mirum's Porter's Five Forces one-sheet distills competitive pressures into a clean radar chart with editable scores—ideal for quick strategy decisions, slide-ready reports, and fast stakeholder alignment.
Customers Bargaining Power

Payers and HTA bodies
Payers and HTA bodies subject high-cost rare-disease therapies to rigorous value assessments; examples like Zolgensma (US list $2.125M) intensify scrutiny. Coverage decisions, prior authorizations and outcomes-based contracts give buyers leverage. Small-population thresholds (EU <5/10,000; US orphan <200,000) and budget-impact concerns make demonstrable QoL and reduced healthcare utilization essential.
Specialty pharmacies/providers
Channel partners like CVS Specialty, Optum and Accredo control distribution and influence patient access, adherence programs and data flows; the top three process over 60% of US specialty prescriptions (2024). Their limited number gives negotiating clout over fees and service expectations. Formulary placement and stocking decisions can materially sway uptake. Performance metrics are increasingly tied to reimbursement.

Hospitals/centers of excellence
In 2024 tertiary hospitals and centers of excellence drive specialty prescribing, accounting for ≥50% of prescriptions in many specialty categories, concentrating institutional leverage. Protocol/P&T committee reviews typically delay adoption by 3–9 months. Payers and hospitals (>60% in 2024 surveys) demand value-in-use and RWD to change standards of care. Significant discounts or patient-support programs are often prerequisites.

Patients and advocacy groups
Rare disease communities are highly organized and vocal, representing about 300 million people globally (WHO) and influencing standards of care; advocacy groups formally inform FDA patient-focused drug development processes. Advocacy input shapes trial design, endpoints and payer dialogues; insurance often mediates individual price sensitivity while manufacturer access programs are expected, raising reputation risk if support is inadequate.
- Advocacy influence: FDA PFDD engagement
- Population: ~300 million global patients
- Access expectation: manufacturer assistance programs
- Risk: reputational damage if support lacking
International price referencing
Global payers benchmark prices across markets, forcing downward pressure on both list and net prices through international price referencing and tiered reimbursement; manufacturers face cascading concessions when lower-reference markets trigger cuts elsewhere. External reference pricing (ERP) continues to transmit discounts across borders, while managed entry agreements increasingly require risk-sharing; by 2024 about 35% of new oncology launches in Europe used MEAs. Parallel trade can compress margins by up to 10% in affected EU corridors.
- Global benchmarking: cross-market price linkage
- ERP effects: concession cascades
- MEAs: ~35% of 2024 EU oncology launches with risk-sharing
- Parallel trade: margin compression up to 10% in some regions
Payers, PBMs & HTA concentrate power — 35% EU MEAs; top 3 US > 60%
Payers, PBMs and HTA bodies exert strong leverage via value assessments, coverage rules and MEAs (Zolgensma US list $2.125M; ~35% EU oncology MEAs in 2024). Top three channel partners process >60% of US specialty scripts (2024), concentrating negotiating power. Tertiary hospitals drive ≥50% of specialty prescribing and demand RWD, while global ERP and parallel trade (≤10% margin hit) compress pricing.
| Buyer segment | Leverage metric | 2024 stat |
|---|---|---|
| Payers/HTA | MEAs, ERP | 35% EU oncology MEAs |
| PBMs | Distribution share | >60% top 3 US |
| Hospitals | Prescribing concentration | ≥50% |
| Global market | Parallel trade impact | ≤10% margin |
Preview Before You Purchase
Mirum Porter's Five Forces Analysis
This Mirum Porter's Five Forces Analysis preview is the exact document you'll receive immediately after purchase—no surprises, no placeholders. The file shown is fully formatted, professionally written, and ready for immediate download and use the moment you buy. You're viewing the final deliverable; no mockups or samples, just the complete analysis you'll get.

Elevate Your Analysis with the Complete Porter's Five Forces Analysis
Mirum’s Porter's Five Forces snapshot highlights competitive intensity, supplier and buyer pressures, and key substitute threats shaping its market position. This brief overview teases strategic implications and risks you need to consider. Unlock the full Porter's Five Forces Analysis to explore Mirum’s competitive dynamics, market pressures, and strategic advantages in detail.
Suppliers Bargaining Power
Specialty API/CDMO concentration
Mirum depends on a narrow set of specialty API/CDMO suppliers for cholestatic liver therapies, creating concentrated supplier power; tech transfers and regulatory comparability commonly take 12–24 months, raising switching costs. Quality deviations or capacity constraints can impose 6–12 month timeline setbacks, and dual-sourcing is often infeasible due to strict comparability requirements.
Clinical trial sites/KOL dependence
Rare disease trials rely on scarce experienced centers and KOLs, and as of 2024 ClinicalTrials.gov lists over 7,000 rare disease studies, concentrating demand on a limited pool of investigators. These sites can dictate timelines, per-patient pricing and patient access, increasing development costs and delay risk. Competition for the same investigators amplifies supplier leverage, while geographic concentration raises operational and regulatory exposure.
Biologic materials and assays
Specialized biomarkers, assays and biologic reagents for Mirum often come from niche vendors, giving suppliers high leverage; in 2024 custom antibody and assay lead times commonly remained 8–12 weeks. Validation and consistency needs (acceptable assay CVs typically <15%) make rapid substitution impractical, while proprietary platforms create buyer lock-in and batch variability can delay release testing and compromise study integrity.
Specialty distribution/cold chain
Specialty distribution and cold chain are critical for rare disease drugs, which serve patients across ~7,000 distinct rare conditions, concentrating demand on a small set of qualified logistics partners. Limited qualified partners command service fees and strict SLAs, and distribution failures directly harm patient adherence and outcomes, raising the financial and clinical cost of errors. Manufacturers gain negotiating leverage primarily as volume and portfolio breadth increase.
- Concentration: few qualified distributors
- Cost: premium service fees and SLA penalties
- Leverage: improves only with scale and portfolio diversification
Licensing and IP holders
Pipeline access for Mirum often requires in-licensing from academia or other pharmas; biotech licensing typically carries royalty rates of about 3–7% and milestone payments that can reach low-double to triple-digit millions of dollars, making terms potentially onerous. Renegotiation is rare once clinical value is proven (usually after positive Phase II/III), and IP encumbrances can legally restrict geographic expansion and additional indications.
- royalty rates: 3–7%
- milestones: low-double to triple-digit millions
- renegotiation: uncommon post-Phase II/III
- impact: IP can limit territories and indications
Supply squeeze: tech transfers 12–24 months, assays 8–12 weeks, royalties 3–7%
Mirum relies on narrow API/CDMO suppliers (tech transfers 12–24 months) and scarce rare-disease sites (ClinicalTrials.gov >7,000 studies in 2024), concentrating supplier power; dual-sourcing often infeasible. Specialized assays (lead times 8–12 weeks) and limited cold-chain distributors raise costs and delay risk. In-licensing carries royalties 3–7% and milestones in low-double to triple millions.
| Supplier | Metric | 2024 |
|---|---|---|
| API/CDMO | Tech transfer | 12–24 months |
| Sites/KOLs | Rare-disease studies | >7,000 |
| Assays | Lead time | 8–12 weeks |
| Licensing | Royalties | 3–7% |
What is included in the product
Detailed Word Document
Tailored Porter's Five Forces analysis for Mirum, uncovering key drivers of competition, buyer and supplier power, entry barriers, substitutes, and emerging threats to its market share, with strategic commentary for investor and management use.
Customizable Excel Spreadsheet
Mirum's Porter's Five Forces one-sheet distills competitive pressures into a clean radar chart with editable scores—ideal for quick strategy decisions, slide-ready reports, and fast stakeholder alignment.
Customers Bargaining Power
Payers and HTA bodies
Payers and HTA bodies subject high-cost rare-disease therapies to rigorous value assessments; examples like Zolgensma (US list $2.125M) intensify scrutiny. Coverage decisions, prior authorizations and outcomes-based contracts give buyers leverage. Small-population thresholds (EU <5/10,000; US orphan <200,000) and budget-impact concerns make demonstrable QoL and reduced healthcare utilization essential.
Specialty pharmacies/providers
Channel partners like CVS Specialty, Optum and Accredo control distribution and influence patient access, adherence programs and data flows; the top three process over 60% of US specialty prescriptions (2024). Their limited number gives negotiating clout over fees and service expectations. Formulary placement and stocking decisions can materially sway uptake. Performance metrics are increasingly tied to reimbursement.
Hospitals/centers of excellence
In 2024 tertiary hospitals and centers of excellence drive specialty prescribing, accounting for ≥50% of prescriptions in many specialty categories, concentrating institutional leverage. Protocol/P&T committee reviews typically delay adoption by 3–9 months. Payers and hospitals (>60% in 2024 surveys) demand value-in-use and RWD to change standards of care. Significant discounts or patient-support programs are often prerequisites.
Patients and advocacy groups
Rare disease communities are highly organized and vocal, representing about 300 million people globally (WHO) and influencing standards of care; advocacy groups formally inform FDA patient-focused drug development processes. Advocacy input shapes trial design, endpoints and payer dialogues; insurance often mediates individual price sensitivity while manufacturer access programs are expected, raising reputation risk if support is inadequate.
- Advocacy influence: FDA PFDD engagement
- Population: ~300 million global patients
- Access expectation: manufacturer assistance programs
- Risk: reputational damage if support lacking
International price referencing
Global payers benchmark prices across markets, forcing downward pressure on both list and net prices through international price referencing and tiered reimbursement; manufacturers face cascading concessions when lower-reference markets trigger cuts elsewhere. External reference pricing (ERP) continues to transmit discounts across borders, while managed entry agreements increasingly require risk-sharing; by 2024 about 35% of new oncology launches in Europe used MEAs. Parallel trade can compress margins by up to 10% in affected EU corridors.
- Global benchmarking: cross-market price linkage
- ERP effects: concession cascades
- MEAs: ~35% of 2024 EU oncology launches with risk-sharing
- Parallel trade: margin compression up to 10% in some regions
Payers, PBMs & HTA concentrate power — 35% EU MEAs; top 3 US > 60%
Payers, PBMs and HTA bodies exert strong leverage via value assessments, coverage rules and MEAs (Zolgensma US list $2.125M; ~35% EU oncology MEAs in 2024). Top three channel partners process >60% of US specialty scripts (2024), concentrating negotiating power. Tertiary hospitals drive ≥50% of specialty prescribing and demand RWD, while global ERP and parallel trade (≤10% margin hit) compress pricing.
| Buyer segment | Leverage metric | 2024 stat |
|---|---|---|
| Payers/HTA | MEAs, ERP | 35% EU oncology MEAs |
| PBMs | Distribution share | >60% top 3 US |
| Hospitals | Prescribing concentration | ≥50% |
| Global market | Parallel trade impact | ≤10% margin |
Preview Before You Purchase
Mirum Porter's Five Forces Analysis
This Mirum Porter's Five Forces Analysis preview is the exact document you'll receive immediately after purchase—no surprises, no placeholders. The file shown is fully formatted, professionally written, and ready for immediate download and use the moment you buy. You're viewing the final deliverable; no mockups or samples, just the complete analysis you'll get.
Description
Elevate Your Analysis with the Complete Porter's Five Forces Analysis
Mirum’s Porter's Five Forces snapshot highlights competitive intensity, supplier and buyer pressures, and key substitute threats shaping its market position. This brief overview teases strategic implications and risks you need to consider. Unlock the full Porter's Five Forces Analysis to explore Mirum’s competitive dynamics, market pressures, and strategic advantages in detail.
Suppliers Bargaining Power
Specialty API/CDMO concentration
Mirum depends on a narrow set of specialty API/CDMO suppliers for cholestatic liver therapies, creating concentrated supplier power; tech transfers and regulatory comparability commonly take 12–24 months, raising switching costs. Quality deviations or capacity constraints can impose 6–12 month timeline setbacks, and dual-sourcing is often infeasible due to strict comparability requirements.
Clinical trial sites/KOL dependence
Rare disease trials rely on scarce experienced centers and KOLs, and as of 2024 ClinicalTrials.gov lists over 7,000 rare disease studies, concentrating demand on a limited pool of investigators. These sites can dictate timelines, per-patient pricing and patient access, increasing development costs and delay risk. Competition for the same investigators amplifies supplier leverage, while geographic concentration raises operational and regulatory exposure.
Biologic materials and assays
Specialized biomarkers, assays and biologic reagents for Mirum often come from niche vendors, giving suppliers high leverage; in 2024 custom antibody and assay lead times commonly remained 8–12 weeks. Validation and consistency needs (acceptable assay CVs typically <15%) make rapid substitution impractical, while proprietary platforms create buyer lock-in and batch variability can delay release testing and compromise study integrity.
Specialty distribution/cold chain
Specialty distribution and cold chain are critical for rare disease drugs, which serve patients across ~7,000 distinct rare conditions, concentrating demand on a small set of qualified logistics partners. Limited qualified partners command service fees and strict SLAs, and distribution failures directly harm patient adherence and outcomes, raising the financial and clinical cost of errors. Manufacturers gain negotiating leverage primarily as volume and portfolio breadth increase.
- Concentration: few qualified distributors
- Cost: premium service fees and SLA penalties
- Leverage: improves only with scale and portfolio diversification
Licensing and IP holders
Pipeline access for Mirum often requires in-licensing from academia or other pharmas; biotech licensing typically carries royalty rates of about 3–7% and milestone payments that can reach low-double to triple-digit millions of dollars, making terms potentially onerous. Renegotiation is rare once clinical value is proven (usually after positive Phase II/III), and IP encumbrances can legally restrict geographic expansion and additional indications.
- royalty rates: 3–7%
- milestones: low-double to triple-digit millions
- renegotiation: uncommon post-Phase II/III
- impact: IP can limit territories and indications
Supply squeeze: tech transfers 12–24 months, assays 8–12 weeks, royalties 3–7%
Mirum relies on narrow API/CDMO suppliers (tech transfers 12–24 months) and scarce rare-disease sites (ClinicalTrials.gov >7,000 studies in 2024), concentrating supplier power; dual-sourcing often infeasible. Specialized assays (lead times 8–12 weeks) and limited cold-chain distributors raise costs and delay risk. In-licensing carries royalties 3–7% and milestones in low-double to triple millions.
| Supplier | Metric | 2024 |
|---|---|---|
| API/CDMO | Tech transfer | 12–24 months |
| Sites/KOLs | Rare-disease studies | >7,000 |
| Assays | Lead time | 8–12 weeks |
| Licensing | Royalties | 3–7% |
What is included in the product
Detailed Word Document
Tailored Porter's Five Forces analysis for Mirum, uncovering key drivers of competition, buyer and supplier power, entry barriers, substitutes, and emerging threats to its market share, with strategic commentary for investor and management use.
Customizable Excel Spreadsheet
Mirum's Porter's Five Forces one-sheet distills competitive pressures into a clean radar chart with editable scores—ideal for quick strategy decisions, slide-ready reports, and fast stakeholder alignment.
Customers Bargaining Power
Payers and HTA bodies
Payers and HTA bodies subject high-cost rare-disease therapies to rigorous value assessments; examples like Zolgensma (US list $2.125M) intensify scrutiny. Coverage decisions, prior authorizations and outcomes-based contracts give buyers leverage. Small-population thresholds (EU <5/10,000; US orphan <200,000) and budget-impact concerns make demonstrable QoL and reduced healthcare utilization essential.
Specialty pharmacies/providers
Channel partners like CVS Specialty, Optum and Accredo control distribution and influence patient access, adherence programs and data flows; the top three process over 60% of US specialty prescriptions (2024). Their limited number gives negotiating clout over fees and service expectations. Formulary placement and stocking decisions can materially sway uptake. Performance metrics are increasingly tied to reimbursement.
Hospitals/centers of excellence
In 2024 tertiary hospitals and centers of excellence drive specialty prescribing, accounting for ≥50% of prescriptions in many specialty categories, concentrating institutional leverage. Protocol/P&T committee reviews typically delay adoption by 3–9 months. Payers and hospitals (>60% in 2024 surveys) demand value-in-use and RWD to change standards of care. Significant discounts or patient-support programs are often prerequisites.
Patients and advocacy groups
Rare disease communities are highly organized and vocal, representing about 300 million people globally (WHO) and influencing standards of care; advocacy groups formally inform FDA patient-focused drug development processes. Advocacy input shapes trial design, endpoints and payer dialogues; insurance often mediates individual price sensitivity while manufacturer access programs are expected, raising reputation risk if support is inadequate.
- Advocacy influence: FDA PFDD engagement
- Population: ~300 million global patients
- Access expectation: manufacturer assistance programs
- Risk: reputational damage if support lacking
International price referencing
Global payers benchmark prices across markets, forcing downward pressure on both list and net prices through international price referencing and tiered reimbursement; manufacturers face cascading concessions when lower-reference markets trigger cuts elsewhere. External reference pricing (ERP) continues to transmit discounts across borders, while managed entry agreements increasingly require risk-sharing; by 2024 about 35% of new oncology launches in Europe used MEAs. Parallel trade can compress margins by up to 10% in affected EU corridors.
- Global benchmarking: cross-market price linkage
- ERP effects: concession cascades
- MEAs: ~35% of 2024 EU oncology launches with risk-sharing
- Parallel trade: margin compression up to 10% in some regions
Payers, PBMs & HTA concentrate power — 35% EU MEAs; top 3 US > 60%
Payers, PBMs and HTA bodies exert strong leverage via value assessments, coverage rules and MEAs (Zolgensma US list $2.125M; ~35% EU oncology MEAs in 2024). Top three channel partners process >60% of US specialty scripts (2024), concentrating negotiating power. Tertiary hospitals drive ≥50% of specialty prescribing and demand RWD, while global ERP and parallel trade (≤10% margin hit) compress pricing.
| Buyer segment | Leverage metric | 2024 stat |
|---|---|---|
| Payers/HTA | MEAs, ERP | 35% EU oncology MEAs |
| PBMs | Distribution share | >60% top 3 US |
| Hospitals | Prescribing concentration | ≥50% |
| Global market | Parallel trade impact | ≤10% margin |
Preview Before You Purchase
Mirum Porter's Five Forces Analysis
This Mirum Porter's Five Forces Analysis preview is the exact document you'll receive immediately after purchase—no surprises, no placeholders. The file shown is fully formatted, professionally written, and ready for immediate download and use the moment you buy. You're viewing the final deliverable; no mockups or samples, just the complete analysis you'll get.











