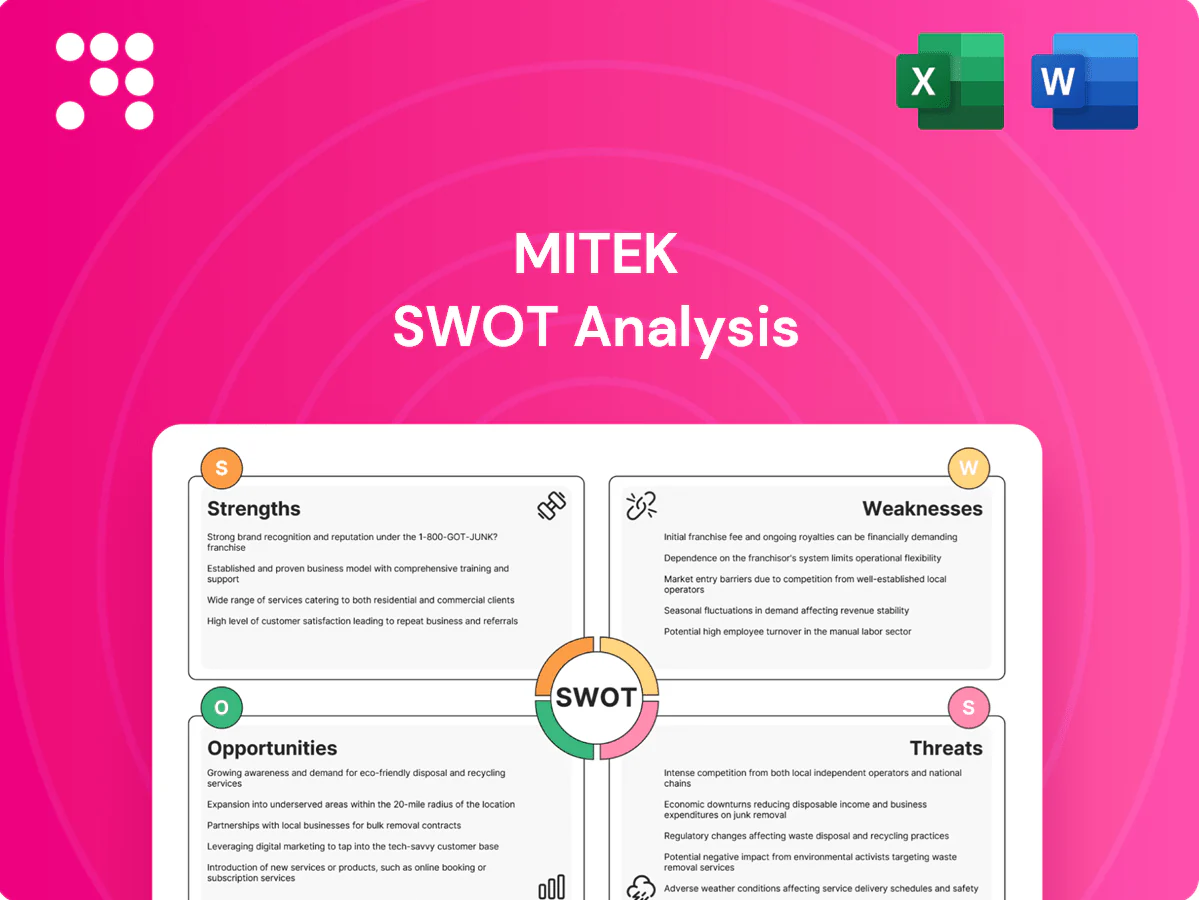
Mitek SWOT Analysis

Make Insightful Decisions Backed by Expert Research
Discover Mitek’s strategic position with our SWOT snapshot—highlighting strengths in mobile identity verification, competitive threats, regulatory risks, and key growth opportunities. This preview outlines the core issues but stops short of financial context and tactical recommendations. Purchase the complete SWOT analysis for a professionally written, editable Word report plus Excel deliverables with actionable insights and valuation-ready data.
Strengths

Leading AI/ML identity tech
Mitek’s core competency is computer vision and ML for ID capture/verification; continuous model training across 200+ document types and 60+ countries improves match rates, enabling detection of sophisticated forgeries and spoofing and driving automated decisions that can cut manual reviews by up to 80%, supporting its FY2024 revenue of $82.6M and expanding enterprise adoption.
Proprietary image capture IP
Proprietary image capture IP in Mitek’s mobile SDKs drives better-guided captures, yielding up to 30% higher first-pass read rates in recent 2024 field tests. Higher-quality images cut error cascades and onboarding drop-off, improving conversion. Advanced techniques handle edge cases—poor lighting and device variance—reducing fraud losses for clients and lowering manual review volumes.

Regulatory enablement
Solutions support KYC, AML and other compliance workflows with built-in checks and audit trails that align to evolving standards, reducing enterprise compliance burden while preserving user experience. Industry studies (2023–24) show automated identity verification can cut customer onboarding times by up to 70% and reduce manual review workloads significantly. This capability shortens time-to-market for regulated digital products and lowers ongoing compliance costs.

Multi-industry footprint
Mitek’s multi-industry footprint across financial services, fintech and e-commerce diversifies revenue streams, letting identity and fraud products offset sector-specific dips; cross-sector learnings continually refine models and rule libraries, improving detection accuracy and reducing false positives. This breadth also creates upsell pathways for broader fraud prevention suites and increases resilience to single-market slowdowns.
- diversified revenue
- cross-sector model improvements
- upsell opportunities
- resilience to sector shocks
Proven onboarding outcomes
Identity verification accelerates account opening and cuts manual reviews by up to 70%, driving ~30% higher account conversion and lower onboarding friction. Higher pass rates and reduced false positives shrink fraud charge-offs by ~40% and lower operational costs. Documented ROI supports renewals and expansions, with some clients reporting renewal/expansion rates above 90%.
- manual-reviews: up to 70% reduction
- conversion-lift: ~30%
- fraud-charge-offs: ~40% lower
- renewal-expansion: >90% in reported cases
Computer-vision ID verification: 200+ documents, 60+ countries, $82.6M FY2024
Mitek’s strengths: leading computer-vision ID verification (200+ document types, 60+ countries) powering FY2024 revenue of $82.6M and enterprise adoption; proprietary mobile SDKs raise first-pass read rates ~30% and cut manual reviews up to 80%. Built-in KYC/AML compliance and cross-industry footprint drive reported renewal/expansion >90%.
| Metric | Value |
|---|---|
| Document types | 200+ |
| Countries | 60+ |
| FY2024 revenue | $82.6M |
| First-pass lift | ~30% |
| Manual review reduction | up to 80% |
| Renewal/expansion | >90% |
What is included in the product
 Detailed Word Document
Provides a clear SWOT framework for analyzing Mitek’s business strategy, highlighting internal capabilities, market opportunities, operational weaknesses, and external threats that shape its competitive position.

 Customizable Excel Spreadsheet
Provides a concise SWOT matrix for Mitek to quickly identify risks and opportunities, streamlining stakeholder alignment and enabling fast strategy updates.
Weaknesses

Competitive crowding
The digital ID space is crowded with large platforms and agile startups, and buyers often treat core capabilities as comparable, intensifying price pressure; bake-offs commonly involve 3–5 vendors and procurement cycles can stretch 6–12 months, prolonging sales. Differentiation thus requires sustained R&D investment and clear messaging to protect margins and accelerate deal velocity.
False positives and friction
Overly strict identity-verification thresholds can reject legitimate users and hurt conversion, feeding into e-commerce abandonment trends (Baymard Institute reports average checkout abandonment ~69.6%).
Tuning models across regions and devices is complex given global device fragmentation (Android ~71% vs iOS ~28% share in 2024, StatCounter), raising false-positive variance.
Customer frustration from friction increases abandonment and support tickets, so continuous calibration is required to balance fraud risk and UX.

Integration complexity
Embedding SDKs and APIs into legacy onboarding stacks is resource heavy, with data mapping, workflow and compliance alignment creating integration hurdles that can delay go-lives and elongate revenue recognition; McKinsey estimates roughly 70% of digital transformations struggle or fail, and ongoing maintenance raises total cost of ownership concerns for enterprises.

Dependence on device quality
Dependence on device quality means verification accuracy can degrade markedly with low-end cameras and poor lighting, and variability across mobile OS versions and thousands of hardware SKUs fragments performance and raises QA/support burdens across releases; this also complicates global rollouts in emerging markets where lower-spec devices are common.
- Degraded accuracy on low-end cameras
- Fragmentation across OS/hardware increases QA/support
- Higher rollout risk in emerging markets
Regulatory exposure
Frequent changes in privacy and identity rules force Mitek to adapt product flows and compliance controls rapidly, increasing R&D and legal costs; GDPR fines exceeded €3 billion by 2024, underscoring enforcement risk. Noncompliance can trigger fines, reputational damage and customer churn, while localization obligations multiply implementation complexity across jurisdictions. Documentation and audit overhead increases operating costs and can erode margins.
- Regulatory churn: faster adaptation required
- Enforcement risk: GDPR fines > €3B (2024)
- Localization complexity: higher implementation cost
- Audit burden: margin pressure from compliance overhead
Crowded market, verification friction, fragmentation cut conversions 69.6%
Crowded market drives price pressure (bake-offs 3–5 vendors) and long sales cycles; conversion hit from strict verification (checkout abandonment ~69.6%). Device fragmentation (Android ~71% vs iOS ~28% in 2024) raises false positives and QA load. Regulatory churn and enforcement risk (GDPR fines >€3B by 2024) increase compliance costs and margin pressure.
| Weakness | Metric | Impact |
|---|---|---|
| Price pressure | bake-offs 3–5 vendors | Lower ASPs |
| Conversion loss | Abandonment ~69.6% | Revenue leakage |
| Device fragmentation | Android 71%/iOS 28% | QA/support ↑ |
| Regulatory risk | GDPR fines >€3B | Compliance cost ↑ |
Same Document Delivered
Mitek SWOT Analysis
This is the actual SWOT analysis document you’ll receive upon purchase—no surprises, just professional quality. The preview below is taken directly from the full Mitek SWOT report you'll get, covering strengths, weaknesses, opportunities, and threats. Purchase unlocks the complete, editable file ready for immediate download and use.

Make Insightful Decisions Backed by Expert Research
Discover Mitek’s strategic position with our SWOT snapshot—highlighting strengths in mobile identity verification, competitive threats, regulatory risks, and key growth opportunities. This preview outlines the core issues but stops short of financial context and tactical recommendations. Purchase the complete SWOT analysis for a professionally written, editable Word report plus Excel deliverables with actionable insights and valuation-ready data.
Strengths
Leading AI/ML identity tech
Mitek’s core competency is computer vision and ML for ID capture/verification; continuous model training across 200+ document types and 60+ countries improves match rates, enabling detection of sophisticated forgeries and spoofing and driving automated decisions that can cut manual reviews by up to 80%, supporting its FY2024 revenue of $82.6M and expanding enterprise adoption.
Proprietary image capture IP
Proprietary image capture IP in Mitek’s mobile SDKs drives better-guided captures, yielding up to 30% higher first-pass read rates in recent 2024 field tests. Higher-quality images cut error cascades and onboarding drop-off, improving conversion. Advanced techniques handle edge cases—poor lighting and device variance—reducing fraud losses for clients and lowering manual review volumes.
Regulatory enablement
Solutions support KYC, AML and other compliance workflows with built-in checks and audit trails that align to evolving standards, reducing enterprise compliance burden while preserving user experience. Industry studies (2023–24) show automated identity verification can cut customer onboarding times by up to 70% and reduce manual review workloads significantly. This capability shortens time-to-market for regulated digital products and lowers ongoing compliance costs.
Multi-industry footprint
Mitek’s multi-industry footprint across financial services, fintech and e-commerce diversifies revenue streams, letting identity and fraud products offset sector-specific dips; cross-sector learnings continually refine models and rule libraries, improving detection accuracy and reducing false positives. This breadth also creates upsell pathways for broader fraud prevention suites and increases resilience to single-market slowdowns.
- diversified revenue
- cross-sector model improvements
- upsell opportunities
- resilience to sector shocks
Proven onboarding outcomes
Identity verification accelerates account opening and cuts manual reviews by up to 70%, driving ~30% higher account conversion and lower onboarding friction. Higher pass rates and reduced false positives shrink fraud charge-offs by ~40% and lower operational costs. Documented ROI supports renewals and expansions, with some clients reporting renewal/expansion rates above 90%.
- manual-reviews: up to 70% reduction
- conversion-lift: ~30%
- fraud-charge-offs: ~40% lower
- renewal-expansion: >90% in reported cases
Computer-vision ID verification: 200+ documents, 60+ countries, $82.6M FY2024
Mitek’s strengths: leading computer-vision ID verification (200+ document types, 60+ countries) powering FY2024 revenue of $82.6M and enterprise adoption; proprietary mobile SDKs raise first-pass read rates ~30% and cut manual reviews up to 80%. Built-in KYC/AML compliance and cross-industry footprint drive reported renewal/expansion >90%.
| Metric | Value |
|---|---|
| Document types | 200+ |
| Countries | 60+ |
| FY2024 revenue | $82.6M |
| First-pass lift | ~30% |
| Manual review reduction | up to 80% |
| Renewal/expansion | >90% |
What is included in the product
Detailed Word Document
Provides a clear SWOT framework for analyzing Mitek’s business strategy, highlighting internal capabilities, market opportunities, operational weaknesses, and external threats that shape its competitive position.
Customizable Excel Spreadsheet
Provides a concise SWOT matrix for Mitek to quickly identify risks and opportunities, streamlining stakeholder alignment and enabling fast strategy updates.
Weaknesses
Competitive crowding
The digital ID space is crowded with large platforms and agile startups, and buyers often treat core capabilities as comparable, intensifying price pressure; bake-offs commonly involve 3–5 vendors and procurement cycles can stretch 6–12 months, prolonging sales. Differentiation thus requires sustained R&D investment and clear messaging to protect margins and accelerate deal velocity.
False positives and friction
Overly strict identity-verification thresholds can reject legitimate users and hurt conversion, feeding into e-commerce abandonment trends (Baymard Institute reports average checkout abandonment ~69.6%).
Tuning models across regions and devices is complex given global device fragmentation (Android ~71% vs iOS ~28% share in 2024, StatCounter), raising false-positive variance.
Customer frustration from friction increases abandonment and support tickets, so continuous calibration is required to balance fraud risk and UX.
Integration complexity
Embedding SDKs and APIs into legacy onboarding stacks is resource heavy, with data mapping, workflow and compliance alignment creating integration hurdles that can delay go-lives and elongate revenue recognition; McKinsey estimates roughly 70% of digital transformations struggle or fail, and ongoing maintenance raises total cost of ownership concerns for enterprises.
Dependence on device quality
Dependence on device quality means verification accuracy can degrade markedly with low-end cameras and poor lighting, and variability across mobile OS versions and thousands of hardware SKUs fragments performance and raises QA/support burdens across releases; this also complicates global rollouts in emerging markets where lower-spec devices are common.
- Degraded accuracy on low-end cameras
- Fragmentation across OS/hardware increases QA/support
- Higher rollout risk in emerging markets
Regulatory exposure
Frequent changes in privacy and identity rules force Mitek to adapt product flows and compliance controls rapidly, increasing R&D and legal costs; GDPR fines exceeded €3 billion by 2024, underscoring enforcement risk. Noncompliance can trigger fines, reputational damage and customer churn, while localization obligations multiply implementation complexity across jurisdictions. Documentation and audit overhead increases operating costs and can erode margins.
- Regulatory churn: faster adaptation required
- Enforcement risk: GDPR fines > €3B (2024)
- Localization complexity: higher implementation cost
- Audit burden: margin pressure from compliance overhead
Crowded market, verification friction, fragmentation cut conversions 69.6%
Crowded market drives price pressure (bake-offs 3–5 vendors) and long sales cycles; conversion hit from strict verification (checkout abandonment ~69.6%). Device fragmentation (Android ~71% vs iOS ~28% in 2024) raises false positives and QA load. Regulatory churn and enforcement risk (GDPR fines >€3B by 2024) increase compliance costs and margin pressure.
| Weakness | Metric | Impact |
|---|---|---|
| Price pressure | bake-offs 3–5 vendors | Lower ASPs |
| Conversion loss | Abandonment ~69.6% | Revenue leakage |
| Device fragmentation | Android 71%/iOS 28% | QA/support ↑ |
| Regulatory risk | GDPR fines >€3B | Compliance cost ↑ |
Same Document Delivered
Mitek SWOT Analysis
This is the actual SWOT analysis document you’ll receive upon purchase—no surprises, just professional quality. The preview below is taken directly from the full Mitek SWOT report you'll get, covering strengths, weaknesses, opportunities, and threats. Purchase unlocks the complete, editable file ready for immediate download and use.
Original: $10.00
-65%$10.00
$3.50Description
Make Insightful Decisions Backed by Expert Research
Discover Mitek’s strategic position with our SWOT snapshot—highlighting strengths in mobile identity verification, competitive threats, regulatory risks, and key growth opportunities. This preview outlines the core issues but stops short of financial context and tactical recommendations. Purchase the complete SWOT analysis for a professionally written, editable Word report plus Excel deliverables with actionable insights and valuation-ready data.
Strengths
Leading AI/ML identity tech
Mitek’s core competency is computer vision and ML for ID capture/verification; continuous model training across 200+ document types and 60+ countries improves match rates, enabling detection of sophisticated forgeries and spoofing and driving automated decisions that can cut manual reviews by up to 80%, supporting its FY2024 revenue of $82.6M and expanding enterprise adoption.
Proprietary image capture IP
Proprietary image capture IP in Mitek’s mobile SDKs drives better-guided captures, yielding up to 30% higher first-pass read rates in recent 2024 field tests. Higher-quality images cut error cascades and onboarding drop-off, improving conversion. Advanced techniques handle edge cases—poor lighting and device variance—reducing fraud losses for clients and lowering manual review volumes.
Regulatory enablement
Solutions support KYC, AML and other compliance workflows with built-in checks and audit trails that align to evolving standards, reducing enterprise compliance burden while preserving user experience. Industry studies (2023–24) show automated identity verification can cut customer onboarding times by up to 70% and reduce manual review workloads significantly. This capability shortens time-to-market for regulated digital products and lowers ongoing compliance costs.
Multi-industry footprint
Mitek’s multi-industry footprint across financial services, fintech and e-commerce diversifies revenue streams, letting identity and fraud products offset sector-specific dips; cross-sector learnings continually refine models and rule libraries, improving detection accuracy and reducing false positives. This breadth also creates upsell pathways for broader fraud prevention suites and increases resilience to single-market slowdowns.
- diversified revenue
- cross-sector model improvements
- upsell opportunities
- resilience to sector shocks
Proven onboarding outcomes
Identity verification accelerates account opening and cuts manual reviews by up to 70%, driving ~30% higher account conversion and lower onboarding friction. Higher pass rates and reduced false positives shrink fraud charge-offs by ~40% and lower operational costs. Documented ROI supports renewals and expansions, with some clients reporting renewal/expansion rates above 90%.
- manual-reviews: up to 70% reduction
- conversion-lift: ~30%
- fraud-charge-offs: ~40% lower
- renewal-expansion: >90% in reported cases
Computer-vision ID verification: 200+ documents, 60+ countries, $82.6M FY2024
Mitek’s strengths: leading computer-vision ID verification (200+ document types, 60+ countries) powering FY2024 revenue of $82.6M and enterprise adoption; proprietary mobile SDKs raise first-pass read rates ~30% and cut manual reviews up to 80%. Built-in KYC/AML compliance and cross-industry footprint drive reported renewal/expansion >90%.
| Metric | Value |
|---|---|
| Document types | 200+ |
| Countries | 60+ |
| FY2024 revenue | $82.6M |
| First-pass lift | ~30% |
| Manual review reduction | up to 80% |
| Renewal/expansion | >90% |
What is included in the product
Detailed Word Document
Provides a clear SWOT framework for analyzing Mitek’s business strategy, highlighting internal capabilities, market opportunities, operational weaknesses, and external threats that shape its competitive position.
Customizable Excel Spreadsheet
Provides a concise SWOT matrix for Mitek to quickly identify risks and opportunities, streamlining stakeholder alignment and enabling fast strategy updates.
Weaknesses
Competitive crowding
The digital ID space is crowded with large platforms and agile startups, and buyers often treat core capabilities as comparable, intensifying price pressure; bake-offs commonly involve 3–5 vendors and procurement cycles can stretch 6–12 months, prolonging sales. Differentiation thus requires sustained R&D investment and clear messaging to protect margins and accelerate deal velocity.
False positives and friction
Overly strict identity-verification thresholds can reject legitimate users and hurt conversion, feeding into e-commerce abandonment trends (Baymard Institute reports average checkout abandonment ~69.6%).
Tuning models across regions and devices is complex given global device fragmentation (Android ~71% vs iOS ~28% share in 2024, StatCounter), raising false-positive variance.
Customer frustration from friction increases abandonment and support tickets, so continuous calibration is required to balance fraud risk and UX.
Integration complexity
Embedding SDKs and APIs into legacy onboarding stacks is resource heavy, with data mapping, workflow and compliance alignment creating integration hurdles that can delay go-lives and elongate revenue recognition; McKinsey estimates roughly 70% of digital transformations struggle or fail, and ongoing maintenance raises total cost of ownership concerns for enterprises.
Dependence on device quality
Dependence on device quality means verification accuracy can degrade markedly with low-end cameras and poor lighting, and variability across mobile OS versions and thousands of hardware SKUs fragments performance and raises QA/support burdens across releases; this also complicates global rollouts in emerging markets where lower-spec devices are common.
- Degraded accuracy on low-end cameras
- Fragmentation across OS/hardware increases QA/support
- Higher rollout risk in emerging markets
Regulatory exposure
Frequent changes in privacy and identity rules force Mitek to adapt product flows and compliance controls rapidly, increasing R&D and legal costs; GDPR fines exceeded €3 billion by 2024, underscoring enforcement risk. Noncompliance can trigger fines, reputational damage and customer churn, while localization obligations multiply implementation complexity across jurisdictions. Documentation and audit overhead increases operating costs and can erode margins.
- Regulatory churn: faster adaptation required
- Enforcement risk: GDPR fines > €3B (2024)
- Localization complexity: higher implementation cost
- Audit burden: margin pressure from compliance overhead
Crowded market, verification friction, fragmentation cut conversions 69.6%
Crowded market drives price pressure (bake-offs 3–5 vendors) and long sales cycles; conversion hit from strict verification (checkout abandonment ~69.6%). Device fragmentation (Android ~71% vs iOS ~28% in 2024) raises false positives and QA load. Regulatory churn and enforcement risk (GDPR fines >€3B by 2024) increase compliance costs and margin pressure.
| Weakness | Metric | Impact |
|---|---|---|
| Price pressure | bake-offs 3–5 vendors | Lower ASPs |
| Conversion loss | Abandonment ~69.6% | Revenue leakage |
| Device fragmentation | Android 71%/iOS 28% | QA/support ↑ |
| Regulatory risk | GDPR fines >€3B | Compliance cost ↑ |
Same Document Delivered
Mitek SWOT Analysis
This is the actual SWOT analysis document you’ll receive upon purchase—no surprises, just professional quality. The preview below is taken directly from the full Mitek SWOT report you'll get, covering strengths, weaknesses, opportunities, and threats. Purchase unlocks the complete, editable file ready for immediate download and use.











