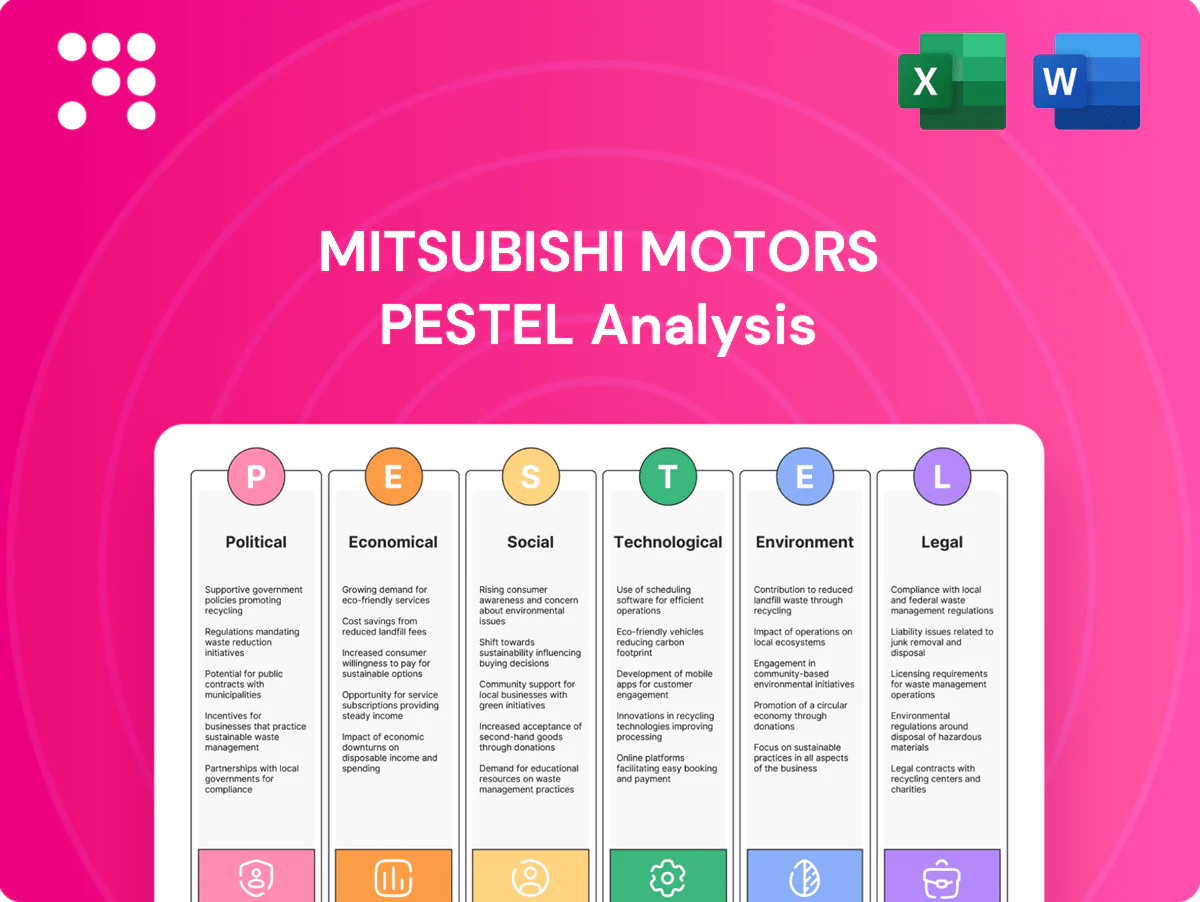
Mitsubishi Motors PESTLE Analysis

Plan Smarter. Present Sharper. Compete Stronger.
Unlock strategic clarity with our concise PESTLE Analysis of Mitsubishi Motors—three-plus key insights into political, economic, social, technological, legal, and environmental forces shaping its future. Ideal for investors and strategists, the full report delivers actionable intelligence and ready-to-use charts—purchase now to get the complete, editable analysis instantly.
Political factors

EV subsidies and industrial policy
Government incentives—notably the US federal EV tax credit up to $7,500 under the Inflation Reduction Act—plus Japan’s and diverse EU and ASEAN purchase and production supports, directly shape Mitsubishi’s electrified mix, pricing vs ICE rivals and margin outlook; prioritizing markets with stable, generous support can boost volumes and margins, while strict subsidy eligibility and localization rules must be monitored for model certification and supply-chain decisions.
Trade tariffs and regional agreements
Tariffs on vehicles and components drive Mitsubishi plant siting and export flows, affecting margins and supply chains. RCEP and FTAs covering about 30% of global GDP lower duties for Asian sourcing and distribution, while U.S.–China tariffs imposed under Section 301 on roughly $550 billion of goods since 2018 raise costs. Strategic use of Thailand and Indonesia hubs mitigates ASEAN duties. Tariff volatility forces dual-sourcing and flexible logistics.

Geopolitical risk and supply security
Conflicts and sanctions can disrupt semiconductors, battery materials and logistics lanes, threatening production; the Suez Canal still handles about 12% of global trade. Political instability in DR Congo (≈70% of global cobalt) and Indonesia (≈50% of nickel output) strains nickel, cobalt and graphite supplies. Diversifying routes and suppliers reduces chokepoint exposure, while insurance and higher inventory buffers increase resilience but raise working capital needs.

Government safety and transport policies
- GSR dates: July 2022 (new types), July 2024 (all new cars)
- London ULEZ expansion: Aug 2023 — clear urban policy precedent
- R&D/packaging: compliance-driven capex reallocation
- Procurement upside: municipal/fleet tenders favor early-compliant models
Local content and industrial localization
Host-country rules in 2024–25, notably in Southeast Asia (Indonesia, Thailand), push automakers toward domestic content, joint ventures and technology transfer; Indonesia targets roughly 40% local content in EV/battery supply chains by 2025, driving Mitsubishi to consider localisation to secure incentives and avoid import quotas. Local assembly cuts FX exposure and logistics, often materially lowering landed costs, but raises capex and complicates quality management and supplier oversight.
- Local mandates: JV/tech transfer required in key markets (Indonesia ~40% local content target by 2025)
- Benefits: reduces FX exposure and logistics costs, secures incentives/quotas
- Tradeoffs: higher upfront capex, added complexity in quality control and supply-chain management
US $7,500 EV credit, RCEP (~30% GDP) & DRC/Indonesia resource risks reshape EV strategy
US IRA EV tax credit up to $7,500, Japan/EU/ASEAN supports and GSR safety rules (July 2022/July 2024) drive Mitsubishi’s EV mix, pricing and R&D timing. RCEP (~30% global GDP) and ASEAN hubs (Thailand/Indonesia) lower tariffs, while US–China tariffs and Section 301 duties add cost pressure. Resource/geopolitical risks (DRC ≈70% cobalt, Indonesia ≈50% nickel) force supplier diversification and higher working-capital buffers.
| Item | Figure |
|---|---|
| US EV credit | $7,500 |
| RCEP share | ~30% GDP |
| DRC cobalt | ≈70% |
| Indonesia nickel | ≈50% |
What is included in the product
 Detailed Word Document
Explores how macro-environmental forces uniquely affect Mitsubishi Motors across Political, Economic, Social, Technological, Environmental and Legal dimensions, with data-backed trends, region-specific regulatory context, forward-looking insights, and actionable implications for executives, investors and strategists.

 Customizable Excel Spreadsheet
A concise, visually segmented Mitsubishi Motors PESTLE summary that distills external risks and market positioning into an easy-reference format, ideal for meetings or presentations and quick team alignment.
Economic factors

FX volatility (JPY vs USD/EUR/ASEAN)
Yen weakness—USD/JPY near 155 in mid‑2025 and EUR/JPY around 170—boosts Mitsubishi Motors’ overseas earnings on translation while raising costs for imported components. A soft JPY improves export pricing power but lifts material and parts bills, squeezing margins. Local production and ASEAN procurement act as natural hedges, stabilizing cost exposure. Active financial hedging remains essential for earnings visibility and risk management.
Commodity and battery material costs
Rising and volatile prices for steel (~$600/t HRC mid-2024), aluminum (~$2,200/t LME 2024) and battery metals drive vehicle economics: lithium and nickel swings have kept OEM EV pack costs sensitive, even as average battery-pack costs fell to about $120/kWh by 2023–24 (BNEF). Battery inputs still represent the majority of cell cost, shaping EV affordability and model mix. Long-term offtakes and recycling reduce spot volatility for lithium/nickel. Cost engineering and platform sharing are essential to defend gross margins.

Global auto demand cyclicality
Recessions, higher policy rates (US Fed funds ~5.25–5.50% in 2024–25) and consumer confidence swings drive pronounced regional volume volatility in light-vehicle markets. Demand for SUVs and commercial vehicles has shown relative resilience in past downturns, cushioning revenue declines. Mitsubishi’s balanced exposure to faster-growing ASEAN (GDP ~4.7% in 2024) helps offset mature-market softness, while flexible production planning reduces inventory-led discounting pressure.

Interest rates and consumer financing
Higher interest rates (US federal funds 5.25–5.50% in 2024–25) raise monthly payments and suppress retail demand, pressuring Mitsubishi Motors retail volumes; captive or partner financing such as Mitsubishi Fuso Finance often supports sales via promotional APRs and term deals. Residual value management enables attractive lease offers, while tight credit-risk controls are crucial in emerging markets with higher default volatility.
- Higher rates: rate-driven demand drag
- Captive financing: promotional APRs sustain retail
- Residuals: key for competitive leases
- Emerging markets: strict credit controls
Supply chain and logistics costs
- Freight rates: Drewry WCI down ~70% vs 2021
- Port congestion: longer dwell times raise costs
- Labor: skilled logistics labor limits throughput
- Strategy: multi-sourcing/nearshoring vs complexity
- Digital: visibility raises turns and fill rates
US $7,500 EV credit, RCEP (~30% GDP) & DRC/Indonesia resource risks reshape EV strategy
Yen near 155 (mid‑2025) boosts translated overseas earnings but raises import costs; local ASEAN production (GDP ~4.7% in 2024) and hedges mitigate exposure. Commodity volatility (HRC ~ $600/t mid‑2024; battery packs ~ $120/kWh 2023–24) keeps EV margins sensitive. Higher rates (Fed 5.25–5.50% 2024–25) and container cost swings (Drewry WCI down ~70% vs 2021) pressure retail demand and logistics.
| Metric | Value |
|---|---|
| USD/JPY | ~155 (mid‑2025) |
| HRC steel | ~$600/t (mid‑2024) |
| Battery pack | ~$120/kWh (2023–24) |
| Fed funds | 5.25–5.50% (2024–25) |
| Drewry WCI | ~70% down vs 2021 |
Preview the Actual Deliverable
Mitsubishi Motors PESTLE Analysis
The Mitsubishi Motors PESTLE Analysis provides concise, actionable insights into political, economic, social, technological, legal and environmental factors affecting the company. The preview shown here is the exact document you’ll receive after purchase—fully formatted and ready to use. No placeholders, no teasers; the content and structure are identical to the downloadable file.

Plan Smarter. Present Sharper. Compete Stronger.
Unlock strategic clarity with our concise PESTLE Analysis of Mitsubishi Motors—three-plus key insights into political, economic, social, technological, legal, and environmental forces shaping its future. Ideal for investors and strategists, the full report delivers actionable intelligence and ready-to-use charts—purchase now to get the complete, editable analysis instantly.
Political factors
EV subsidies and industrial policy
Government incentives—notably the US federal EV tax credit up to $7,500 under the Inflation Reduction Act—plus Japan’s and diverse EU and ASEAN purchase and production supports, directly shape Mitsubishi’s electrified mix, pricing vs ICE rivals and margin outlook; prioritizing markets with stable, generous support can boost volumes and margins, while strict subsidy eligibility and localization rules must be monitored for model certification and supply-chain decisions.
Trade tariffs and regional agreements
Tariffs on vehicles and components drive Mitsubishi plant siting and export flows, affecting margins and supply chains. RCEP and FTAs covering about 30% of global GDP lower duties for Asian sourcing and distribution, while U.S.–China tariffs imposed under Section 301 on roughly $550 billion of goods since 2018 raise costs. Strategic use of Thailand and Indonesia hubs mitigates ASEAN duties. Tariff volatility forces dual-sourcing and flexible logistics.
Geopolitical risk and supply security
Conflicts and sanctions can disrupt semiconductors, battery materials and logistics lanes, threatening production; the Suez Canal still handles about 12% of global trade. Political instability in DR Congo (≈70% of global cobalt) and Indonesia (≈50% of nickel output) strains nickel, cobalt and graphite supplies. Diversifying routes and suppliers reduces chokepoint exposure, while insurance and higher inventory buffers increase resilience but raise working capital needs.
Government safety and transport policies
- GSR dates: July 2022 (new types), July 2024 (all new cars)
- London ULEZ expansion: Aug 2023 — clear urban policy precedent
- R&D/packaging: compliance-driven capex reallocation
- Procurement upside: municipal/fleet tenders favor early-compliant models
Local content and industrial localization
Host-country rules in 2024–25, notably in Southeast Asia (Indonesia, Thailand), push automakers toward domestic content, joint ventures and technology transfer; Indonesia targets roughly 40% local content in EV/battery supply chains by 2025, driving Mitsubishi to consider localisation to secure incentives and avoid import quotas. Local assembly cuts FX exposure and logistics, often materially lowering landed costs, but raises capex and complicates quality management and supplier oversight.
- Local mandates: JV/tech transfer required in key markets (Indonesia ~40% local content target by 2025)
- Benefits: reduces FX exposure and logistics costs, secures incentives/quotas
- Tradeoffs: higher upfront capex, added complexity in quality control and supply-chain management
US $7,500 EV credit, RCEP (~30% GDP) & DRC/Indonesia resource risks reshape EV strategy
US IRA EV tax credit up to $7,500, Japan/EU/ASEAN supports and GSR safety rules (July 2022/July 2024) drive Mitsubishi’s EV mix, pricing and R&D timing. RCEP (~30% global GDP) and ASEAN hubs (Thailand/Indonesia) lower tariffs, while US–China tariffs and Section 301 duties add cost pressure. Resource/geopolitical risks (DRC ≈70% cobalt, Indonesia ≈50% nickel) force supplier diversification and higher working-capital buffers.
| Item | Figure |
|---|---|
| US EV credit | $7,500 |
| RCEP share | ~30% GDP |
| DRC cobalt | ≈70% |
| Indonesia nickel | ≈50% |
What is included in the product
Detailed Word Document
Explores how macro-environmental forces uniquely affect Mitsubishi Motors across Political, Economic, Social, Technological, Environmental and Legal dimensions, with data-backed trends, region-specific regulatory context, forward-looking insights, and actionable implications for executives, investors and strategists.
Customizable Excel Spreadsheet
A concise, visually segmented Mitsubishi Motors PESTLE summary that distills external risks and market positioning into an easy-reference format, ideal for meetings or presentations and quick team alignment.
Economic factors
FX volatility (JPY vs USD/EUR/ASEAN)
Yen weakness—USD/JPY near 155 in mid‑2025 and EUR/JPY around 170—boosts Mitsubishi Motors’ overseas earnings on translation while raising costs for imported components. A soft JPY improves export pricing power but lifts material and parts bills, squeezing margins. Local production and ASEAN procurement act as natural hedges, stabilizing cost exposure. Active financial hedging remains essential for earnings visibility and risk management.
Commodity and battery material costs
Rising and volatile prices for steel (~$600/t HRC mid-2024), aluminum (~$2,200/t LME 2024) and battery metals drive vehicle economics: lithium and nickel swings have kept OEM EV pack costs sensitive, even as average battery-pack costs fell to about $120/kWh by 2023–24 (BNEF). Battery inputs still represent the majority of cell cost, shaping EV affordability and model mix. Long-term offtakes and recycling reduce spot volatility for lithium/nickel. Cost engineering and platform sharing are essential to defend gross margins.
Global auto demand cyclicality
Recessions, higher policy rates (US Fed funds ~5.25–5.50% in 2024–25) and consumer confidence swings drive pronounced regional volume volatility in light-vehicle markets. Demand for SUVs and commercial vehicles has shown relative resilience in past downturns, cushioning revenue declines. Mitsubishi’s balanced exposure to faster-growing ASEAN (GDP ~4.7% in 2024) helps offset mature-market softness, while flexible production planning reduces inventory-led discounting pressure.
Interest rates and consumer financing
Higher interest rates (US federal funds 5.25–5.50% in 2024–25) raise monthly payments and suppress retail demand, pressuring Mitsubishi Motors retail volumes; captive or partner financing such as Mitsubishi Fuso Finance often supports sales via promotional APRs and term deals. Residual value management enables attractive lease offers, while tight credit-risk controls are crucial in emerging markets with higher default volatility.
- Higher rates: rate-driven demand drag
- Captive financing: promotional APRs sustain retail
- Residuals: key for competitive leases
- Emerging markets: strict credit controls
Supply chain and logistics costs
- Freight rates: Drewry WCI down ~70% vs 2021
- Port congestion: longer dwell times raise costs
- Labor: skilled logistics labor limits throughput
- Strategy: multi-sourcing/nearshoring vs complexity
- Digital: visibility raises turns and fill rates
US $7,500 EV credit, RCEP (~30% GDP) & DRC/Indonesia resource risks reshape EV strategy
Yen near 155 (mid‑2025) boosts translated overseas earnings but raises import costs; local ASEAN production (GDP ~4.7% in 2024) and hedges mitigate exposure. Commodity volatility (HRC ~ $600/t mid‑2024; battery packs ~ $120/kWh 2023–24) keeps EV margins sensitive. Higher rates (Fed 5.25–5.50% 2024–25) and container cost swings (Drewry WCI down ~70% vs 2021) pressure retail demand and logistics.
| Metric | Value |
|---|---|
| USD/JPY | ~155 (mid‑2025) |
| HRC steel | ~$600/t (mid‑2024) |
| Battery pack | ~$120/kWh (2023–24) |
| Fed funds | 5.25–5.50% (2024–25) |
| Drewry WCI | ~70% down vs 2021 |
Preview the Actual Deliverable
Mitsubishi Motors PESTLE Analysis
The Mitsubishi Motors PESTLE Analysis provides concise, actionable insights into political, economic, social, technological, legal and environmental factors affecting the company. The preview shown here is the exact document you’ll receive after purchase—fully formatted and ready to use. No placeholders, no teasers; the content and structure are identical to the downloadable file.
Original: $10.00
-65%$10.00
$3.50Description
Plan Smarter. Present Sharper. Compete Stronger.
Unlock strategic clarity with our concise PESTLE Analysis of Mitsubishi Motors—three-plus key insights into political, economic, social, technological, legal, and environmental forces shaping its future. Ideal for investors and strategists, the full report delivers actionable intelligence and ready-to-use charts—purchase now to get the complete, editable analysis instantly.
Political factors
EV subsidies and industrial policy
Government incentives—notably the US federal EV tax credit up to $7,500 under the Inflation Reduction Act—plus Japan’s and diverse EU and ASEAN purchase and production supports, directly shape Mitsubishi’s electrified mix, pricing vs ICE rivals and margin outlook; prioritizing markets with stable, generous support can boost volumes and margins, while strict subsidy eligibility and localization rules must be monitored for model certification and supply-chain decisions.
Trade tariffs and regional agreements
Tariffs on vehicles and components drive Mitsubishi plant siting and export flows, affecting margins and supply chains. RCEP and FTAs covering about 30% of global GDP lower duties for Asian sourcing and distribution, while U.S.–China tariffs imposed under Section 301 on roughly $550 billion of goods since 2018 raise costs. Strategic use of Thailand and Indonesia hubs mitigates ASEAN duties. Tariff volatility forces dual-sourcing and flexible logistics.
Geopolitical risk and supply security
Conflicts and sanctions can disrupt semiconductors, battery materials and logistics lanes, threatening production; the Suez Canal still handles about 12% of global trade. Political instability in DR Congo (≈70% of global cobalt) and Indonesia (≈50% of nickel output) strains nickel, cobalt and graphite supplies. Diversifying routes and suppliers reduces chokepoint exposure, while insurance and higher inventory buffers increase resilience but raise working capital needs.
Government safety and transport policies
- GSR dates: July 2022 (new types), July 2024 (all new cars)
- London ULEZ expansion: Aug 2023 — clear urban policy precedent
- R&D/packaging: compliance-driven capex reallocation
- Procurement upside: municipal/fleet tenders favor early-compliant models
Local content and industrial localization
Host-country rules in 2024–25, notably in Southeast Asia (Indonesia, Thailand), push automakers toward domestic content, joint ventures and technology transfer; Indonesia targets roughly 40% local content in EV/battery supply chains by 2025, driving Mitsubishi to consider localisation to secure incentives and avoid import quotas. Local assembly cuts FX exposure and logistics, often materially lowering landed costs, but raises capex and complicates quality management and supplier oversight.
- Local mandates: JV/tech transfer required in key markets (Indonesia ~40% local content target by 2025)
- Benefits: reduces FX exposure and logistics costs, secures incentives/quotas
- Tradeoffs: higher upfront capex, added complexity in quality control and supply-chain management
US $7,500 EV credit, RCEP (~30% GDP) & DRC/Indonesia resource risks reshape EV strategy
US IRA EV tax credit up to $7,500, Japan/EU/ASEAN supports and GSR safety rules (July 2022/July 2024) drive Mitsubishi’s EV mix, pricing and R&D timing. RCEP (~30% global GDP) and ASEAN hubs (Thailand/Indonesia) lower tariffs, while US–China tariffs and Section 301 duties add cost pressure. Resource/geopolitical risks (DRC ≈70% cobalt, Indonesia ≈50% nickel) force supplier diversification and higher working-capital buffers.
| Item | Figure |
|---|---|
| US EV credit | $7,500 |
| RCEP share | ~30% GDP |
| DRC cobalt | ≈70% |
| Indonesia nickel | ≈50% |
What is included in the product
Detailed Word Document
Explores how macro-environmental forces uniquely affect Mitsubishi Motors across Political, Economic, Social, Technological, Environmental and Legal dimensions, with data-backed trends, region-specific regulatory context, forward-looking insights, and actionable implications for executives, investors and strategists.
Customizable Excel Spreadsheet
A concise, visually segmented Mitsubishi Motors PESTLE summary that distills external risks and market positioning into an easy-reference format, ideal for meetings or presentations and quick team alignment.
Economic factors
FX volatility (JPY vs USD/EUR/ASEAN)
Yen weakness—USD/JPY near 155 in mid‑2025 and EUR/JPY around 170—boosts Mitsubishi Motors’ overseas earnings on translation while raising costs for imported components. A soft JPY improves export pricing power but lifts material and parts bills, squeezing margins. Local production and ASEAN procurement act as natural hedges, stabilizing cost exposure. Active financial hedging remains essential for earnings visibility and risk management.
Commodity and battery material costs
Rising and volatile prices for steel (~$600/t HRC mid-2024), aluminum (~$2,200/t LME 2024) and battery metals drive vehicle economics: lithium and nickel swings have kept OEM EV pack costs sensitive, even as average battery-pack costs fell to about $120/kWh by 2023–24 (BNEF). Battery inputs still represent the majority of cell cost, shaping EV affordability and model mix. Long-term offtakes and recycling reduce spot volatility for lithium/nickel. Cost engineering and platform sharing are essential to defend gross margins.
Global auto demand cyclicality
Recessions, higher policy rates (US Fed funds ~5.25–5.50% in 2024–25) and consumer confidence swings drive pronounced regional volume volatility in light-vehicle markets. Demand for SUVs and commercial vehicles has shown relative resilience in past downturns, cushioning revenue declines. Mitsubishi’s balanced exposure to faster-growing ASEAN (GDP ~4.7% in 2024) helps offset mature-market softness, while flexible production planning reduces inventory-led discounting pressure.
Interest rates and consumer financing
Higher interest rates (US federal funds 5.25–5.50% in 2024–25) raise monthly payments and suppress retail demand, pressuring Mitsubishi Motors retail volumes; captive or partner financing such as Mitsubishi Fuso Finance often supports sales via promotional APRs and term deals. Residual value management enables attractive lease offers, while tight credit-risk controls are crucial in emerging markets with higher default volatility.
- Higher rates: rate-driven demand drag
- Captive financing: promotional APRs sustain retail
- Residuals: key for competitive leases
- Emerging markets: strict credit controls
Supply chain and logistics costs
- Freight rates: Drewry WCI down ~70% vs 2021
- Port congestion: longer dwell times raise costs
- Labor: skilled logistics labor limits throughput
- Strategy: multi-sourcing/nearshoring vs complexity
- Digital: visibility raises turns and fill rates
US $7,500 EV credit, RCEP (~30% GDP) & DRC/Indonesia resource risks reshape EV strategy
Yen near 155 (mid‑2025) boosts translated overseas earnings but raises import costs; local ASEAN production (GDP ~4.7% in 2024) and hedges mitigate exposure. Commodity volatility (HRC ~ $600/t mid‑2024; battery packs ~ $120/kWh 2023–24) keeps EV margins sensitive. Higher rates (Fed 5.25–5.50% 2024–25) and container cost swings (Drewry WCI down ~70% vs 2021) pressure retail demand and logistics.
| Metric | Value |
|---|---|
| USD/JPY | ~155 (mid‑2025) |
| HRC steel | ~$600/t (mid‑2024) |
| Battery pack | ~$120/kWh (2023–24) |
| Fed funds | 5.25–5.50% (2024–25) |
| Drewry WCI | ~70% down vs 2021 |
Preview the Actual Deliverable
Mitsubishi Motors PESTLE Analysis
The Mitsubishi Motors PESTLE Analysis provides concise, actionable insights into political, economic, social, technological, legal and environmental factors affecting the company. The preview shown here is the exact document you’ll receive after purchase—fully formatted and ready to use. No placeholders, no teasers; the content and structure are identical to the downloadable file.











