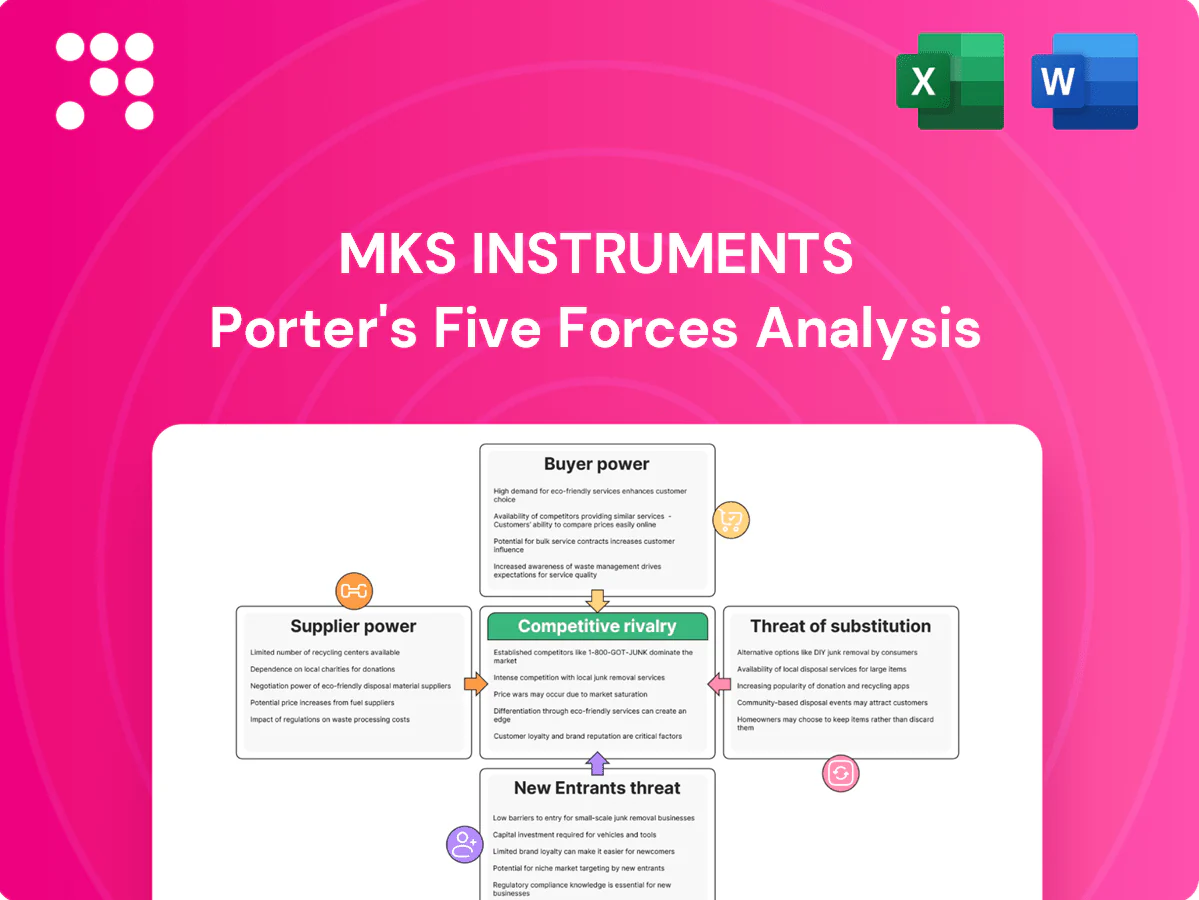
MKS Instruments Porter's Five Forces Analysis

Elevate Your Analysis with the Complete Porter's Five Forces Analysis
MKS Instruments faces moderate supplier power, high buyer sophistication in semiconductor markets, intense rivalry from established process-equipment firms, moderate threat of substitutes, and barriers that limit new entrants but don't eliminate niche challengers. This brief snapshot only scratches the surface. Unlock the full Porter's Five Forces Analysis to explore MKS Instruments’s competitive dynamics, market pressures, and strategic advantages in detail.
Suppliers Bargaining Power

Specialized components
MKS depends on precision optics, RF power modules, vacuum components and high‑purity gas handling parts that only a handful of vendors supply, giving suppliers leverage over custom specs and tight tolerances. In FY2024 MKS reported about $1.8B revenue, using its scale and engineering depth to co‑develop components and secure longer‑term pricing and IP terms. Where feasible MKS pursues dual‑sourcing and vertical qualification to blunt supplier pricing pressure.
Switching costs
Once a supplier part is qualified in a mission-critical tool, requalification is lengthy—2024 SEMI industry data shows typical qualification cycles of 6–12 months—and costly, often running into the low hundreds of thousands to low millions of dollars, creating strong stickiness and bargaining power for incumbent suppliers. MKS mitigates this by using modular designs and approved-vendor lists to shorten changeover. Despite these measures, time-to-qualify usually outweighs short-term price gains for customers, preserving supplier leverage.

Supplier concentration
Key inputs such as advanced power semiconductors, precision ceramics and vacuum pumps are sourced from a relatively concentrated global supplier base, with regional clusters in East Asia increasing tightness; MKS offsets this through multi-year supply agreements and demand forecasts to secure capacity, and by geographically diversifying sourcing to reduce single-point failures.

Supply chain risk
Supply chain risk: lead-time volatility, export controls and geopolitical disruptions strain availability and can shift supplier allocation toward larger OEMs or higher-margin segments, pressuring MKS’s sourcing flexibility.
MKS hedges with safety stock and near-shore alternatives and applies design-for-supply to reduce exposure to scarce materials and requalify substitutes.
- Lead-time volatility: suppliers favor larger OEMs
- Export controls & geo disruptions raise risk
- Mitigation: safety stock, near-shore, design-for-supply
Buyer pull-through
Large end-customers can force approved-part mandates that dilute MKS’s negotiating leverage on specialty components, especially as MKS reported roughly $3.08 billion revenue in FY2024, increasing dependence on key OEMs.
Joint roadmaps with customers and suppliers align specs and volumes, while tri-party collaboration in 2024 reduced lead-time volatility and helped stabilize pricing and delivery for critical modules.
- Buyer pull-through: approved-part mandates reduce supplier leverage
- 2024 context: MKS revenue ~3.08 billion — exposure to major OEMs
- Joint roadmaps: align specs/volumes, lower supply risk
- Tri-party collaboration: stabilizes pricing and delivery
Supplier concentration and 6-12 month qualification cycles; company scale $3.08B mitigates risk
Suppliers of precision optics, RF modules and vacuum systems hold notable leverage due to concentration and lengthy 6–12 month qualification cycles; MKS’s FY2024 revenue ~3.08B gives it scale to co-develop parts and secure multi-year agreements. MKS mitigates risk with dual-sourcing, safety stock, near-shore alternatives and design-for-supply but supplier stickiness remains a constraint.
| Metric | 2024 |
|---|---|
| Revenue | $3.08B |
| Qualify cycle | 6–12 months |
| Mitigations | Dual-source, safety stock, near-shore |
What is included in the product
 Detailed Word Document
Tailored Porter's Five Forces analysis for MKS Instruments revealing competitive intensity, buyer/supplier leverage, threat of substitutes and new entrants, and strategic barriers that protect or expose its market position.

 Customizable Excel Spreadsheet
One-sheet Porter’s Five Forces for MKS Instruments—instantly visualizes competitive pressure with a spider chart and clean layout for quick boardroom decisions. Customize force levels, swap in your data, and duplicate tabs for different scenarios without macros so non-finance teams can update and present confidently.
Customers Bargaining Power

Customer concentration
Semiconductor device makers and OEMs are large, sophisticated buyers—top OEMs and IDMs account for roughly 60% of global fab-equipment spend, concentrating volume and amplifying price sensitivity and negotiation clout. Consolidation among these buyers increases leverage, making framework agreements and preferred-vendor status critical to retain share. Losing a top account can materially impact MKS revenue given customer concentration.
High switching costs
Once integrated, MKS subsystems require process requalification to swap, often taking weeks to months and creating downtime and yield risks that deter switching on price alone. These operational barriers materially reduce buyer power after install, as customers face production and qualification costs. Upfront, however, buyers still extract concessions during tool design-in and specification negotiations.

Cyclical capex
Semiconductor and industrial cycles drive volatile procurement, with buyers in 2023–2024 squeezing pricing and extending payment terms during downturns. MKS offsets pressure by selling value-based pricing linked to throughput and yield and by growing service and spares revenue, which MKS reported as roughly one-third of sales in FY2024. Long-term service contracts smooth revenue across cycles and reduce customer bargaining leverage.

Performance differentiation
Buyers prioritize precision, stability and uptime over lowest price, limiting pure price leverage; MKS reported fiscal 2024 revenue of about $1.90 billion, reflecting willingness to pay for differentiated systems. Demonstrable process-control gains from MKS’s integrated sensors, vacuum and gas controls plus analytics support justify premium pricing and reduce churn. Global field service and spare-parts networks further anchor long-term customer relationships and uptime commitments.
- Precision-first purchasing
- Process-control reduces price pressure
- Integrated solutions justify premiums
- Field service anchors retention
Qualification barriers
Stringent quality, cleanliness and compliance requirements in semiconductor and advanced manufacturing narrow buyer alternatives, with equipment qualification cycles commonly taking 12–18 months and requalification adding months per change. Approved-vendor lists mean once qualified vendors are favored, reducing switch likelihood. MKS counters by investing in reliability data, industry certifications and co-development partnerships that embed its tools into customer roadmaps.
- qualification cycles: 12–18 months
- approved-vendor lists: constrain post-qualification switching
- MKS strategy: reliability data, certifications, co-development
OEM/IDM concentration ~60% raises account risk; service spares steady
Large, consolidated OEMs/IDMs drive ~60% of fab-equipment spend, concentrating negotiation leverage and making loss of a major account materially impactful for MKS. Post-install switching costs and qualification cycles of 12–18 months materially reduce buyer power, while service and spares (≈33% of FY2024 sales) smooth revenue. MKS reported FY2024 revenue of about $1.90B and uses value-based pricing, integrated solutions and global field service to defend pricing and retention.
| Metric | 2024 value |
|---|---|
| FY2024 revenue | $1.90B |
| Service & spares | ≈33% of sales |
| Buyer concentration (top OEMs/IDMs) | ~60% of fab-equipment spend |
| Qualification cycle | 12–18 months |
Preview the Actual Deliverable
MKS Instruments Porter's Five Forces Analysis
This preview shows the exact MKS Instruments Porter's Five Forces analysis you'll receive upon purchase—no placeholders or summaries. It contains the full, professionally formatted evaluation of competitive rivalry, supplier power, buyer power, and threats of entry and substitutes. You'll get instant access to this same downloadable file immediately after payment.

Elevate Your Analysis with the Complete Porter's Five Forces Analysis
MKS Instruments faces moderate supplier power, high buyer sophistication in semiconductor markets, intense rivalry from established process-equipment firms, moderate threat of substitutes, and barriers that limit new entrants but don't eliminate niche challengers. This brief snapshot only scratches the surface. Unlock the full Porter's Five Forces Analysis to explore MKS Instruments’s competitive dynamics, market pressures, and strategic advantages in detail.
Suppliers Bargaining Power
Specialized components
MKS depends on precision optics, RF power modules, vacuum components and high‑purity gas handling parts that only a handful of vendors supply, giving suppliers leverage over custom specs and tight tolerances. In FY2024 MKS reported about $1.8B revenue, using its scale and engineering depth to co‑develop components and secure longer‑term pricing and IP terms. Where feasible MKS pursues dual‑sourcing and vertical qualification to blunt supplier pricing pressure.
Switching costs
Once a supplier part is qualified in a mission-critical tool, requalification is lengthy—2024 SEMI industry data shows typical qualification cycles of 6–12 months—and costly, often running into the low hundreds of thousands to low millions of dollars, creating strong stickiness and bargaining power for incumbent suppliers. MKS mitigates this by using modular designs and approved-vendor lists to shorten changeover. Despite these measures, time-to-qualify usually outweighs short-term price gains for customers, preserving supplier leverage.
Supplier concentration
Key inputs such as advanced power semiconductors, precision ceramics and vacuum pumps are sourced from a relatively concentrated global supplier base, with regional clusters in East Asia increasing tightness; MKS offsets this through multi-year supply agreements and demand forecasts to secure capacity, and by geographically diversifying sourcing to reduce single-point failures.
Supply chain risk
Supply chain risk: lead-time volatility, export controls and geopolitical disruptions strain availability and can shift supplier allocation toward larger OEMs or higher-margin segments, pressuring MKS’s sourcing flexibility.
MKS hedges with safety stock and near-shore alternatives and applies design-for-supply to reduce exposure to scarce materials and requalify substitutes.
- Lead-time volatility: suppliers favor larger OEMs
- Export controls & geo disruptions raise risk
- Mitigation: safety stock, near-shore, design-for-supply
Buyer pull-through
Large end-customers can force approved-part mandates that dilute MKS’s negotiating leverage on specialty components, especially as MKS reported roughly $3.08 billion revenue in FY2024, increasing dependence on key OEMs.
Joint roadmaps with customers and suppliers align specs and volumes, while tri-party collaboration in 2024 reduced lead-time volatility and helped stabilize pricing and delivery for critical modules.
- Buyer pull-through: approved-part mandates reduce supplier leverage
- 2024 context: MKS revenue ~3.08 billion — exposure to major OEMs
- Joint roadmaps: align specs/volumes, lower supply risk
- Tri-party collaboration: stabilizes pricing and delivery
Supplier concentration and 6-12 month qualification cycles; company scale $3.08B mitigates risk
Suppliers of precision optics, RF modules and vacuum systems hold notable leverage due to concentration and lengthy 6–12 month qualification cycles; MKS’s FY2024 revenue ~3.08B gives it scale to co-develop parts and secure multi-year agreements. MKS mitigates risk with dual-sourcing, safety stock, near-shore alternatives and design-for-supply but supplier stickiness remains a constraint.
| Metric | 2024 |
|---|---|
| Revenue | $3.08B |
| Qualify cycle | 6–12 months |
| Mitigations | Dual-source, safety stock, near-shore |
What is included in the product
Detailed Word Document
Tailored Porter's Five Forces analysis for MKS Instruments revealing competitive intensity, buyer/supplier leverage, threat of substitutes and new entrants, and strategic barriers that protect or expose its market position.
Customizable Excel Spreadsheet
One-sheet Porter’s Five Forces for MKS Instruments—instantly visualizes competitive pressure with a spider chart and clean layout for quick boardroom decisions. Customize force levels, swap in your data, and duplicate tabs for different scenarios without macros so non-finance teams can update and present confidently.
Customers Bargaining Power
Customer concentration
Semiconductor device makers and OEMs are large, sophisticated buyers—top OEMs and IDMs account for roughly 60% of global fab-equipment spend, concentrating volume and amplifying price sensitivity and negotiation clout. Consolidation among these buyers increases leverage, making framework agreements and preferred-vendor status critical to retain share. Losing a top account can materially impact MKS revenue given customer concentration.
High switching costs
Once integrated, MKS subsystems require process requalification to swap, often taking weeks to months and creating downtime and yield risks that deter switching on price alone. These operational barriers materially reduce buyer power after install, as customers face production and qualification costs. Upfront, however, buyers still extract concessions during tool design-in and specification negotiations.
Cyclical capex
Semiconductor and industrial cycles drive volatile procurement, with buyers in 2023–2024 squeezing pricing and extending payment terms during downturns. MKS offsets pressure by selling value-based pricing linked to throughput and yield and by growing service and spares revenue, which MKS reported as roughly one-third of sales in FY2024. Long-term service contracts smooth revenue across cycles and reduce customer bargaining leverage.
Performance differentiation
Buyers prioritize precision, stability and uptime over lowest price, limiting pure price leverage; MKS reported fiscal 2024 revenue of about $1.90 billion, reflecting willingness to pay for differentiated systems. Demonstrable process-control gains from MKS’s integrated sensors, vacuum and gas controls plus analytics support justify premium pricing and reduce churn. Global field service and spare-parts networks further anchor long-term customer relationships and uptime commitments.
- Precision-first purchasing
- Process-control reduces price pressure
- Integrated solutions justify premiums
- Field service anchors retention
Qualification barriers
Stringent quality, cleanliness and compliance requirements in semiconductor and advanced manufacturing narrow buyer alternatives, with equipment qualification cycles commonly taking 12–18 months and requalification adding months per change. Approved-vendor lists mean once qualified vendors are favored, reducing switch likelihood. MKS counters by investing in reliability data, industry certifications and co-development partnerships that embed its tools into customer roadmaps.
- qualification cycles: 12–18 months
- approved-vendor lists: constrain post-qualification switching
- MKS strategy: reliability data, certifications, co-development
OEM/IDM concentration ~60% raises account risk; service spares steady
Large, consolidated OEMs/IDMs drive ~60% of fab-equipment spend, concentrating negotiation leverage and making loss of a major account materially impactful for MKS. Post-install switching costs and qualification cycles of 12–18 months materially reduce buyer power, while service and spares (≈33% of FY2024 sales) smooth revenue. MKS reported FY2024 revenue of about $1.90B and uses value-based pricing, integrated solutions and global field service to defend pricing and retention.
| Metric | 2024 value |
|---|---|
| FY2024 revenue | $1.90B |
| Service & spares | ≈33% of sales |
| Buyer concentration (top OEMs/IDMs) | ~60% of fab-equipment spend |
| Qualification cycle | 12–18 months |
Preview the Actual Deliverable
MKS Instruments Porter's Five Forces Analysis
This preview shows the exact MKS Instruments Porter's Five Forces analysis you'll receive upon purchase—no placeholders or summaries. It contains the full, professionally formatted evaluation of competitive rivalry, supplier power, buyer power, and threats of entry and substitutes. You'll get instant access to this same downloadable file immediately after payment.
Original: $10.00
-65%$10.00
$3.50Description
Elevate Your Analysis with the Complete Porter's Five Forces Analysis
MKS Instruments faces moderate supplier power, high buyer sophistication in semiconductor markets, intense rivalry from established process-equipment firms, moderate threat of substitutes, and barriers that limit new entrants but don't eliminate niche challengers. This brief snapshot only scratches the surface. Unlock the full Porter's Five Forces Analysis to explore MKS Instruments’s competitive dynamics, market pressures, and strategic advantages in detail.
Suppliers Bargaining Power
Specialized components
MKS depends on precision optics, RF power modules, vacuum components and high‑purity gas handling parts that only a handful of vendors supply, giving suppliers leverage over custom specs and tight tolerances. In FY2024 MKS reported about $1.8B revenue, using its scale and engineering depth to co‑develop components and secure longer‑term pricing and IP terms. Where feasible MKS pursues dual‑sourcing and vertical qualification to blunt supplier pricing pressure.
Switching costs
Once a supplier part is qualified in a mission-critical tool, requalification is lengthy—2024 SEMI industry data shows typical qualification cycles of 6–12 months—and costly, often running into the low hundreds of thousands to low millions of dollars, creating strong stickiness and bargaining power for incumbent suppliers. MKS mitigates this by using modular designs and approved-vendor lists to shorten changeover. Despite these measures, time-to-qualify usually outweighs short-term price gains for customers, preserving supplier leverage.
Supplier concentration
Key inputs such as advanced power semiconductors, precision ceramics and vacuum pumps are sourced from a relatively concentrated global supplier base, with regional clusters in East Asia increasing tightness; MKS offsets this through multi-year supply agreements and demand forecasts to secure capacity, and by geographically diversifying sourcing to reduce single-point failures.
Supply chain risk
Supply chain risk: lead-time volatility, export controls and geopolitical disruptions strain availability and can shift supplier allocation toward larger OEMs or higher-margin segments, pressuring MKS’s sourcing flexibility.
MKS hedges with safety stock and near-shore alternatives and applies design-for-supply to reduce exposure to scarce materials and requalify substitutes.
- Lead-time volatility: suppliers favor larger OEMs
- Export controls & geo disruptions raise risk
- Mitigation: safety stock, near-shore, design-for-supply
Buyer pull-through
Large end-customers can force approved-part mandates that dilute MKS’s negotiating leverage on specialty components, especially as MKS reported roughly $3.08 billion revenue in FY2024, increasing dependence on key OEMs.
Joint roadmaps with customers and suppliers align specs and volumes, while tri-party collaboration in 2024 reduced lead-time volatility and helped stabilize pricing and delivery for critical modules.
- Buyer pull-through: approved-part mandates reduce supplier leverage
- 2024 context: MKS revenue ~3.08 billion — exposure to major OEMs
- Joint roadmaps: align specs/volumes, lower supply risk
- Tri-party collaboration: stabilizes pricing and delivery
Supplier concentration and 6-12 month qualification cycles; company scale $3.08B mitigates risk
Suppliers of precision optics, RF modules and vacuum systems hold notable leverage due to concentration and lengthy 6–12 month qualification cycles; MKS’s FY2024 revenue ~3.08B gives it scale to co-develop parts and secure multi-year agreements. MKS mitigates risk with dual-sourcing, safety stock, near-shore alternatives and design-for-supply but supplier stickiness remains a constraint.
| Metric | 2024 |
|---|---|
| Revenue | $3.08B |
| Qualify cycle | 6–12 months |
| Mitigations | Dual-source, safety stock, near-shore |
What is included in the product
Detailed Word Document
Tailored Porter's Five Forces analysis for MKS Instruments revealing competitive intensity, buyer/supplier leverage, threat of substitutes and new entrants, and strategic barriers that protect or expose its market position.
Customizable Excel Spreadsheet
One-sheet Porter’s Five Forces for MKS Instruments—instantly visualizes competitive pressure with a spider chart and clean layout for quick boardroom decisions. Customize force levels, swap in your data, and duplicate tabs for different scenarios without macros so non-finance teams can update and present confidently.
Customers Bargaining Power
Customer concentration
Semiconductor device makers and OEMs are large, sophisticated buyers—top OEMs and IDMs account for roughly 60% of global fab-equipment spend, concentrating volume and amplifying price sensitivity and negotiation clout. Consolidation among these buyers increases leverage, making framework agreements and preferred-vendor status critical to retain share. Losing a top account can materially impact MKS revenue given customer concentration.
High switching costs
Once integrated, MKS subsystems require process requalification to swap, often taking weeks to months and creating downtime and yield risks that deter switching on price alone. These operational barriers materially reduce buyer power after install, as customers face production and qualification costs. Upfront, however, buyers still extract concessions during tool design-in and specification negotiations.
Cyclical capex
Semiconductor and industrial cycles drive volatile procurement, with buyers in 2023–2024 squeezing pricing and extending payment terms during downturns. MKS offsets pressure by selling value-based pricing linked to throughput and yield and by growing service and spares revenue, which MKS reported as roughly one-third of sales in FY2024. Long-term service contracts smooth revenue across cycles and reduce customer bargaining leverage.
Performance differentiation
Buyers prioritize precision, stability and uptime over lowest price, limiting pure price leverage; MKS reported fiscal 2024 revenue of about $1.90 billion, reflecting willingness to pay for differentiated systems. Demonstrable process-control gains from MKS’s integrated sensors, vacuum and gas controls plus analytics support justify premium pricing and reduce churn. Global field service and spare-parts networks further anchor long-term customer relationships and uptime commitments.
- Precision-first purchasing
- Process-control reduces price pressure
- Integrated solutions justify premiums
- Field service anchors retention
Qualification barriers
Stringent quality, cleanliness and compliance requirements in semiconductor and advanced manufacturing narrow buyer alternatives, with equipment qualification cycles commonly taking 12–18 months and requalification adding months per change. Approved-vendor lists mean once qualified vendors are favored, reducing switch likelihood. MKS counters by investing in reliability data, industry certifications and co-development partnerships that embed its tools into customer roadmaps.
- qualification cycles: 12–18 months
- approved-vendor lists: constrain post-qualification switching
- MKS strategy: reliability data, certifications, co-development
OEM/IDM concentration ~60% raises account risk; service spares steady
Large, consolidated OEMs/IDMs drive ~60% of fab-equipment spend, concentrating negotiation leverage and making loss of a major account materially impactful for MKS. Post-install switching costs and qualification cycles of 12–18 months materially reduce buyer power, while service and spares (≈33% of FY2024 sales) smooth revenue. MKS reported FY2024 revenue of about $1.90B and uses value-based pricing, integrated solutions and global field service to defend pricing and retention.
| Metric | 2024 value |
|---|---|
| FY2024 revenue | $1.90B |
| Service & spares | ≈33% of sales |
| Buyer concentration (top OEMs/IDMs) | ~60% of fab-equipment spend |
| Qualification cycle | 12–18 months |
Preview the Actual Deliverable
MKS Instruments Porter's Five Forces Analysis
This preview shows the exact MKS Instruments Porter's Five Forces analysis you'll receive upon purchase—no placeholders or summaries. It contains the full, professionally formatted evaluation of competitive rivalry, supplier power, buyer power, and threats of entry and substitutes. You'll get instant access to this same downloadable file immediately after payment.











