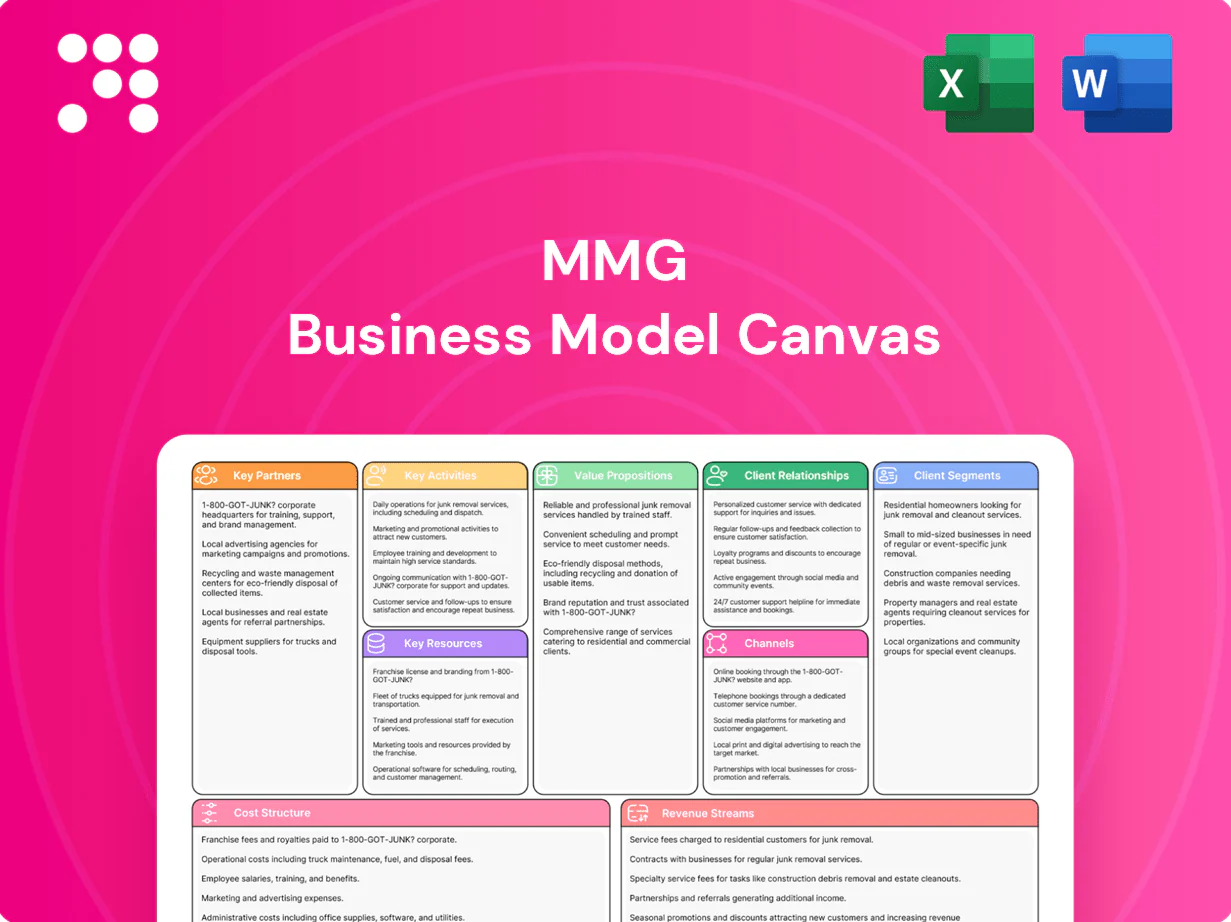
MMG Business Model Canvas

Unlock the strategic Business Model Canvas: value propositions, revenue, partners, cost structure
Unlock the full strategic blueprint behind MMG’s business model. This in-depth Business Model Canvas maps value propositions, revenue streams, key partners and cost structure to show how MMG captures market share and scales. Download the complete Word/Excel canvas for actionable insights and benchmarking.
Partnerships

Governments and Regulators
Host-country ministries, environmental authorities and permitting bodies enable MMG’s access and compliance across Australia, Africa and South America, reducing license and renewal risk. Stable regulatory relationships de-risk permitting and support predictable timelines. Collaboration with authorities underpins local employment, infrastructure and social performance. Predictable regulation reduces project delays and cost overruns.
Smelters, Refiners, and Offtake Buyers
Long-term offtake partners (typically 3–5 year contracts) secure steady demand for MMG copper and zinc concentrates and de-risk price exposure. Technical interfaces align on specifications, penalties and impurity management to protect payability and metallurgical returns. Prepayment or floor-price structures, often funding up to ~30% of concentrate value, enhance liquidity and balance-sheet flexibility. Joint planning with smelters improves shipment cadence and inventory turns.

EPCM, OEMs, and Maintenance Vendors
Engineering, procurement and construction management partners and OEMs design, build and sustain MMG’s mining and processing assets, underpinning capital projects often representing 60–70% of total mine capex in 2024. OEM alliances have been shown to improve fleet availability by 10–15% and throughput accordingly. Condition-based maintenance programs cut unplanned downtime by roughly 20–40% and lower unit costs. Shared innovation between EPCM, OEMs and maintenance vendors accelerates productivity and safety gains, often delivering single-digit to low-double-digit percent improvements.

Logistics, Port, and Shipping Providers
Rail, road and port operators secure concentrate evacuation with integrated rail-port corridors, cutting transit variability; freight forwarders optimize routes and Incoterms to lower landed cost. Integrated scheduling reduced demurrage exposure in 2024, where peak demurrage exceeded $1,200/day on some trade lanes, and multi-nodal options improved resilience during regional disruptions.
- Rail-road-port corridors
- Freight forwarders & Incoterms
- Integrated scheduling → lower demurrage
- Multi-nodal resilience
Communities, NGOs, and Workforce Partners
Communities, NGOs and workforce partners secure social licence and shared value through joint programs and transparent dialogue, while training providers and unions build skilled, safety-focused workforces that improve productivity and reduce incidents. Partnerships expand health, education and environmental outcomes and constructive engagement lowers disruption risk and strengthens trust.
- Local engagement: social licence
- Training: skills + safety
- NGOs: health & education
- Dialogue: reduced disruption
3–5y offtakes ≤30% prepay; EPCM +10–15%
Host-country regulators secure permits across Australia, Africa and S.America, reducing renewal risk and delays. Offtake contracts (3–5y) with prepayments up to 30% stabilise cashflow. EPCM/OEM partnerships (60–70% mine capex) raise fleet availability 10–15% and cut unplanned downtime 20–40%. Logistics corridors cut demurrage risk after 2024 peaks of ~$1,200/day.
| Partnership | Key metric | 2024 stat |
|---|---|---|
| Regulators | Permit risk | Lower delays |
| Offtake | Contract length / prepay | 3–5y / ≤30% |
| EPCM/OEM | Capex share / availability | 60–70% / +10–15% |
| Logistics | Demurrage peak | $1,200/day |
What is included in the product
 Detailed Word Document
A ready-to-use MMG Business Model Canvas detailing nine BMC blocks—customer segments, value propositions, channels, customer relationships, revenue streams, key resources, key activities, key partners, and cost structure—with narratives, competitive advantages, SWOT linkage, and validation using real company data. Ideal for presentations, funding discussions, and strategic decision-making.

 Customizable Excel Spreadsheet
High-level editable one-page snapshot that saves hours of formatting, helping teams brainstorm, collaborate, and produce boardroom-ready deliverables quickly.
Activities

Exploration and Resource Definition
Geological targeting, systematic drilling and 3D modeling expand MMG's reserve base, supporting resource conversion that underpins life-of-mine plans; industry exploration spend reached about US$10.5bn in 2024. Data analytics improve discovery efficiency and risk‑adjusted returns, raising success rates and shortening appraisal cycles. Continuous pipeline renewal through brownfield and greenfield programs sustains long‑term output and cash flow visibility.
Mine Development and Operations
Planning, stripping, drilling, blasting and hauling coordinate ore delivery to mills, with MMG-style operations targeting steady feed to processing. Plants crush, grind, float and thicken concentrates to specification. Throughput optimization typically cuts unit costs 5–15% and can lift recoveries 1–3 percentage points. Robust safety and preventive maintenance programs drive >90% equipment availability and lower unplanned downtime.

Concentrate Marketing and Logistics
Contracts, pricing and QA are structured to meet buyer specs and target payability bands (typical payability ranges 80–90% for key elements in 2024), with penalties and bonuses tied to assay and moisture. Blending strategies reduce deleterious elements and maximize payable metal across streams. Shipment schedules sync with ports and carriers to minimize demurrage, while 2024 market intel—price signals and Chinese feedstock appetite—drives timing and counterparty choice.

ESG, Compliance, and Stakeholder Engagement
Permitting, monitoring and reporting at MMG ensure regulatory adherence through centralized compliance systems, continuous environmental monitoring and regular statutory reporting; community programs and grievance mechanisms are used to build acceptance and manage social risk. Decarbonization initiatives and water stewardship projects target emission and freshwater reductions, while transparency frameworks and ESG disclosures strengthen investor confidence.
- Permitting: centralized compliance systems
- Community: grievance mechanisms
- Decarbonization: emission-reduction projects
- Transparency: enhanced ESG reporting
Risk, Finance, and Portfolio Management
Hedging, insurance, and strict counterparty controls are used to mitigate commodity and market volatility—Brent averaged about $85/bbl in 2024, underscoring price risk exposure. Capital allocation balances sustaining, growth, and exploration spend against return targets and liquidity buffers. Project gating with stage-gate governance enforces NPV/hurdle thresholds to protect returns. Scenario planning informs jurisdictional and commodity exposure limits.
- Hedging: reduces price risk
- Insurance: caps tail losses
- Counterparty controls: limits credit exposure
- Capital allocation: sustain/grow/explore balance
- Gating: stage-gate NPV discipline
- Scenario planning: guides exposure
Geological targeting and 3D modelling boost reserves; ops lower unit costs, raise recoveries
Geological targeting, drilling and 3D modelling grow reserves (industry exploration ~US$10.5bn in 2024) and shorten appraisal cycles. Operations focus on steady ore delivery, throughput optimisation (unit cost -5–15%, recoveries +1–3ppt) and >90% equipment availability. Sales, blending and QA target payability 80–90%; hedging, insurance and capital gating manage price/credit risk (Brent ~US$85/bbl 2024).
| Metric | 2024 Value |
|---|---|
| Exploration spend (industry) | US$10.5bn |
| Unit cost improvement | 5–15% |
| Recovery uplift | 1–3 ppt |
| Equipment availability | >90% |
| Payability | 80–90% |
| Brent | US$85/bbl |
Full Version Awaits
Business Model Canvas
The document you're previewing is the actual MMG Business Model Canvas you'll receive—no mockups or samples. After purchase you'll get this exact file, fully formatted and editable in Word and Excel. Instant download, complete content, ready to use.

Unlock the strategic Business Model Canvas: value propositions, revenue, partners, cost structure
Unlock the full strategic blueprint behind MMG’s business model. This in-depth Business Model Canvas maps value propositions, revenue streams, key partners and cost structure to show how MMG captures market share and scales. Download the complete Word/Excel canvas for actionable insights and benchmarking.
Partnerships
Governments and Regulators
Host-country ministries, environmental authorities and permitting bodies enable MMG’s access and compliance across Australia, Africa and South America, reducing license and renewal risk. Stable regulatory relationships de-risk permitting and support predictable timelines. Collaboration with authorities underpins local employment, infrastructure and social performance. Predictable regulation reduces project delays and cost overruns.
Smelters, Refiners, and Offtake Buyers
Long-term offtake partners (typically 3–5 year contracts) secure steady demand for MMG copper and zinc concentrates and de-risk price exposure. Technical interfaces align on specifications, penalties and impurity management to protect payability and metallurgical returns. Prepayment or floor-price structures, often funding up to ~30% of concentrate value, enhance liquidity and balance-sheet flexibility. Joint planning with smelters improves shipment cadence and inventory turns.
EPCM, OEMs, and Maintenance Vendors
Engineering, procurement and construction management partners and OEMs design, build and sustain MMG’s mining and processing assets, underpinning capital projects often representing 60–70% of total mine capex in 2024. OEM alliances have been shown to improve fleet availability by 10–15% and throughput accordingly. Condition-based maintenance programs cut unplanned downtime by roughly 20–40% and lower unit costs. Shared innovation between EPCM, OEMs and maintenance vendors accelerates productivity and safety gains, often delivering single-digit to low-double-digit percent improvements.
Logistics, Port, and Shipping Providers
Rail, road and port operators secure concentrate evacuation with integrated rail-port corridors, cutting transit variability; freight forwarders optimize routes and Incoterms to lower landed cost. Integrated scheduling reduced demurrage exposure in 2024, where peak demurrage exceeded $1,200/day on some trade lanes, and multi-nodal options improved resilience during regional disruptions.
- Rail-road-port corridors
- Freight forwarders & Incoterms
- Integrated scheduling → lower demurrage
- Multi-nodal resilience
Communities, NGOs, and Workforce Partners
Communities, NGOs and workforce partners secure social licence and shared value through joint programs and transparent dialogue, while training providers and unions build skilled, safety-focused workforces that improve productivity and reduce incidents. Partnerships expand health, education and environmental outcomes and constructive engagement lowers disruption risk and strengthens trust.
- Local engagement: social licence
- Training: skills + safety
- NGOs: health & education
- Dialogue: reduced disruption
3–5y offtakes ≤30% prepay; EPCM +10–15%
Host-country regulators secure permits across Australia, Africa and S.America, reducing renewal risk and delays. Offtake contracts (3–5y) with prepayments up to 30% stabilise cashflow. EPCM/OEM partnerships (60–70% mine capex) raise fleet availability 10–15% and cut unplanned downtime 20–40%. Logistics corridors cut demurrage risk after 2024 peaks of ~$1,200/day.
| Partnership | Key metric | 2024 stat |
|---|---|---|
| Regulators | Permit risk | Lower delays |
| Offtake | Contract length / prepay | 3–5y / ≤30% |
| EPCM/OEM | Capex share / availability | 60–70% / +10–15% |
| Logistics | Demurrage peak | $1,200/day |
What is included in the product
Detailed Word Document
A ready-to-use MMG Business Model Canvas detailing nine BMC blocks—customer segments, value propositions, channels, customer relationships, revenue streams, key resources, key activities, key partners, and cost structure—with narratives, competitive advantages, SWOT linkage, and validation using real company data. Ideal for presentations, funding discussions, and strategic decision-making.
Customizable Excel Spreadsheet
High-level editable one-page snapshot that saves hours of formatting, helping teams brainstorm, collaborate, and produce boardroom-ready deliverables quickly.
Activities
Exploration and Resource Definition
Geological targeting, systematic drilling and 3D modeling expand MMG's reserve base, supporting resource conversion that underpins life-of-mine plans; industry exploration spend reached about US$10.5bn in 2024. Data analytics improve discovery efficiency and risk‑adjusted returns, raising success rates and shortening appraisal cycles. Continuous pipeline renewal through brownfield and greenfield programs sustains long‑term output and cash flow visibility.
Mine Development and Operations
Planning, stripping, drilling, blasting and hauling coordinate ore delivery to mills, with MMG-style operations targeting steady feed to processing. Plants crush, grind, float and thicken concentrates to specification. Throughput optimization typically cuts unit costs 5–15% and can lift recoveries 1–3 percentage points. Robust safety and preventive maintenance programs drive >90% equipment availability and lower unplanned downtime.
Concentrate Marketing and Logistics
Contracts, pricing and QA are structured to meet buyer specs and target payability bands (typical payability ranges 80–90% for key elements in 2024), with penalties and bonuses tied to assay and moisture. Blending strategies reduce deleterious elements and maximize payable metal across streams. Shipment schedules sync with ports and carriers to minimize demurrage, while 2024 market intel—price signals and Chinese feedstock appetite—drives timing and counterparty choice.
ESG, Compliance, and Stakeholder Engagement
Permitting, monitoring and reporting at MMG ensure regulatory adherence through centralized compliance systems, continuous environmental monitoring and regular statutory reporting; community programs and grievance mechanisms are used to build acceptance and manage social risk. Decarbonization initiatives and water stewardship projects target emission and freshwater reductions, while transparency frameworks and ESG disclosures strengthen investor confidence.
- Permitting: centralized compliance systems
- Community: grievance mechanisms
- Decarbonization: emission-reduction projects
- Transparency: enhanced ESG reporting
Risk, Finance, and Portfolio Management
Hedging, insurance, and strict counterparty controls are used to mitigate commodity and market volatility—Brent averaged about $85/bbl in 2024, underscoring price risk exposure. Capital allocation balances sustaining, growth, and exploration spend against return targets and liquidity buffers. Project gating with stage-gate governance enforces NPV/hurdle thresholds to protect returns. Scenario planning informs jurisdictional and commodity exposure limits.
- Hedging: reduces price risk
- Insurance: caps tail losses
- Counterparty controls: limits credit exposure
- Capital allocation: sustain/grow/explore balance
- Gating: stage-gate NPV discipline
- Scenario planning: guides exposure
Geological targeting and 3D modelling boost reserves; ops lower unit costs, raise recoveries
Geological targeting, drilling and 3D modelling grow reserves (industry exploration ~US$10.5bn in 2024) and shorten appraisal cycles. Operations focus on steady ore delivery, throughput optimisation (unit cost -5–15%, recoveries +1–3ppt) and >90% equipment availability. Sales, blending and QA target payability 80–90%; hedging, insurance and capital gating manage price/credit risk (Brent ~US$85/bbl 2024).
| Metric | 2024 Value |
|---|---|
| Exploration spend (industry) | US$10.5bn |
| Unit cost improvement | 5–15% |
| Recovery uplift | 1–3 ppt |
| Equipment availability | >90% |
| Payability | 80–90% |
| Brent | US$85/bbl |
Full Version Awaits
Business Model Canvas
The document you're previewing is the actual MMG Business Model Canvas you'll receive—no mockups or samples. After purchase you'll get this exact file, fully formatted and editable in Word and Excel. Instant download, complete content, ready to use.
Original: $10.00
-65%$10.00
$3.50Description
Unlock the strategic Business Model Canvas: value propositions, revenue, partners, cost structure
Unlock the full strategic blueprint behind MMG’s business model. This in-depth Business Model Canvas maps value propositions, revenue streams, key partners and cost structure to show how MMG captures market share and scales. Download the complete Word/Excel canvas for actionable insights and benchmarking.
Partnerships
Governments and Regulators
Host-country ministries, environmental authorities and permitting bodies enable MMG’s access and compliance across Australia, Africa and South America, reducing license and renewal risk. Stable regulatory relationships de-risk permitting and support predictable timelines. Collaboration with authorities underpins local employment, infrastructure and social performance. Predictable regulation reduces project delays and cost overruns.
Smelters, Refiners, and Offtake Buyers
Long-term offtake partners (typically 3–5 year contracts) secure steady demand for MMG copper and zinc concentrates and de-risk price exposure. Technical interfaces align on specifications, penalties and impurity management to protect payability and metallurgical returns. Prepayment or floor-price structures, often funding up to ~30% of concentrate value, enhance liquidity and balance-sheet flexibility. Joint planning with smelters improves shipment cadence and inventory turns.
EPCM, OEMs, and Maintenance Vendors
Engineering, procurement and construction management partners and OEMs design, build and sustain MMG’s mining and processing assets, underpinning capital projects often representing 60–70% of total mine capex in 2024. OEM alliances have been shown to improve fleet availability by 10–15% and throughput accordingly. Condition-based maintenance programs cut unplanned downtime by roughly 20–40% and lower unit costs. Shared innovation between EPCM, OEMs and maintenance vendors accelerates productivity and safety gains, often delivering single-digit to low-double-digit percent improvements.
Logistics, Port, and Shipping Providers
Rail, road and port operators secure concentrate evacuation with integrated rail-port corridors, cutting transit variability; freight forwarders optimize routes and Incoterms to lower landed cost. Integrated scheduling reduced demurrage exposure in 2024, where peak demurrage exceeded $1,200/day on some trade lanes, and multi-nodal options improved resilience during regional disruptions.
- Rail-road-port corridors
- Freight forwarders & Incoterms
- Integrated scheduling → lower demurrage
- Multi-nodal resilience
Communities, NGOs, and Workforce Partners
Communities, NGOs and workforce partners secure social licence and shared value through joint programs and transparent dialogue, while training providers and unions build skilled, safety-focused workforces that improve productivity and reduce incidents. Partnerships expand health, education and environmental outcomes and constructive engagement lowers disruption risk and strengthens trust.
- Local engagement: social licence
- Training: skills + safety
- NGOs: health & education
- Dialogue: reduced disruption
3–5y offtakes ≤30% prepay; EPCM +10–15%
Host-country regulators secure permits across Australia, Africa and S.America, reducing renewal risk and delays. Offtake contracts (3–5y) with prepayments up to 30% stabilise cashflow. EPCM/OEM partnerships (60–70% mine capex) raise fleet availability 10–15% and cut unplanned downtime 20–40%. Logistics corridors cut demurrage risk after 2024 peaks of ~$1,200/day.
| Partnership | Key metric | 2024 stat |
|---|---|---|
| Regulators | Permit risk | Lower delays |
| Offtake | Contract length / prepay | 3–5y / ≤30% |
| EPCM/OEM | Capex share / availability | 60–70% / +10–15% |
| Logistics | Demurrage peak | $1,200/day |
What is included in the product
Detailed Word Document
A ready-to-use MMG Business Model Canvas detailing nine BMC blocks—customer segments, value propositions, channels, customer relationships, revenue streams, key resources, key activities, key partners, and cost structure—with narratives, competitive advantages, SWOT linkage, and validation using real company data. Ideal for presentations, funding discussions, and strategic decision-making.
Customizable Excel Spreadsheet
High-level editable one-page snapshot that saves hours of formatting, helping teams brainstorm, collaborate, and produce boardroom-ready deliverables quickly.
Activities
Exploration and Resource Definition
Geological targeting, systematic drilling and 3D modeling expand MMG's reserve base, supporting resource conversion that underpins life-of-mine plans; industry exploration spend reached about US$10.5bn in 2024. Data analytics improve discovery efficiency and risk‑adjusted returns, raising success rates and shortening appraisal cycles. Continuous pipeline renewal through brownfield and greenfield programs sustains long‑term output and cash flow visibility.
Mine Development and Operations
Planning, stripping, drilling, blasting and hauling coordinate ore delivery to mills, with MMG-style operations targeting steady feed to processing. Plants crush, grind, float and thicken concentrates to specification. Throughput optimization typically cuts unit costs 5–15% and can lift recoveries 1–3 percentage points. Robust safety and preventive maintenance programs drive >90% equipment availability and lower unplanned downtime.
Concentrate Marketing and Logistics
Contracts, pricing and QA are structured to meet buyer specs and target payability bands (typical payability ranges 80–90% for key elements in 2024), with penalties and bonuses tied to assay and moisture. Blending strategies reduce deleterious elements and maximize payable metal across streams. Shipment schedules sync with ports and carriers to minimize demurrage, while 2024 market intel—price signals and Chinese feedstock appetite—drives timing and counterparty choice.
ESG, Compliance, and Stakeholder Engagement
Permitting, monitoring and reporting at MMG ensure regulatory adherence through centralized compliance systems, continuous environmental monitoring and regular statutory reporting; community programs and grievance mechanisms are used to build acceptance and manage social risk. Decarbonization initiatives and water stewardship projects target emission and freshwater reductions, while transparency frameworks and ESG disclosures strengthen investor confidence.
- Permitting: centralized compliance systems
- Community: grievance mechanisms
- Decarbonization: emission-reduction projects
- Transparency: enhanced ESG reporting
Risk, Finance, and Portfolio Management
Hedging, insurance, and strict counterparty controls are used to mitigate commodity and market volatility—Brent averaged about $85/bbl in 2024, underscoring price risk exposure. Capital allocation balances sustaining, growth, and exploration spend against return targets and liquidity buffers. Project gating with stage-gate governance enforces NPV/hurdle thresholds to protect returns. Scenario planning informs jurisdictional and commodity exposure limits.
- Hedging: reduces price risk
- Insurance: caps tail losses
- Counterparty controls: limits credit exposure
- Capital allocation: sustain/grow/explore balance
- Gating: stage-gate NPV discipline
- Scenario planning: guides exposure
Geological targeting and 3D modelling boost reserves; ops lower unit costs, raise recoveries
Geological targeting, drilling and 3D modelling grow reserves (industry exploration ~US$10.5bn in 2024) and shorten appraisal cycles. Operations focus on steady ore delivery, throughput optimisation (unit cost -5–15%, recoveries +1–3ppt) and >90% equipment availability. Sales, blending and QA target payability 80–90%; hedging, insurance and capital gating manage price/credit risk (Brent ~US$85/bbl 2024).
| Metric | 2024 Value |
|---|---|
| Exploration spend (industry) | US$10.5bn |
| Unit cost improvement | 5–15% |
| Recovery uplift | 1–3 ppt |
| Equipment availability | >90% |
| Payability | 80–90% |
| Brent | US$85/bbl |
Full Version Awaits
Business Model Canvas
The document you're previewing is the actual MMG Business Model Canvas you'll receive—no mockups or samples. After purchase you'll get this exact file, fully formatted and editable in Word and Excel. Instant download, complete content, ready to use.











