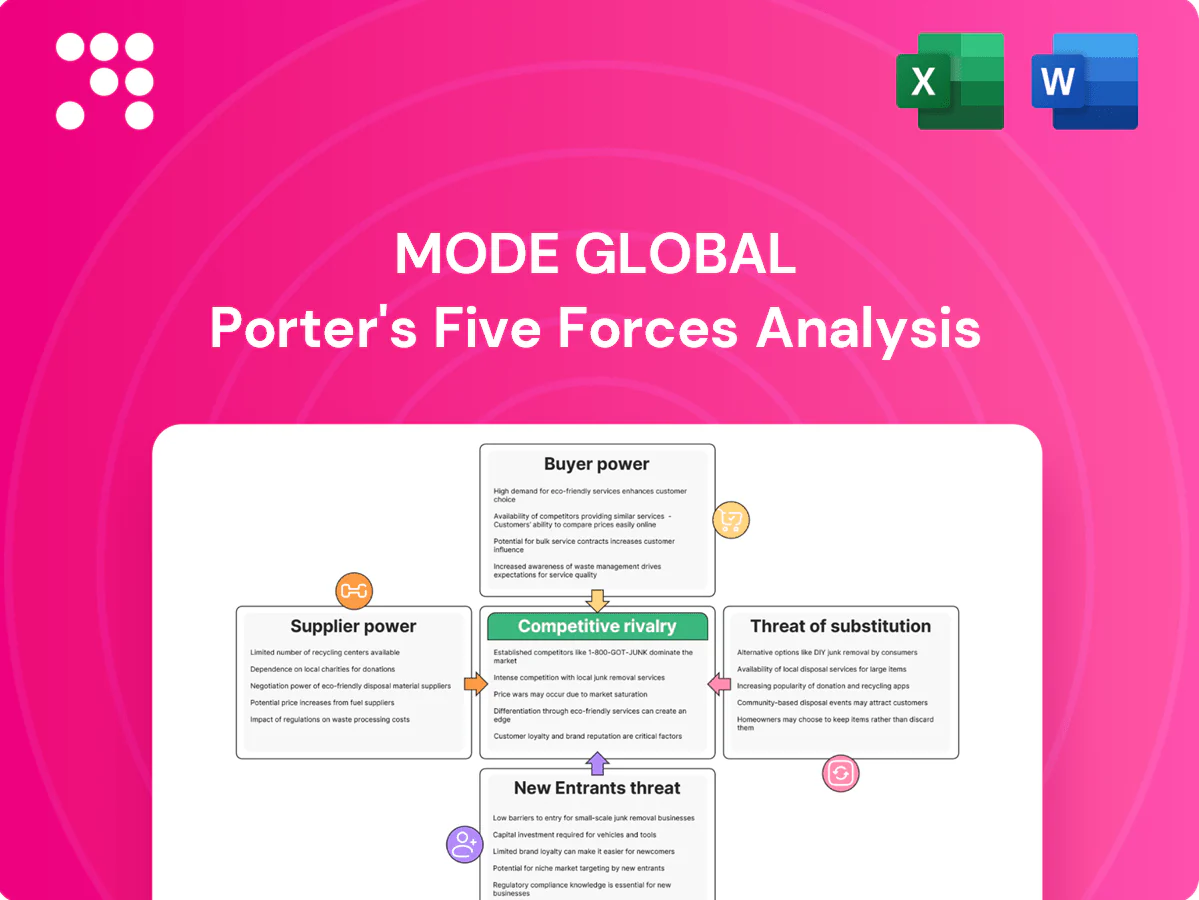
Mode Global Porter's Five Forces Analysis

Elevate Your Analysis with the Complete Porter's Five Forces Analysis
Mode Global’s Porter's Five Forces snapshot highlights competitive intensity, buyer and supplier pressures, and substitute risks that shape its strategic options; this brief glimpse is useful but incomplete. Unlock the full report for force-by-force ratings, visuals, and actionable insights to inform investment or strategy decisions. Purchase the comprehensive analysis to get consultant-grade, presentation-ready deliverables tailored to Mode Global.
Suppliers Bargaining Power

Dependence on crypto liquidity providers
Mode depends on exchanges, OTC desks and market makers for BTC liquidity and pricing, with the top five venues accounting for over 60% of spot BTC volume in 2024, concentrating supplier power. Regulated, concentrated venues can widen spreads or throttle APIs, squeezing margins. Switching providers is feasible but incurs integration costs and slippage risk. In stressed markets (liquidity drops >50% on some venues in 2024 flash events) supplier power spikes.
Banking partners and fiat on/off-ramps
Settlement banks, payment institutions and EMIs control access to fiat rails, and in 2024 continued to dictate onboarding, limits and pricing for fintechs like Mode, raising supplier leverage. De-risking or account closures remain material operational risks that can abruptly disrupt deposits and withdrawals and force costly contingency measures. Building redundancy across multiple banking partners reduces single-point dependency and outage risk. A partner's compliance posture and transaction monitoring rigor directly affect their willingness to onboard clients and the fees charged.

Card networks and payment acquirers
Visa/Mastercard interchange and scheme fees drive Mode’s payment economics, typically around 1.5–2.5% per transaction in 2024, plus acquirer fees commonly 0.1–0.5%, materially affecting margin. Scheme compliance and chargeback exposure (monitoring often starts near a ~1% chargeback rate) can trigger higher pricing or routing restrictions. Negotiating leverage rises with transaction volume and strong risk metrics, while A2A/Open Banking rails increasingly offset card dependence in key markets.

Cloud, data, and KYC/AML vendors
Cloud, analytics and KYC/AML vendors constitute critical infrastructure for Mode Global: top-three cloud providers held roughly 65% of the market in 2024 (AWS ~32%, Azure ~22%, GCP ~11%), creating data gravity and re‑certification burdens that raise migration costs and time. Vendor outages or price changes can cascade into service degradation — enterprise outages still average multi‑hour impacts with multimillion‑dollar consequences. Multi‑vendor strategies reduce single‑vendor risk but increase integration complexity and OPEX.
- Vendor concentration: top 3 ≈65% (2024)
- Migration friction: re‑certification, data gravity raise costs and time
- Outage risk: multi‑million impact per major incident
- Mitigation tradeoff: resilience vs higher integration spend
Mobile app stores and OS ecosystems
Concentrated liquidity, banking de-risking and cloud reliance increase single-point risk
Mode faces concentrated liquidity suppliers: top‑5 BTC venues >60% spot volume (2024), allowing spread and API control. Fiat rails and banks dictate onboarding/limits, with de‑risking causing abrupt outages. Card schemes (1.5–2.5% interchange) and top‑3 cloud vendors (~65% market) create recurring cost and migration friction. Diversification raises OPEX but lowers single‑point risk.
| Supplier | Key 2024 metric |
|---|---|
| Top BTC venues | Top‑5 >60% volume |
| Card fees | 1.5–2.5% + acquirer 0.1–0.5% |
| Cloud | Top‑3 ≈65% market |
What is included in the product
 Detailed Word Document
Comprehensive Porter’s Five Forces evaluation of Mode Global that uncovers competitive dynamics, buyer and supplier power, threat of substitutes, and entry barriers, highlighting disruptive risks and strategic levers to protect market share and inform investor and strategic decisions.

 Customizable Excel Spreadsheet
Mode Global's Porter's Five Forces delivers a one-sheet, customizable view that instantly clarifies competitive pressure with an interactive spider chart—perfect for fast decision-making. Clean, no-code design and seamless integration into reports or dashboards remove analysis bottlenecks and make updates effortless.
Customers Bargaining Power

Low switching costs and multi-homing
Retail users commonly hold multiple wallets and exchange accounts, lowering switching costs and enabling multi-homing; Coinbase reported 108 million verified users by end-2023, underscoring large retail mobility into 2024. Onboarding friction has fallen with KYC automation and custodial wallets, so churn is easier. Transparent spreads and fee tables make price comparison straightforward, amplifying buyer bargaining power over pricing and features.
Price sensitivity to spreads and fees
Buyers at Mode Global closely track execution quality, deposit/withdrawal fees and FX costs, with global FX turnover at about 7.5 trillion USD per day (BIS, 2022) sharpening price focus; transparent competitors offering sub-1 pip EUR/USD spreads increase switching pressure. To retain volume brokers often tighten spreads or offer fee discounts and promotions, sometimes cutting effective costs by 20–50% during campaigns. Loyalty incentives and tiered rewards can reduce price elasticity, but measurable retention gains depend on clear reward economics.

Merchant demand for reliability and total cost
Business clients prioritize uptime, fraud controls and net effective rates, often demanding 99.9% uptime service levels (≈8.76 hours downtime/year) and robust chargeback/fraud tooling. Merchants leverage volume and alternative providers to negotiate lower effective rates and fee rebates. Deep API and workflow integration creates mild lock-in by raising migration costs. Service-level guarantees plus analytics lower perceived risk and increase customer stickiness.

Preference for asset choice and utility
Customers demand asset choice beyond Bitcoin—stablecoins, fiat rails and rewards increase utility and stickiness; stablecoins surpassed $150 billion market cap in 2024, underscoring demand for dollar-linked rails. Limited asset support forces multi-homing (many users keep wallets on multiple platforms), while merchant acceptance breadth and settlement options (crypto rails vs card rails) materially affect retention. Rapid feature velocity sets buyer expectations and raises switching leverage when competitors ship faster.
- stablecoins: >$150B (2024)
- multi-homing: widespread across exchanges/wallets
- payments: merchant acceptance and settlement speed drive retention
- feature velocity: faster releases increase customer leverage
Cyclical crypto demand and volatility
Cyclical crypto demand and volatility amplify customer bargaining power: bull markets (post-Bitcoin halving in April 2024) drive acquisition and fees, while bear phases intensify price pressure as users cut trading and shift to low-cost custody. Falling volumes raise negotiation leverage for fees and spreads; education and utility-focused use-cases can reduce sensitivity to cycles.
- Higher leverage when volumes drop
- Post-halving acquisition spikes
- Education/utility smooths demand swings
Thin fees, multi-homing squeeze margins as >$150B stablecoins grow
Customers exert high bargaining power: multi-homing lowers switching costs (Coinbase 108M users end-2023), transparent fees/spreads (sub-1 pip competitors) and promo discounts (20–50%) force price pressure. Business clients demand 99.9% uptime and low FX/fee drag (FX turnover ~$7.5T/day). Stablecoins >$150B (2024) raise expectations for rails and asset breadth.
| Metric | Value |
|---|---|
| Retail users | 108M (2023) |
| Stablecoins | >$150B (2024) |
| FX turnover | $7.5T/day (BIS 2022) |
Same Document Delivered
Mode Global Porter's Five Forces Analysis
This preview shows the exact Mode Global Porter's Five Forces analysis you'll receive immediately after purchase—no placeholders or edits. The document is fully formatted and ready for download and use the moment you buy. You're previewing the final deliverable.

Elevate Your Analysis with the Complete Porter's Five Forces Analysis
Mode Global’s Porter's Five Forces snapshot highlights competitive intensity, buyer and supplier pressures, and substitute risks that shape its strategic options; this brief glimpse is useful but incomplete. Unlock the full report for force-by-force ratings, visuals, and actionable insights to inform investment or strategy decisions. Purchase the comprehensive analysis to get consultant-grade, presentation-ready deliverables tailored to Mode Global.
Suppliers Bargaining Power
Dependence on crypto liquidity providers
Mode depends on exchanges, OTC desks and market makers for BTC liquidity and pricing, with the top five venues accounting for over 60% of spot BTC volume in 2024, concentrating supplier power. Regulated, concentrated venues can widen spreads or throttle APIs, squeezing margins. Switching providers is feasible but incurs integration costs and slippage risk. In stressed markets (liquidity drops >50% on some venues in 2024 flash events) supplier power spikes.
Banking partners and fiat on/off-ramps
Settlement banks, payment institutions and EMIs control access to fiat rails, and in 2024 continued to dictate onboarding, limits and pricing for fintechs like Mode, raising supplier leverage. De-risking or account closures remain material operational risks that can abruptly disrupt deposits and withdrawals and force costly contingency measures. Building redundancy across multiple banking partners reduces single-point dependency and outage risk. A partner's compliance posture and transaction monitoring rigor directly affect their willingness to onboard clients and the fees charged.
Card networks and payment acquirers
Visa/Mastercard interchange and scheme fees drive Mode’s payment economics, typically around 1.5–2.5% per transaction in 2024, plus acquirer fees commonly 0.1–0.5%, materially affecting margin. Scheme compliance and chargeback exposure (monitoring often starts near a ~1% chargeback rate) can trigger higher pricing or routing restrictions. Negotiating leverage rises with transaction volume and strong risk metrics, while A2A/Open Banking rails increasingly offset card dependence in key markets.
Cloud, data, and KYC/AML vendors
Cloud, analytics and KYC/AML vendors constitute critical infrastructure for Mode Global: top-three cloud providers held roughly 65% of the market in 2024 (AWS ~32%, Azure ~22%, GCP ~11%), creating data gravity and re‑certification burdens that raise migration costs and time. Vendor outages or price changes can cascade into service degradation — enterprise outages still average multi‑hour impacts with multimillion‑dollar consequences. Multi‑vendor strategies reduce single‑vendor risk but increase integration complexity and OPEX.
- Vendor concentration: top 3 ≈65% (2024)
- Migration friction: re‑certification, data gravity raise costs and time
- Outage risk: multi‑million impact per major incident
- Mitigation tradeoff: resilience vs higher integration spend
Mobile app stores and OS ecosystems
Concentrated liquidity, banking de-risking and cloud reliance increase single-point risk
Mode faces concentrated liquidity suppliers: top‑5 BTC venues >60% spot volume (2024), allowing spread and API control. Fiat rails and banks dictate onboarding/limits, with de‑risking causing abrupt outages. Card schemes (1.5–2.5% interchange) and top‑3 cloud vendors (~65% market) create recurring cost and migration friction. Diversification raises OPEX but lowers single‑point risk.
| Supplier | Key 2024 metric |
|---|---|
| Top BTC venues | Top‑5 >60% volume |
| Card fees | 1.5–2.5% + acquirer 0.1–0.5% |
| Cloud | Top‑3 ≈65% market |
What is included in the product
Detailed Word Document
Comprehensive Porter’s Five Forces evaluation of Mode Global that uncovers competitive dynamics, buyer and supplier power, threat of substitutes, and entry barriers, highlighting disruptive risks and strategic levers to protect market share and inform investor and strategic decisions.
Customizable Excel Spreadsheet
Mode Global's Porter's Five Forces delivers a one-sheet, customizable view that instantly clarifies competitive pressure with an interactive spider chart—perfect for fast decision-making. Clean, no-code design and seamless integration into reports or dashboards remove analysis bottlenecks and make updates effortless.
Customers Bargaining Power
Low switching costs and multi-homing
Retail users commonly hold multiple wallets and exchange accounts, lowering switching costs and enabling multi-homing; Coinbase reported 108 million verified users by end-2023, underscoring large retail mobility into 2024. Onboarding friction has fallen with KYC automation and custodial wallets, so churn is easier. Transparent spreads and fee tables make price comparison straightforward, amplifying buyer bargaining power over pricing and features.
Price sensitivity to spreads and fees
Buyers at Mode Global closely track execution quality, deposit/withdrawal fees and FX costs, with global FX turnover at about 7.5 trillion USD per day (BIS, 2022) sharpening price focus; transparent competitors offering sub-1 pip EUR/USD spreads increase switching pressure. To retain volume brokers often tighten spreads or offer fee discounts and promotions, sometimes cutting effective costs by 20–50% during campaigns. Loyalty incentives and tiered rewards can reduce price elasticity, but measurable retention gains depend on clear reward economics.
Merchant demand for reliability and total cost
Business clients prioritize uptime, fraud controls and net effective rates, often demanding 99.9% uptime service levels (≈8.76 hours downtime/year) and robust chargeback/fraud tooling. Merchants leverage volume and alternative providers to negotiate lower effective rates and fee rebates. Deep API and workflow integration creates mild lock-in by raising migration costs. Service-level guarantees plus analytics lower perceived risk and increase customer stickiness.
Preference for asset choice and utility
Customers demand asset choice beyond Bitcoin—stablecoins, fiat rails and rewards increase utility and stickiness; stablecoins surpassed $150 billion market cap in 2024, underscoring demand for dollar-linked rails. Limited asset support forces multi-homing (many users keep wallets on multiple platforms), while merchant acceptance breadth and settlement options (crypto rails vs card rails) materially affect retention. Rapid feature velocity sets buyer expectations and raises switching leverage when competitors ship faster.
- stablecoins: >$150B (2024)
- multi-homing: widespread across exchanges/wallets
- payments: merchant acceptance and settlement speed drive retention
- feature velocity: faster releases increase customer leverage
Cyclical crypto demand and volatility
Cyclical crypto demand and volatility amplify customer bargaining power: bull markets (post-Bitcoin halving in April 2024) drive acquisition and fees, while bear phases intensify price pressure as users cut trading and shift to low-cost custody. Falling volumes raise negotiation leverage for fees and spreads; education and utility-focused use-cases can reduce sensitivity to cycles.
- Higher leverage when volumes drop
- Post-halving acquisition spikes
- Education/utility smooths demand swings
Thin fees, multi-homing squeeze margins as >$150B stablecoins grow
Customers exert high bargaining power: multi-homing lowers switching costs (Coinbase 108M users end-2023), transparent fees/spreads (sub-1 pip competitors) and promo discounts (20–50%) force price pressure. Business clients demand 99.9% uptime and low FX/fee drag (FX turnover ~$7.5T/day). Stablecoins >$150B (2024) raise expectations for rails and asset breadth.
| Metric | Value |
|---|---|
| Retail users | 108M (2023) |
| Stablecoins | >$150B (2024) |
| FX turnover | $7.5T/day (BIS 2022) |
Same Document Delivered
Mode Global Porter's Five Forces Analysis
This preview shows the exact Mode Global Porter's Five Forces analysis you'll receive immediately after purchase—no placeholders or edits. The document is fully formatted and ready for download and use the moment you buy. You're previewing the final deliverable.
Original: $10.00
-65%$10.00
$3.50Description
Elevate Your Analysis with the Complete Porter's Five Forces Analysis
Mode Global’s Porter's Five Forces snapshot highlights competitive intensity, buyer and supplier pressures, and substitute risks that shape its strategic options; this brief glimpse is useful but incomplete. Unlock the full report for force-by-force ratings, visuals, and actionable insights to inform investment or strategy decisions. Purchase the comprehensive analysis to get consultant-grade, presentation-ready deliverables tailored to Mode Global.
Suppliers Bargaining Power
Dependence on crypto liquidity providers
Mode depends on exchanges, OTC desks and market makers for BTC liquidity and pricing, with the top five venues accounting for over 60% of spot BTC volume in 2024, concentrating supplier power. Regulated, concentrated venues can widen spreads or throttle APIs, squeezing margins. Switching providers is feasible but incurs integration costs and slippage risk. In stressed markets (liquidity drops >50% on some venues in 2024 flash events) supplier power spikes.
Banking partners and fiat on/off-ramps
Settlement banks, payment institutions and EMIs control access to fiat rails, and in 2024 continued to dictate onboarding, limits and pricing for fintechs like Mode, raising supplier leverage. De-risking or account closures remain material operational risks that can abruptly disrupt deposits and withdrawals and force costly contingency measures. Building redundancy across multiple banking partners reduces single-point dependency and outage risk. A partner's compliance posture and transaction monitoring rigor directly affect their willingness to onboard clients and the fees charged.
Card networks and payment acquirers
Visa/Mastercard interchange and scheme fees drive Mode’s payment economics, typically around 1.5–2.5% per transaction in 2024, plus acquirer fees commonly 0.1–0.5%, materially affecting margin. Scheme compliance and chargeback exposure (monitoring often starts near a ~1% chargeback rate) can trigger higher pricing or routing restrictions. Negotiating leverage rises with transaction volume and strong risk metrics, while A2A/Open Banking rails increasingly offset card dependence in key markets.
Cloud, data, and KYC/AML vendors
Cloud, analytics and KYC/AML vendors constitute critical infrastructure for Mode Global: top-three cloud providers held roughly 65% of the market in 2024 (AWS ~32%, Azure ~22%, GCP ~11%), creating data gravity and re‑certification burdens that raise migration costs and time. Vendor outages or price changes can cascade into service degradation — enterprise outages still average multi‑hour impacts with multimillion‑dollar consequences. Multi‑vendor strategies reduce single‑vendor risk but increase integration complexity and OPEX.
- Vendor concentration: top 3 ≈65% (2024)
- Migration friction: re‑certification, data gravity raise costs and time
- Outage risk: multi‑million impact per major incident
- Mitigation tradeoff: resilience vs higher integration spend
Mobile app stores and OS ecosystems
Concentrated liquidity, banking de-risking and cloud reliance increase single-point risk
Mode faces concentrated liquidity suppliers: top‑5 BTC venues >60% spot volume (2024), allowing spread and API control. Fiat rails and banks dictate onboarding/limits, with de‑risking causing abrupt outages. Card schemes (1.5–2.5% interchange) and top‑3 cloud vendors (~65% market) create recurring cost and migration friction. Diversification raises OPEX but lowers single‑point risk.
| Supplier | Key 2024 metric |
|---|---|
| Top BTC venues | Top‑5 >60% volume |
| Card fees | 1.5–2.5% + acquirer 0.1–0.5% |
| Cloud | Top‑3 ≈65% market |
What is included in the product
Detailed Word Document
Comprehensive Porter’s Five Forces evaluation of Mode Global that uncovers competitive dynamics, buyer and supplier power, threat of substitutes, and entry barriers, highlighting disruptive risks and strategic levers to protect market share and inform investor and strategic decisions.
Customizable Excel Spreadsheet
Mode Global's Porter's Five Forces delivers a one-sheet, customizable view that instantly clarifies competitive pressure with an interactive spider chart—perfect for fast decision-making. Clean, no-code design and seamless integration into reports or dashboards remove analysis bottlenecks and make updates effortless.
Customers Bargaining Power
Low switching costs and multi-homing
Retail users commonly hold multiple wallets and exchange accounts, lowering switching costs and enabling multi-homing; Coinbase reported 108 million verified users by end-2023, underscoring large retail mobility into 2024. Onboarding friction has fallen with KYC automation and custodial wallets, so churn is easier. Transparent spreads and fee tables make price comparison straightforward, amplifying buyer bargaining power over pricing and features.
Price sensitivity to spreads and fees
Buyers at Mode Global closely track execution quality, deposit/withdrawal fees and FX costs, with global FX turnover at about 7.5 trillion USD per day (BIS, 2022) sharpening price focus; transparent competitors offering sub-1 pip EUR/USD spreads increase switching pressure. To retain volume brokers often tighten spreads or offer fee discounts and promotions, sometimes cutting effective costs by 20–50% during campaigns. Loyalty incentives and tiered rewards can reduce price elasticity, but measurable retention gains depend on clear reward economics.
Merchant demand for reliability and total cost
Business clients prioritize uptime, fraud controls and net effective rates, often demanding 99.9% uptime service levels (≈8.76 hours downtime/year) and robust chargeback/fraud tooling. Merchants leverage volume and alternative providers to negotiate lower effective rates and fee rebates. Deep API and workflow integration creates mild lock-in by raising migration costs. Service-level guarantees plus analytics lower perceived risk and increase customer stickiness.
Preference for asset choice and utility
Customers demand asset choice beyond Bitcoin—stablecoins, fiat rails and rewards increase utility and stickiness; stablecoins surpassed $150 billion market cap in 2024, underscoring demand for dollar-linked rails. Limited asset support forces multi-homing (many users keep wallets on multiple platforms), while merchant acceptance breadth and settlement options (crypto rails vs card rails) materially affect retention. Rapid feature velocity sets buyer expectations and raises switching leverage when competitors ship faster.
- stablecoins: >$150B (2024)
- multi-homing: widespread across exchanges/wallets
- payments: merchant acceptance and settlement speed drive retention
- feature velocity: faster releases increase customer leverage
Cyclical crypto demand and volatility
Cyclical crypto demand and volatility amplify customer bargaining power: bull markets (post-Bitcoin halving in April 2024) drive acquisition and fees, while bear phases intensify price pressure as users cut trading and shift to low-cost custody. Falling volumes raise negotiation leverage for fees and spreads; education and utility-focused use-cases can reduce sensitivity to cycles.
- Higher leverage when volumes drop
- Post-halving acquisition spikes
- Education/utility smooths demand swings
Thin fees, multi-homing squeeze margins as >$150B stablecoins grow
Customers exert high bargaining power: multi-homing lowers switching costs (Coinbase 108M users end-2023), transparent fees/spreads (sub-1 pip competitors) and promo discounts (20–50%) force price pressure. Business clients demand 99.9% uptime and low FX/fee drag (FX turnover ~$7.5T/day). Stablecoins >$150B (2024) raise expectations for rails and asset breadth.
| Metric | Value |
|---|---|
| Retail users | 108M (2023) |
| Stablecoins | >$150B (2024) |
| FX turnover | $7.5T/day (BIS 2022) |
Same Document Delivered
Mode Global Porter's Five Forces Analysis
This preview shows the exact Mode Global Porter's Five Forces analysis you'll receive immediately after purchase—no placeholders or edits. The document is fully formatted and ready for download and use the moment you buy. You're previewing the final deliverable.











