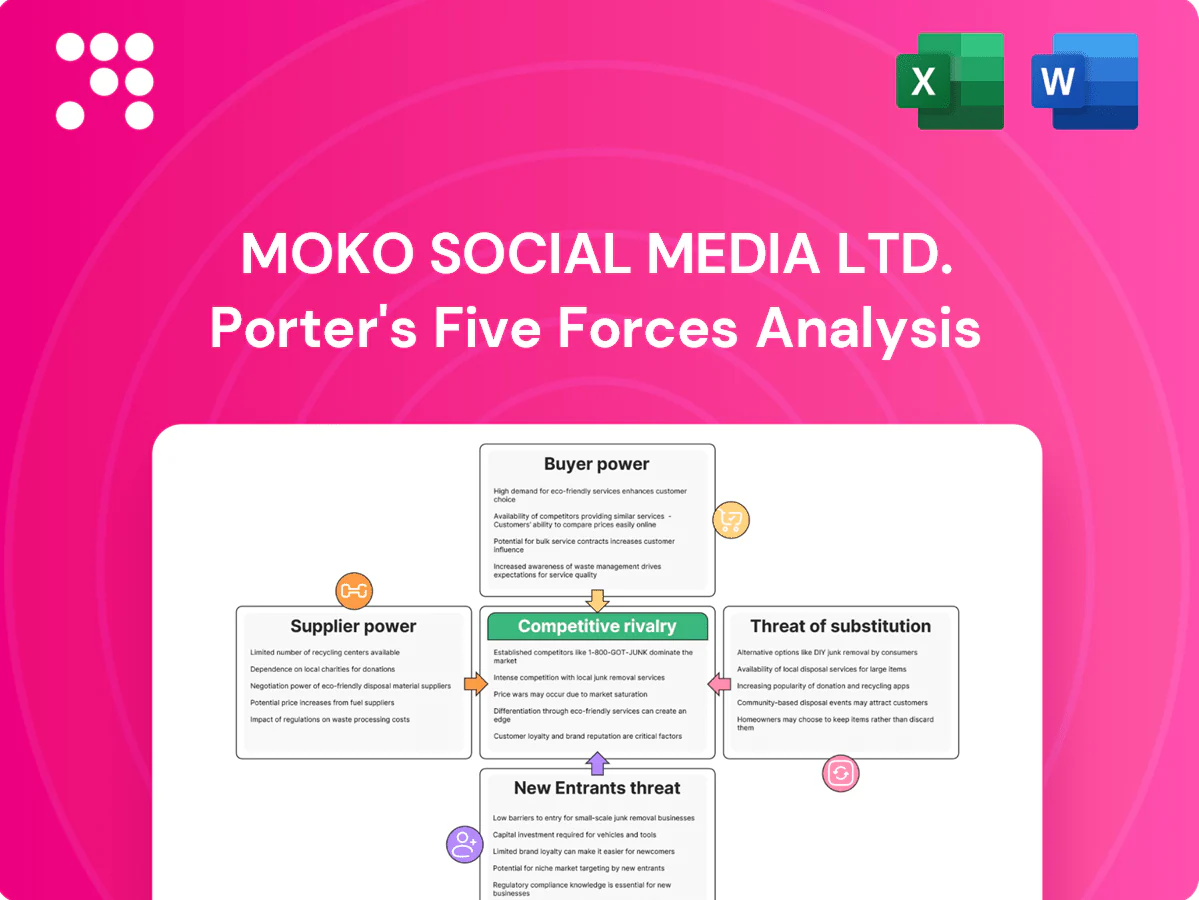
Moko Social Media Ltd. Porter's Five Forces Analysis

From Overview to Strategy Blueprint
Moko Social Media Ltd. faces intense rivalry from established platforms, rising substitute threats, and concentrated buyer expectations that squeeze margins, while supplier and entrant pressures vary by tech and regulation. This brief snapshot only scratches the surface—unlock the full Porter's Five Forces Analysis to explore competitive dynamics, market pressures, and strategic advantages in detail.
Suppliers Bargaining Power

App store gatekeepers
Apple and Google dominate distribution, fees and policy compliance—Apple’s Small Business Program cuts fees to 15% for developers earning under $1M, otherwise 15–30%, while Google similarly applies a 15% rate on the first $1M and up to 30% beyond.
Policy or ranking changes (post-2024 platform rule shifts) can materially raise acquisition costs; smaller platforms have limited negotiation leverage.
Diversifying to web/PWA lowers gatekeeper exposure but does not eliminate discoverability and payment frictions.
Cloud and CDN vendors
Cloud and CDN vendors wield pricing power—AWS ~32%, Microsoft Azure ~24%, Google Cloud ~11% of global cloud market in 2024—so hosting, storage and egress fees materially affect margins at scale. Switching entails migration risk and downtime for large platforms. Volume discounts require significant spend, while multi-cloud/CDN strategies can temper single-vendor leverage.

Ad tech intermediaries
Ad tech intermediaries — SSPs, DSPs and measurement partners — exert strong supplier power over Moko Social Media Ltd by directly influencing fill rates and CPMs; programmatic bought ~85% of US display in 2024, concentrating leverage. Policy or algorithm shifts and identifier deprecations have driven CPM volatility up to ~30% and yield compression. Dependency on third-party IDs and SSP/DSP take-rates (roughly 10–20%) heighten vulnerability, while building direct-sold inventory can boost net yields by ~10–25%.

Content creators and niche partners
High-signal creators attract and retain communities, and in 2024 the creator economy was estimated at about $250bn, concentrating bargaining power among top talent; leading creators commonly negotiate revenue shares and premium promotional placement. Concentration in a few niches raises exposure risk for platforms, while long-term contracts and proprietary creator tools (analytics, monetization) align incentives and reduce churn.
- Top creators: negotiate revenue share and placement
- Niche concentration: increases platform exposure
- 2024 creator economy: ~$250bn
- Mitigants: long-term contracts, creator tools
Data and analytics providers
Attribution, insights, and compliance tooling are critical for Moko Social Media Ltd; disruptions like the 2023 Twitter API pricing shift showed how supplier moves can halt features and raise costs. Vendor lock-in increases with deeper integrations, raising switching complexity and operational risk. Investing in in-house analytics reduces long-run supplier power and recurring API spend.
- Gartner 2024: 63% of orgs increased data platform budgets
- 2023 Twitter API changes: industry-wide disruption example
- In-house analytics lowers vendor dependency
Platform fees (15–30%), cloud & creator power squeeze margins
Supplier power is high: Apple/Google take 15–30% on app revenue, AWS/Azure/GCP hold ~32%/24%/11% cloud share, programmatic bought ~85% of US display and creator economy ≈$250bn (2024), driving fee, pricing and access leverage over Moko.
CPM volatility up to ~30% and API/platform rule shifts raise acquisition and operating costs.
Mitigants: web/PWA, multi-cloud, direct-sold inventory, long-term creator deals and in-house analytics.
| Supplier | 2024 metric | Impact |
|---|---|---|
| App stores | 15–30% fee | Revenue drag |
| Cloud | AWS 32%/Azure 24%/GCP 11% | Cost concentration |
| Ad tech | Programmatic ~85% | Yield control |
| Creators | $250bn | Bargaining power |
What is included in the product
 Detailed Word Document
Tailored Porter’s Five Forces analysis for Moko Social Media Ltd. uncovering competition drivers, buyer/supplier power, substitutes and entry barriers, identifying disruptive threats and strategic levers to protect market share.

 Customizable Excel Spreadsheet
A clear, one-sheet Porter's Five Forces summary for Moko Social Media Ltd—perfect for quick strategic decisions and investor briefings; customize pressure levels as market trends evolve to pinpoint competitive pain points.
Customers Bargaining Power

Users have zero switching costs
Consumers can move among apps instantly, giving users zero switching costs and eroding pricing power for premium features as free alternatives proliferate; Day-30 retention for social apps averaged about 5% in 2024. Retention for Moko Social hinges on network effects and exclusive content—platforms with 100M+ MAU see materially higher engagement. Advanced personalization can raise perceived switching costs and lift willingness to pay.
Advertisers are price sensitive
Advertisers benchmark CPM and CPC across platforms, forcing Moko Social Media to match cross-channel rates; in 2024 roughly 25% of ad budgets were reallocated toward higher-ROI channels within six months, increasing pricing pressure. Brands shift spend quickly when direct performance evidence is lacking, so sustained rates require clear attribution and measured lift. Vertical packages that deliver category-specific KPIs can justify premiums and reduce churn.

Data-driven enterprise clients
Data-driven enterprise clients demand high accuracy, strict privacy controls and SLA compliance—2024 surveys show ~68% rank SLA guarantees as a deal-breaker; they push for 10–25% price concessions and expanded integration scope during contracting. Proof of incrementality is critical for renewals, with clients citing performance lift as the primary retention metric. Robust case studies and developer-friendly APIs increase stickiness and reduce churn.

Niche community expectations
Communities demand tailored features and active moderation; mismatches drive swift churn and public backlash that can harm growth. Intense public feedback loops amplify defections, but professional community managers and clear governance frameworks significantly reduce churn risk.
- Tailored features required
- Public feedback accelerates churn
- Governance cuts defection risk
Premium subscribers are selective
Premium subscribers are highly selective: in 2024 top platforms capture roughly 70% of user attention, so Moko faces direct feature comparisons; trial-to-paid conversion for consumer apps averages 2–5% in 2024, making conversions fragile without clear, measurable value. Annual plans demand trust and consistent updates—SaaS annual retention averages ~80%—while bundles and exclusive content can raise willingness to pay (surveys ~45–50%).
- compare-features: top-5 hold ~70% attention
- conversion-risk: trial-to-paid 2–5% (2024)
- annual-trust: SaaS retention ~80%
- pay-premium: exclusive content lifts willingness to pay ~45–50%
Day-30 ~5%, Ads ~25%, Trials 2–5%
Consumers face near-zero switching costs; day-30 retention for social apps averaged ~5% in 2024, forcing reliance on network effects and exclusive content. Advertisers reallocated ~25% of budgets within six months in 2024, pressuring CPM/CPC; trial-to-paid conversion ran ~2–5%. Enterprise buyers cite SLAs as deal-breakers (~68% in 2024), raising negotiation leverage.
| Metric | 2024 Value | Impact |
|---|---|---|
| Day-30 retention | ~5% | Low stickiness |
| Ad reallocation | ~25% | Pricing pressure |
| Trial-to-paid | 2–5% | Fragile conversions |
| SLA importance | ~68% | Negotiation leverage |
| Top-5 attention | ~70% | Competitive concentration |
What You See Is What You Get
Moko Social Media Ltd. Porter's Five Forces Analysis
This preview shows the exact Moko Social Media Ltd. Porter's Five Forces Analysis you'll receive immediately after purchase—no placeholders or mockups. The document displayed here is the fully formatted, ready-to-use analysis covering competitive rivalry, supplier and buyer power, and threats of entry and substitutes. Once you buy, you'll get instant access to this identical file.

From Overview to Strategy Blueprint
Moko Social Media Ltd. faces intense rivalry from established platforms, rising substitute threats, and concentrated buyer expectations that squeeze margins, while supplier and entrant pressures vary by tech and regulation. This brief snapshot only scratches the surface—unlock the full Porter's Five Forces Analysis to explore competitive dynamics, market pressures, and strategic advantages in detail.
Suppliers Bargaining Power
App store gatekeepers
Apple and Google dominate distribution, fees and policy compliance—Apple’s Small Business Program cuts fees to 15% for developers earning under $1M, otherwise 15–30%, while Google similarly applies a 15% rate on the first $1M and up to 30% beyond.
Policy or ranking changes (post-2024 platform rule shifts) can materially raise acquisition costs; smaller platforms have limited negotiation leverage.
Diversifying to web/PWA lowers gatekeeper exposure but does not eliminate discoverability and payment frictions.
Cloud and CDN vendors
Cloud and CDN vendors wield pricing power—AWS ~32%, Microsoft Azure ~24%, Google Cloud ~11% of global cloud market in 2024—so hosting, storage and egress fees materially affect margins at scale. Switching entails migration risk and downtime for large platforms. Volume discounts require significant spend, while multi-cloud/CDN strategies can temper single-vendor leverage.
Ad tech intermediaries
Ad tech intermediaries — SSPs, DSPs and measurement partners — exert strong supplier power over Moko Social Media Ltd by directly influencing fill rates and CPMs; programmatic bought ~85% of US display in 2024, concentrating leverage. Policy or algorithm shifts and identifier deprecations have driven CPM volatility up to ~30% and yield compression. Dependency on third-party IDs and SSP/DSP take-rates (roughly 10–20%) heighten vulnerability, while building direct-sold inventory can boost net yields by ~10–25%.
Content creators and niche partners
High-signal creators attract and retain communities, and in 2024 the creator economy was estimated at about $250bn, concentrating bargaining power among top talent; leading creators commonly negotiate revenue shares and premium promotional placement. Concentration in a few niches raises exposure risk for platforms, while long-term contracts and proprietary creator tools (analytics, monetization) align incentives and reduce churn.
- Top creators: negotiate revenue share and placement
- Niche concentration: increases platform exposure
- 2024 creator economy: ~$250bn
- Mitigants: long-term contracts, creator tools
Data and analytics providers
Attribution, insights, and compliance tooling are critical for Moko Social Media Ltd; disruptions like the 2023 Twitter API pricing shift showed how supplier moves can halt features and raise costs. Vendor lock-in increases with deeper integrations, raising switching complexity and operational risk. Investing in in-house analytics reduces long-run supplier power and recurring API spend.
- Gartner 2024: 63% of orgs increased data platform budgets
- 2023 Twitter API changes: industry-wide disruption example
- In-house analytics lowers vendor dependency
Platform fees (15–30%), cloud & creator power squeeze margins
Supplier power is high: Apple/Google take 15–30% on app revenue, AWS/Azure/GCP hold ~32%/24%/11% cloud share, programmatic bought ~85% of US display and creator economy ≈$250bn (2024), driving fee, pricing and access leverage over Moko.
CPM volatility up to ~30% and API/platform rule shifts raise acquisition and operating costs.
Mitigants: web/PWA, multi-cloud, direct-sold inventory, long-term creator deals and in-house analytics.
| Supplier | 2024 metric | Impact |
|---|---|---|
| App stores | 15–30% fee | Revenue drag |
| Cloud | AWS 32%/Azure 24%/GCP 11% | Cost concentration |
| Ad tech | Programmatic ~85% | Yield control |
| Creators | $250bn | Bargaining power |
What is included in the product
Detailed Word Document
Tailored Porter’s Five Forces analysis for Moko Social Media Ltd. uncovering competition drivers, buyer/supplier power, substitutes and entry barriers, identifying disruptive threats and strategic levers to protect market share.
Customizable Excel Spreadsheet
A clear, one-sheet Porter's Five Forces summary for Moko Social Media Ltd—perfect for quick strategic decisions and investor briefings; customize pressure levels as market trends evolve to pinpoint competitive pain points.
Customers Bargaining Power
Users have zero switching costs
Consumers can move among apps instantly, giving users zero switching costs and eroding pricing power for premium features as free alternatives proliferate; Day-30 retention for social apps averaged about 5% in 2024. Retention for Moko Social hinges on network effects and exclusive content—platforms with 100M+ MAU see materially higher engagement. Advanced personalization can raise perceived switching costs and lift willingness to pay.
Advertisers are price sensitive
Advertisers benchmark CPM and CPC across platforms, forcing Moko Social Media to match cross-channel rates; in 2024 roughly 25% of ad budgets were reallocated toward higher-ROI channels within six months, increasing pricing pressure. Brands shift spend quickly when direct performance evidence is lacking, so sustained rates require clear attribution and measured lift. Vertical packages that deliver category-specific KPIs can justify premiums and reduce churn.
Data-driven enterprise clients
Data-driven enterprise clients demand high accuracy, strict privacy controls and SLA compliance—2024 surveys show ~68% rank SLA guarantees as a deal-breaker; they push for 10–25% price concessions and expanded integration scope during contracting. Proof of incrementality is critical for renewals, with clients citing performance lift as the primary retention metric. Robust case studies and developer-friendly APIs increase stickiness and reduce churn.
Niche community expectations
Communities demand tailored features and active moderation; mismatches drive swift churn and public backlash that can harm growth. Intense public feedback loops amplify defections, but professional community managers and clear governance frameworks significantly reduce churn risk.
- Tailored features required
- Public feedback accelerates churn
- Governance cuts defection risk
Premium subscribers are selective
Premium subscribers are highly selective: in 2024 top platforms capture roughly 70% of user attention, so Moko faces direct feature comparisons; trial-to-paid conversion for consumer apps averages 2–5% in 2024, making conversions fragile without clear, measurable value. Annual plans demand trust and consistent updates—SaaS annual retention averages ~80%—while bundles and exclusive content can raise willingness to pay (surveys ~45–50%).
- compare-features: top-5 hold ~70% attention
- conversion-risk: trial-to-paid 2–5% (2024)
- annual-trust: SaaS retention ~80%
- pay-premium: exclusive content lifts willingness to pay ~45–50%
Day-30 ~5%, Ads ~25%, Trials 2–5%
Consumers face near-zero switching costs; day-30 retention for social apps averaged ~5% in 2024, forcing reliance on network effects and exclusive content. Advertisers reallocated ~25% of budgets within six months in 2024, pressuring CPM/CPC; trial-to-paid conversion ran ~2–5%. Enterprise buyers cite SLAs as deal-breakers (~68% in 2024), raising negotiation leverage.
| Metric | 2024 Value | Impact |
|---|---|---|
| Day-30 retention | ~5% | Low stickiness |
| Ad reallocation | ~25% | Pricing pressure |
| Trial-to-paid | 2–5% | Fragile conversions |
| SLA importance | ~68% | Negotiation leverage |
| Top-5 attention | ~70% | Competitive concentration |
What You See Is What You Get
Moko Social Media Ltd. Porter's Five Forces Analysis
This preview shows the exact Moko Social Media Ltd. Porter's Five Forces Analysis you'll receive immediately after purchase—no placeholders or mockups. The document displayed here is the fully formatted, ready-to-use analysis covering competitive rivalry, supplier and buyer power, and threats of entry and substitutes. Once you buy, you'll get instant access to this identical file.
Original: $10.00
-65%$10.00
$3.50Description
From Overview to Strategy Blueprint
Moko Social Media Ltd. faces intense rivalry from established platforms, rising substitute threats, and concentrated buyer expectations that squeeze margins, while supplier and entrant pressures vary by tech and regulation. This brief snapshot only scratches the surface—unlock the full Porter's Five Forces Analysis to explore competitive dynamics, market pressures, and strategic advantages in detail.
Suppliers Bargaining Power
App store gatekeepers
Apple and Google dominate distribution, fees and policy compliance—Apple’s Small Business Program cuts fees to 15% for developers earning under $1M, otherwise 15–30%, while Google similarly applies a 15% rate on the first $1M and up to 30% beyond.
Policy or ranking changes (post-2024 platform rule shifts) can materially raise acquisition costs; smaller platforms have limited negotiation leverage.
Diversifying to web/PWA lowers gatekeeper exposure but does not eliminate discoverability and payment frictions.
Cloud and CDN vendors
Cloud and CDN vendors wield pricing power—AWS ~32%, Microsoft Azure ~24%, Google Cloud ~11% of global cloud market in 2024—so hosting, storage and egress fees materially affect margins at scale. Switching entails migration risk and downtime for large platforms. Volume discounts require significant spend, while multi-cloud/CDN strategies can temper single-vendor leverage.
Ad tech intermediaries
Ad tech intermediaries — SSPs, DSPs and measurement partners — exert strong supplier power over Moko Social Media Ltd by directly influencing fill rates and CPMs; programmatic bought ~85% of US display in 2024, concentrating leverage. Policy or algorithm shifts and identifier deprecations have driven CPM volatility up to ~30% and yield compression. Dependency on third-party IDs and SSP/DSP take-rates (roughly 10–20%) heighten vulnerability, while building direct-sold inventory can boost net yields by ~10–25%.
Content creators and niche partners
High-signal creators attract and retain communities, and in 2024 the creator economy was estimated at about $250bn, concentrating bargaining power among top talent; leading creators commonly negotiate revenue shares and premium promotional placement. Concentration in a few niches raises exposure risk for platforms, while long-term contracts and proprietary creator tools (analytics, monetization) align incentives and reduce churn.
- Top creators: negotiate revenue share and placement
- Niche concentration: increases platform exposure
- 2024 creator economy: ~$250bn
- Mitigants: long-term contracts, creator tools
Data and analytics providers
Attribution, insights, and compliance tooling are critical for Moko Social Media Ltd; disruptions like the 2023 Twitter API pricing shift showed how supplier moves can halt features and raise costs. Vendor lock-in increases with deeper integrations, raising switching complexity and operational risk. Investing in in-house analytics reduces long-run supplier power and recurring API spend.
- Gartner 2024: 63% of orgs increased data platform budgets
- 2023 Twitter API changes: industry-wide disruption example
- In-house analytics lowers vendor dependency
Platform fees (15–30%), cloud & creator power squeeze margins
Supplier power is high: Apple/Google take 15–30% on app revenue, AWS/Azure/GCP hold ~32%/24%/11% cloud share, programmatic bought ~85% of US display and creator economy ≈$250bn (2024), driving fee, pricing and access leverage over Moko.
CPM volatility up to ~30% and API/platform rule shifts raise acquisition and operating costs.
Mitigants: web/PWA, multi-cloud, direct-sold inventory, long-term creator deals and in-house analytics.
| Supplier | 2024 metric | Impact |
|---|---|---|
| App stores | 15–30% fee | Revenue drag |
| Cloud | AWS 32%/Azure 24%/GCP 11% | Cost concentration |
| Ad tech | Programmatic ~85% | Yield control |
| Creators | $250bn | Bargaining power |
What is included in the product
Detailed Word Document
Tailored Porter’s Five Forces analysis for Moko Social Media Ltd. uncovering competition drivers, buyer/supplier power, substitutes and entry barriers, identifying disruptive threats and strategic levers to protect market share.
Customizable Excel Spreadsheet
A clear, one-sheet Porter's Five Forces summary for Moko Social Media Ltd—perfect for quick strategic decisions and investor briefings; customize pressure levels as market trends evolve to pinpoint competitive pain points.
Customers Bargaining Power
Users have zero switching costs
Consumers can move among apps instantly, giving users zero switching costs and eroding pricing power for premium features as free alternatives proliferate; Day-30 retention for social apps averaged about 5% in 2024. Retention for Moko Social hinges on network effects and exclusive content—platforms with 100M+ MAU see materially higher engagement. Advanced personalization can raise perceived switching costs and lift willingness to pay.
Advertisers are price sensitive
Advertisers benchmark CPM and CPC across platforms, forcing Moko Social Media to match cross-channel rates; in 2024 roughly 25% of ad budgets were reallocated toward higher-ROI channels within six months, increasing pricing pressure. Brands shift spend quickly when direct performance evidence is lacking, so sustained rates require clear attribution and measured lift. Vertical packages that deliver category-specific KPIs can justify premiums and reduce churn.
Data-driven enterprise clients
Data-driven enterprise clients demand high accuracy, strict privacy controls and SLA compliance—2024 surveys show ~68% rank SLA guarantees as a deal-breaker; they push for 10–25% price concessions and expanded integration scope during contracting. Proof of incrementality is critical for renewals, with clients citing performance lift as the primary retention metric. Robust case studies and developer-friendly APIs increase stickiness and reduce churn.
Niche community expectations
Communities demand tailored features and active moderation; mismatches drive swift churn and public backlash that can harm growth. Intense public feedback loops amplify defections, but professional community managers and clear governance frameworks significantly reduce churn risk.
- Tailored features required
- Public feedback accelerates churn
- Governance cuts defection risk
Premium subscribers are selective
Premium subscribers are highly selective: in 2024 top platforms capture roughly 70% of user attention, so Moko faces direct feature comparisons; trial-to-paid conversion for consumer apps averages 2–5% in 2024, making conversions fragile without clear, measurable value. Annual plans demand trust and consistent updates—SaaS annual retention averages ~80%—while bundles and exclusive content can raise willingness to pay (surveys ~45–50%).
- compare-features: top-5 hold ~70% attention
- conversion-risk: trial-to-paid 2–5% (2024)
- annual-trust: SaaS retention ~80%
- pay-premium: exclusive content lifts willingness to pay ~45–50%
Day-30 ~5%, Ads ~25%, Trials 2–5%
Consumers face near-zero switching costs; day-30 retention for social apps averaged ~5% in 2024, forcing reliance on network effects and exclusive content. Advertisers reallocated ~25% of budgets within six months in 2024, pressuring CPM/CPC; trial-to-paid conversion ran ~2–5%. Enterprise buyers cite SLAs as deal-breakers (~68% in 2024), raising negotiation leverage.
| Metric | 2024 Value | Impact |
|---|---|---|
| Day-30 retention | ~5% | Low stickiness |
| Ad reallocation | ~25% | Pricing pressure |
| Trial-to-paid | 2–5% | Fragile conversions |
| SLA importance | ~68% | Negotiation leverage |
| Top-5 attention | ~70% | Competitive concentration |
What You See Is What You Get
Moko Social Media Ltd. Porter's Five Forces Analysis
This preview shows the exact Moko Social Media Ltd. Porter's Five Forces Analysis you'll receive immediately after purchase—no placeholders or mockups. The document displayed here is the fully formatted, ready-to-use analysis covering competitive rivalry, supplier and buyer power, and threats of entry and substitutes. Once you buy, you'll get instant access to this identical file.











