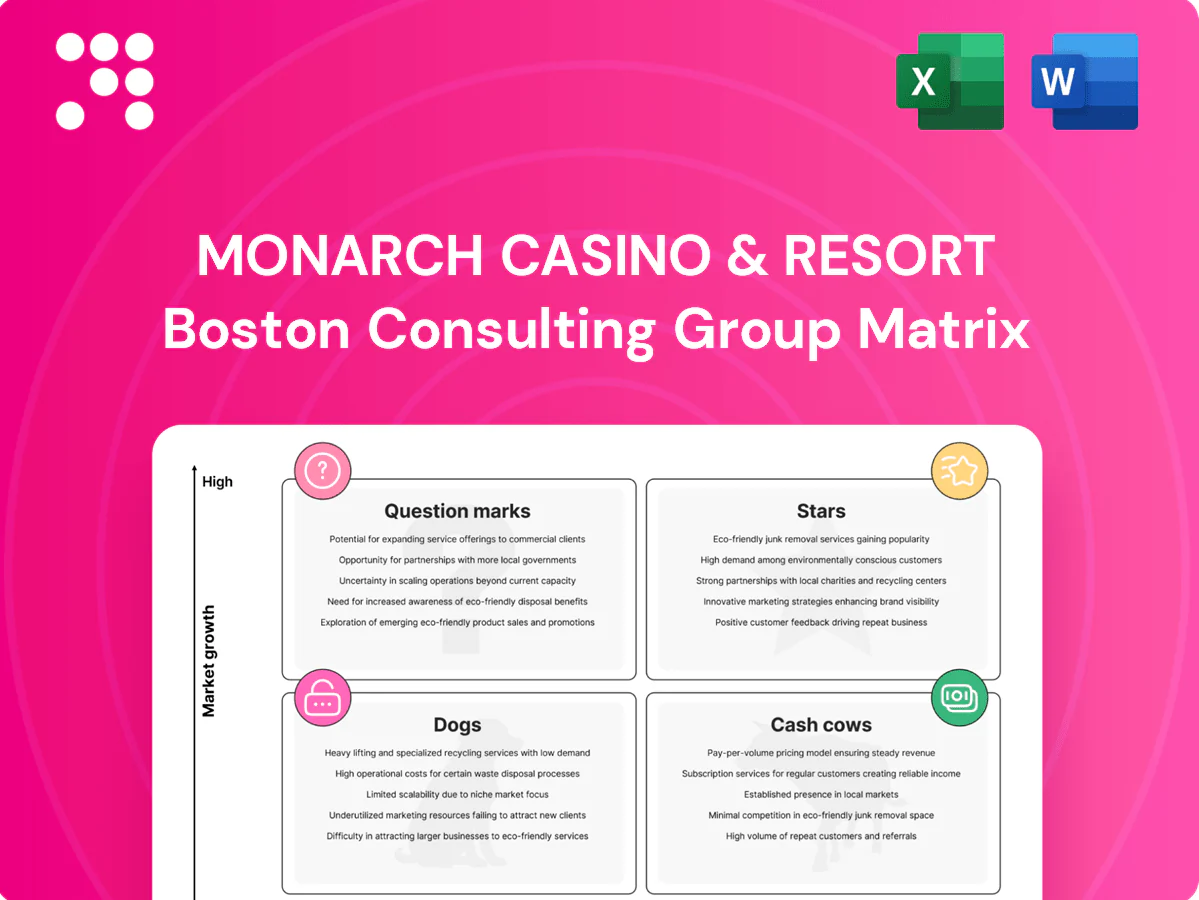
Monarch Casino & Resort Boston Consulting Group Matrix

Visual. Strategic. Downloadable.
Monarch Casino & Resort’s sneak-peek BCG view shows where brand strength and market growth collide—but it’s only the opening act. Buy the full BCG Matrix for quadrant-by-quadrant placements, actionable recommendations, and clear guidance on which assets to double down on or divest. You’ll get a polished Word report plus an Excel summary that’s ready for presentations and quick decisions. Purchase now and skip the guesswork—get strategic clarity in minutes, not weeks.
Stars

Expanded Black Hawk footprint
Expanded Black Hawk footprint places Monarch as a leader in the high-growth Colorado market, with regional gaming revenue rising about 7% year-over-year in 2024 and Monarch's property expansion driving share gains. A stronger gaming mix, ~120 upgraded rooms and upgraded upscale F&B lift spend and visitation. The asset still consumes elevated capex and promotional spend to defend position. Continue investing to convert growth into cash flow as the market matures.
Integrated resort experience
Monarchs integrated resort model—hotel, casino, spa and multiple dining outlets under one roof—increases length of stay and spend through bundled experiences and on-site convenience. Cross-sell between rooms, gaming, F&B and spa creates a sticky loyalty loop that compounds lifetime value. Sustaining this advantage requires ongoing investment in service, technology and live programming; when executed well the model generates strong free cash flow while defending premium market share.

Premium gaming mix
Premium gaming mix leverages high-limit slots and profitable table games to attract top segments; industry benchmarks in 2024 show the top 10% of players generate roughly half of gaming revenue, underscoring their value. These customers respond strongly to targeted offers and consistent white-glove service, driving higher spend per visit. Hold remains healthy but requires constant product refresh; cycle in top-performing games regularly to sustain momentum and revenue concentration.

Upscale F&B flagships
Signature upscale F&B flagships at Monarch lift ADR by about 10% and extend guest gaming time roughly 12%, anchoring longer, higher-value visits while generating brand buzz beyond the floor; when full, they act as growth engines and marketing magnets for the resort.
High labor and food costs push operating margins down, so strict margin discipline, menu engineering and yield management are essential to protect profitability despite premium pricing.
- Revenue lift: ADR +10%
- Guest engagement: gaming time +12%
- Cost pressure: elevated labor & food
- Role: growth engine & marketing magnet
Loyalty-driven direct marketing
Loyalty-driven direct marketing: Data-led offers keep repeat guests coming back and increasing spend when comps are controlled and measured; this requires robust analytics, CRM tuning, and continuous creative testing to sustain margin-accretive growth.
- Tag: data-led offers
- Tag: tight comps & measured economics
- Tag: analytics & CRM tuning
- Tag: creative A/B testing
- Tag: reinvest to amplify list-quality flywheel
Expansion lifted regional gaming ~7%; ADR +10%, gaming time +12%
Black Hawk expansion drove ~7% regional gaming revenue growth in 2024; ~120 upgraded rooms and upscale F&B lifted ADR ~10% and gaming time ~12%. Top 10% of players generated ~50% of gaming revenue; elevated capex and promotional spend persist. Data-led loyalty and CRM analytics are key to converting growth into cash flow.
| Metric | 2024 |
|---|---|
| Regional revenue growth | ~7% |
| Upgraded rooms | ~120 |
| ADR lift | ~10% |
| Gaming time lift | ~12% |
| Top player share | ~50% |
What is included in the product
 Detailed Word Document
Comprehensive BCG Matrix for Monarch Casino & Resort: identifies Stars, Cash Cows, Question Marks, and Dogs with strategic investment recommendations.

 Customizable Excel Spreadsheet
One-page BCG matrix placing each Monarch Casino & Resort unit in a quadrant, cutting clutter and speeding C-suite decisions.
Cash Cows

Atlantis Reno core play
Atlantis Reno core play sits in a mature regional market with ~824 rooms and loyal repeat guests driving predictable cash flow; the property contributes a steady share of Monarch’s consolidated casino operations. With lower capex needs now, focus shifts to optimizing F&B/slots mix and service to boost yield per visit. Prioritize efficiency, gentle milking and reinvest in maintenance and guest experience to sustain EBITDA margins.
Rooms with established ADR
Rooms with established ADR deliver steady occupancy from drive-to and loyal segments, with revenue management keeping rates rational in shoulder periods to protect yield. Limited unit growth constrains top-line expansion, but strong margins persist when housekeeping and energy costs are tightly managed. Strategy: maintain the asset, avoid overspending on expansion, and protect the cash-generating base.

Everyday casual dining
Everyday casual dining at Monarch Casino & Resort delivers high-volume, dependable traffic—peaking on weekends—and functions as a reliable cash cow. Menu engineering and precise labor scheduling are primary margin levers, enabling consistent profitability per seat. Growth is limited but cash generation is steady and bankable. Focus: standardize operations, streamline service, and keep wait times low to preserve throughput.

Parking and resort fees ecosystem
Parking and resort fees are ancillary revenue that hums quietly in the background, often yielding an industry 2024 estimated $20–40 per occupied room while adding minimal incremental operating cost per guest; sensitivity to guest perception is high, so avoid overreach and prioritize upfront disclosure to protect spending and loyalty.
- Transparent pricing
- Bundle smartly (F&B, parking, amenities)
- Monitor NPS closely
- Target incremental yield, not short-term capture
Slot floor staples
Slot floor staples at Monarch Casino & Resort are core titles that deliver steady coin-in year after year, representing low-risk revenue drivers that require minimal refresh cycles. Not flashy but reliable, these machines keep EBITDA predictable and operational costs manageable when uptime is sustained. Focus on high uptime and strategic floor placement to maximize dwell and spend.
- Low volatility revenue
- High uptime = steady coin-in
- Easy maintenance, low capex
- Floor placement critical to yield
Mature regional casino: boost per-visit yield with low-capex slots and F&B upsell
Atlantis Reno (≈824 rooms) sits in a mature regional market generating predictable cash flow with low capex needs; focus on yield per visit via F&B/slots mix and maintenance. Drive-to ADRs sustain occupancy with revenue management protecting shoulder rates. Parking fees (2024 est $20–40 per occupied room) and core slot titles provide steady ancillary and coin-in revenue.
| Metric | 2024 Value |
|---|---|
| Rooms | ≈824 |
| Parking fee (est) | $20–40/occupied room |
| Slot floor | Low capex, high uptime |
| F&B | Weekend-driven high volume |
Preview = Final Product
Monarch Casino & Resort BCG Matrix
The file you're previewing is the final Monarch Casino & Resort BCG Matrix you'll receive after purchase. No watermarks or demo placeholders—just a fully formatted, analysis-ready report tailored for strategic decision-making. It’s crafted for clarity so you can edit, print, or present immediately to stakeholders. Purchase unlocks the exact same document shown here—ready to plug into your planning without surprises.

Visual. Strategic. Downloadable.
Monarch Casino & Resort’s sneak-peek BCG view shows where brand strength and market growth collide—but it’s only the opening act. Buy the full BCG Matrix for quadrant-by-quadrant placements, actionable recommendations, and clear guidance on which assets to double down on or divest. You’ll get a polished Word report plus an Excel summary that’s ready for presentations and quick decisions. Purchase now and skip the guesswork—get strategic clarity in minutes, not weeks.
Stars
Expanded Black Hawk footprint
Expanded Black Hawk footprint places Monarch as a leader in the high-growth Colorado market, with regional gaming revenue rising about 7% year-over-year in 2024 and Monarch's property expansion driving share gains. A stronger gaming mix, ~120 upgraded rooms and upgraded upscale F&B lift spend and visitation. The asset still consumes elevated capex and promotional spend to defend position. Continue investing to convert growth into cash flow as the market matures.
Integrated resort experience
Monarchs integrated resort model—hotel, casino, spa and multiple dining outlets under one roof—increases length of stay and spend through bundled experiences and on-site convenience. Cross-sell between rooms, gaming, F&B and spa creates a sticky loyalty loop that compounds lifetime value. Sustaining this advantage requires ongoing investment in service, technology and live programming; when executed well the model generates strong free cash flow while defending premium market share.
Premium gaming mix
Premium gaming mix leverages high-limit slots and profitable table games to attract top segments; industry benchmarks in 2024 show the top 10% of players generate roughly half of gaming revenue, underscoring their value. These customers respond strongly to targeted offers and consistent white-glove service, driving higher spend per visit. Hold remains healthy but requires constant product refresh; cycle in top-performing games regularly to sustain momentum and revenue concentration.
Upscale F&B flagships
Signature upscale F&B flagships at Monarch lift ADR by about 10% and extend guest gaming time roughly 12%, anchoring longer, higher-value visits while generating brand buzz beyond the floor; when full, they act as growth engines and marketing magnets for the resort.
High labor and food costs push operating margins down, so strict margin discipline, menu engineering and yield management are essential to protect profitability despite premium pricing.
- Revenue lift: ADR +10%
- Guest engagement: gaming time +12%
- Cost pressure: elevated labor & food
- Role: growth engine & marketing magnet
Loyalty-driven direct marketing
Loyalty-driven direct marketing: Data-led offers keep repeat guests coming back and increasing spend when comps are controlled and measured; this requires robust analytics, CRM tuning, and continuous creative testing to sustain margin-accretive growth.
- Tag: data-led offers
- Tag: tight comps & measured economics
- Tag: analytics & CRM tuning
- Tag: creative A/B testing
- Tag: reinvest to amplify list-quality flywheel
Expansion lifted regional gaming ~7%; ADR +10%, gaming time +12%
Black Hawk expansion drove ~7% regional gaming revenue growth in 2024; ~120 upgraded rooms and upscale F&B lifted ADR ~10% and gaming time ~12%. Top 10% of players generated ~50% of gaming revenue; elevated capex and promotional spend persist. Data-led loyalty and CRM analytics are key to converting growth into cash flow.
| Metric | 2024 |
|---|---|
| Regional revenue growth | ~7% |
| Upgraded rooms | ~120 |
| ADR lift | ~10% |
| Gaming time lift | ~12% |
| Top player share | ~50% |
What is included in the product
Detailed Word Document
Comprehensive BCG Matrix for Monarch Casino & Resort: identifies Stars, Cash Cows, Question Marks, and Dogs with strategic investment recommendations.
Customizable Excel Spreadsheet
One-page BCG matrix placing each Monarch Casino & Resort unit in a quadrant, cutting clutter and speeding C-suite decisions.
Cash Cows
Atlantis Reno core play
Atlantis Reno core play sits in a mature regional market with ~824 rooms and loyal repeat guests driving predictable cash flow; the property contributes a steady share of Monarch’s consolidated casino operations. With lower capex needs now, focus shifts to optimizing F&B/slots mix and service to boost yield per visit. Prioritize efficiency, gentle milking and reinvest in maintenance and guest experience to sustain EBITDA margins.
Rooms with established ADR
Rooms with established ADR deliver steady occupancy from drive-to and loyal segments, with revenue management keeping rates rational in shoulder periods to protect yield. Limited unit growth constrains top-line expansion, but strong margins persist when housekeeping and energy costs are tightly managed. Strategy: maintain the asset, avoid overspending on expansion, and protect the cash-generating base.
Everyday casual dining
Everyday casual dining at Monarch Casino & Resort delivers high-volume, dependable traffic—peaking on weekends—and functions as a reliable cash cow. Menu engineering and precise labor scheduling are primary margin levers, enabling consistent profitability per seat. Growth is limited but cash generation is steady and bankable. Focus: standardize operations, streamline service, and keep wait times low to preserve throughput.
Parking and resort fees ecosystem
Parking and resort fees are ancillary revenue that hums quietly in the background, often yielding an industry 2024 estimated $20–40 per occupied room while adding minimal incremental operating cost per guest; sensitivity to guest perception is high, so avoid overreach and prioritize upfront disclosure to protect spending and loyalty.
- Transparent pricing
- Bundle smartly (F&B, parking, amenities)
- Monitor NPS closely
- Target incremental yield, not short-term capture
Slot floor staples
Slot floor staples at Monarch Casino & Resort are core titles that deliver steady coin-in year after year, representing low-risk revenue drivers that require minimal refresh cycles. Not flashy but reliable, these machines keep EBITDA predictable and operational costs manageable when uptime is sustained. Focus on high uptime and strategic floor placement to maximize dwell and spend.
- Low volatility revenue
- High uptime = steady coin-in
- Easy maintenance, low capex
- Floor placement critical to yield
Mature regional casino: boost per-visit yield with low-capex slots and F&B upsell
Atlantis Reno (≈824 rooms) sits in a mature regional market generating predictable cash flow with low capex needs; focus on yield per visit via F&B/slots mix and maintenance. Drive-to ADRs sustain occupancy with revenue management protecting shoulder rates. Parking fees (2024 est $20–40 per occupied room) and core slot titles provide steady ancillary and coin-in revenue.
| Metric | 2024 Value |
|---|---|
| Rooms | ≈824 |
| Parking fee (est) | $20–40/occupied room |
| Slot floor | Low capex, high uptime |
| F&B | Weekend-driven high volume |
Preview = Final Product
Monarch Casino & Resort BCG Matrix
The file you're previewing is the final Monarch Casino & Resort BCG Matrix you'll receive after purchase. No watermarks or demo placeholders—just a fully formatted, analysis-ready report tailored for strategic decision-making. It’s crafted for clarity so you can edit, print, or present immediately to stakeholders. Purchase unlocks the exact same document shown here—ready to plug into your planning without surprises.
Original: $10.00
-65%$10.00
$3.50Description
Visual. Strategic. Downloadable.
Monarch Casino & Resort’s sneak-peek BCG view shows where brand strength and market growth collide—but it’s only the opening act. Buy the full BCG Matrix for quadrant-by-quadrant placements, actionable recommendations, and clear guidance on which assets to double down on or divest. You’ll get a polished Word report plus an Excel summary that’s ready for presentations and quick decisions. Purchase now and skip the guesswork—get strategic clarity in minutes, not weeks.
Stars
Expanded Black Hawk footprint
Expanded Black Hawk footprint places Monarch as a leader in the high-growth Colorado market, with regional gaming revenue rising about 7% year-over-year in 2024 and Monarch's property expansion driving share gains. A stronger gaming mix, ~120 upgraded rooms and upgraded upscale F&B lift spend and visitation. The asset still consumes elevated capex and promotional spend to defend position. Continue investing to convert growth into cash flow as the market matures.
Integrated resort experience
Monarchs integrated resort model—hotel, casino, spa and multiple dining outlets under one roof—increases length of stay and spend through bundled experiences and on-site convenience. Cross-sell between rooms, gaming, F&B and spa creates a sticky loyalty loop that compounds lifetime value. Sustaining this advantage requires ongoing investment in service, technology and live programming; when executed well the model generates strong free cash flow while defending premium market share.
Premium gaming mix
Premium gaming mix leverages high-limit slots and profitable table games to attract top segments; industry benchmarks in 2024 show the top 10% of players generate roughly half of gaming revenue, underscoring their value. These customers respond strongly to targeted offers and consistent white-glove service, driving higher spend per visit. Hold remains healthy but requires constant product refresh; cycle in top-performing games regularly to sustain momentum and revenue concentration.
Upscale F&B flagships
Signature upscale F&B flagships at Monarch lift ADR by about 10% and extend guest gaming time roughly 12%, anchoring longer, higher-value visits while generating brand buzz beyond the floor; when full, they act as growth engines and marketing magnets for the resort.
High labor and food costs push operating margins down, so strict margin discipline, menu engineering and yield management are essential to protect profitability despite premium pricing.
- Revenue lift: ADR +10%
- Guest engagement: gaming time +12%
- Cost pressure: elevated labor & food
- Role: growth engine & marketing magnet
Loyalty-driven direct marketing
Loyalty-driven direct marketing: Data-led offers keep repeat guests coming back and increasing spend when comps are controlled and measured; this requires robust analytics, CRM tuning, and continuous creative testing to sustain margin-accretive growth.
- Tag: data-led offers
- Tag: tight comps & measured economics
- Tag: analytics & CRM tuning
- Tag: creative A/B testing
- Tag: reinvest to amplify list-quality flywheel
Expansion lifted regional gaming ~7%; ADR +10%, gaming time +12%
Black Hawk expansion drove ~7% regional gaming revenue growth in 2024; ~120 upgraded rooms and upscale F&B lifted ADR ~10% and gaming time ~12%. Top 10% of players generated ~50% of gaming revenue; elevated capex and promotional spend persist. Data-led loyalty and CRM analytics are key to converting growth into cash flow.
| Metric | 2024 |
|---|---|
| Regional revenue growth | ~7% |
| Upgraded rooms | ~120 |
| ADR lift | ~10% |
| Gaming time lift | ~12% |
| Top player share | ~50% |
What is included in the product
Detailed Word Document
Comprehensive BCG Matrix for Monarch Casino & Resort: identifies Stars, Cash Cows, Question Marks, and Dogs with strategic investment recommendations.
Customizable Excel Spreadsheet
One-page BCG matrix placing each Monarch Casino & Resort unit in a quadrant, cutting clutter and speeding C-suite decisions.
Cash Cows
Atlantis Reno core play
Atlantis Reno core play sits in a mature regional market with ~824 rooms and loyal repeat guests driving predictable cash flow; the property contributes a steady share of Monarch’s consolidated casino operations. With lower capex needs now, focus shifts to optimizing F&B/slots mix and service to boost yield per visit. Prioritize efficiency, gentle milking and reinvest in maintenance and guest experience to sustain EBITDA margins.
Rooms with established ADR
Rooms with established ADR deliver steady occupancy from drive-to and loyal segments, with revenue management keeping rates rational in shoulder periods to protect yield. Limited unit growth constrains top-line expansion, but strong margins persist when housekeeping and energy costs are tightly managed. Strategy: maintain the asset, avoid overspending on expansion, and protect the cash-generating base.
Everyday casual dining
Everyday casual dining at Monarch Casino & Resort delivers high-volume, dependable traffic—peaking on weekends—and functions as a reliable cash cow. Menu engineering and precise labor scheduling are primary margin levers, enabling consistent profitability per seat. Growth is limited but cash generation is steady and bankable. Focus: standardize operations, streamline service, and keep wait times low to preserve throughput.
Parking and resort fees ecosystem
Parking and resort fees are ancillary revenue that hums quietly in the background, often yielding an industry 2024 estimated $20–40 per occupied room while adding minimal incremental operating cost per guest; sensitivity to guest perception is high, so avoid overreach and prioritize upfront disclosure to protect spending and loyalty.
- Transparent pricing
- Bundle smartly (F&B, parking, amenities)
- Monitor NPS closely
- Target incremental yield, not short-term capture
Slot floor staples
Slot floor staples at Monarch Casino & Resort are core titles that deliver steady coin-in year after year, representing low-risk revenue drivers that require minimal refresh cycles. Not flashy but reliable, these machines keep EBITDA predictable and operational costs manageable when uptime is sustained. Focus on high uptime and strategic floor placement to maximize dwell and spend.
- Low volatility revenue
- High uptime = steady coin-in
- Easy maintenance, low capex
- Floor placement critical to yield
Mature regional casino: boost per-visit yield with low-capex slots and F&B upsell
Atlantis Reno (≈824 rooms) sits in a mature regional market generating predictable cash flow with low capex needs; focus on yield per visit via F&B/slots mix and maintenance. Drive-to ADRs sustain occupancy with revenue management protecting shoulder rates. Parking fees (2024 est $20–40 per occupied room) and core slot titles provide steady ancillary and coin-in revenue.
| Metric | 2024 Value |
|---|---|
| Rooms | ≈824 |
| Parking fee (est) | $20–40/occupied room |
| Slot floor | Low capex, high uptime |
| F&B | Weekend-driven high volume |
Preview = Final Product
Monarch Casino & Resort BCG Matrix
The file you're previewing is the final Monarch Casino & Resort BCG Matrix you'll receive after purchase. No watermarks or demo placeholders—just a fully formatted, analysis-ready report tailored for strategic decision-making. It’s crafted for clarity so you can edit, print, or present immediately to stakeholders. Purchase unlocks the exact same document shown here—ready to plug into your planning without surprises.











