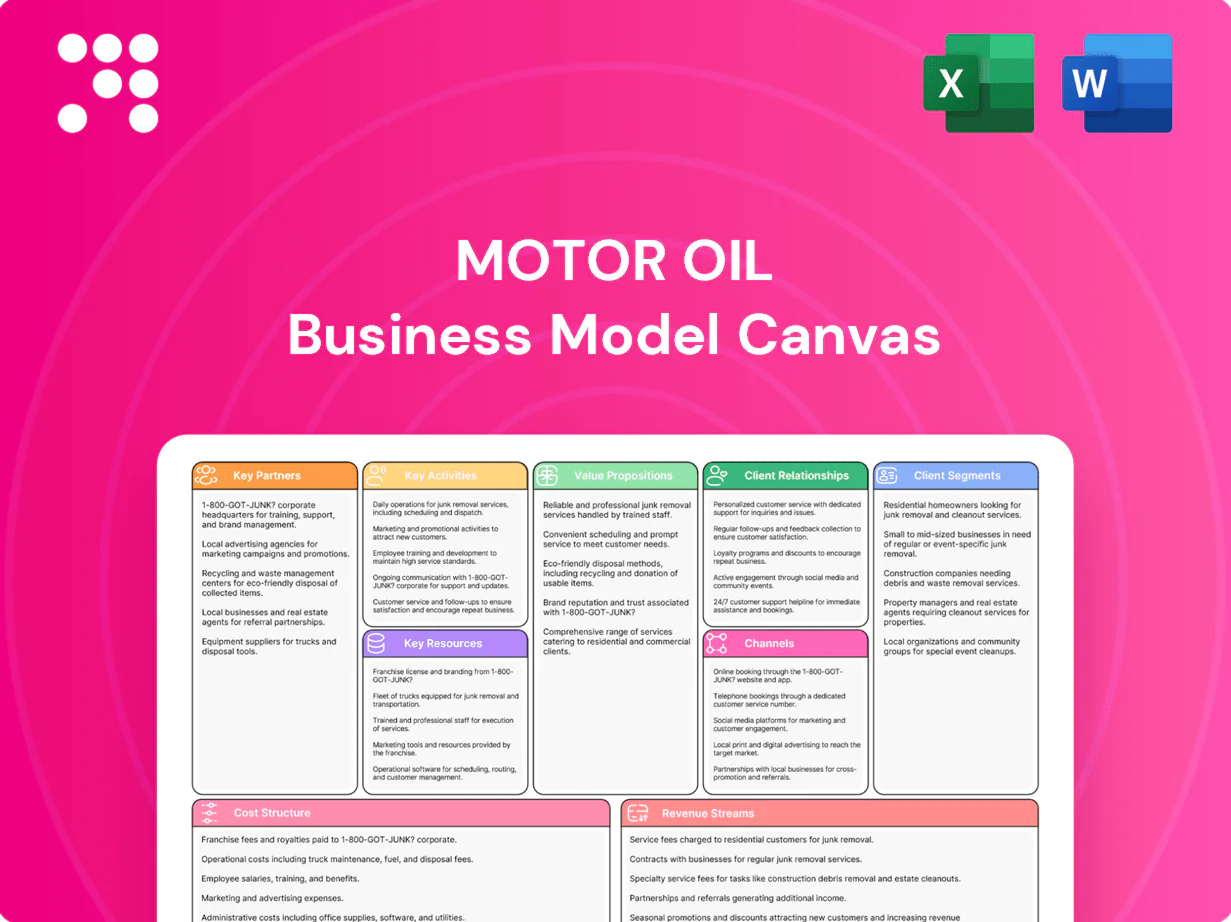
Motor Oil Business Model Canvas

Unlock an oil refiner Business Model Canvas: value, partners, revenue and cost levers
Unlock Motor Oil’s strategic playbook with a concise Business Model Canvas that maps value propositions, key partners, revenue streams and cost drivers. This snapshot uncovers competitive advantages and growth levers in a capital-intensive sector. Purchase the full, editable Canvas (Word/Excel) for a section-by-section guide to replicate or benchmark success.
Partnerships

Crude supply agreements
Crude supply agreements secure offtake from global producers, ensuring reliable feedstock and grade optionality; Motor Oil’s 2024 refinery throughput was about 11.5 million tonnes, underpinning stable operations. A mix of long-term and spot contracts balances price exposure with continuity, with spot purchases smoothing margins during 2024 Brent volatility. Strategic sourcing hubs in the Med, Black Sea and MENA cut logistics costs and transit times, while supplier diversification strengthens bargaining power and resilience.
Logistics & shipping alliances
Terminal operators, tank storage providers and tanker charters coordinate inbound crude and outbound products for Motor Oil’s Corinth refinery (crude capacity ~7.5 Mtpa), optimizing ship-to-shore flows and storage utilization. Port authorities and pilots sustain high-throughput operations at Corinth and regional terminals. Rail and truck partners extend reach inland. Joint scheduling cuts demurrage and improves vessel/terminal turnaround.

Power & gas ecosystem
Partnerships with electricity market operators, gas suppliers and grid operators enable Motor Oil to optimize power trading and cogeneration, capturing market spreads and reducing curtailment. LNG/LPG aggregators add supply flexibility amid global LNG trade of about 380 Mt in 2023 (IEA) and rising 2024 flows. Bilateral PPAs and balancing service providers lift margins by stabilizing cash flows and cutting imbalance costs. Cross-vector collaboration accelerates integration across power, gas and fuels.

Retail & wholesale distributors
Dealer networks and independent retailers expand market coverage for fuels and lubricants across roughly 1,000,000 retail stations worldwide in 2024; B2B wholesalers supply industrial and commercial fleets while co-branding and supply exclusivity boost channel loyalty and margin capture. Shared demand planning helps stabilize refinery runs and optimize throughput; the global lubricants market was about $40.7 billion in 2024.
- Dealer networks: wider station reach (~1,000,000 stations, 2024)
- Wholesalers: fleets & commercial accounts
- Co-branding: deeper loyalty, higher retention
- Shared demand planning: stabilizes refinery runs
- Market size: lubricants ~$40.7B (2024)
Technology & compliance partners
Process licensors, catalyst vendors and digital OEMs raise refining yields and energy efficiency; environmental consultants and auditors secure ESG, emissions and safety compliance amid EU carbon prices ~90 €/t in 2024; universities and R&D centers accelerate product innovation; cybersecurity and ERP partners protect uptime and data (average breach cost $4.45M, IBM 2024).
- Licensors & catalysts: yield & efficiency
- Environmental auditors: ESG & emissions (~90 €/t 2024)
- Universities & R&D: product innovation
- Cybersecurity & ERP: operational reliability ($4.45M breach cost 2024)
Crude & terminals secure 11.5 Mt throughput; lubricants $40.7B
Crude offtake and spot mixes secure feedstock for 11.5 Mt throughput (2024) and Corinth refinery ~7.5 Mtpa. Logistics, terminals and dealers (~1,000,000 stations reach) optimize flows and margins; lubricants market ~$40.7B (2024). Power/gas PPAs, LNG flexibility and licensors cut costs vs EU carbon ~90 €/t (2024) and cyber risk ~$4.45M breach cost (2024).
| Metric | 2024 |
|---|---|
| Refinery throughput | 11.5 Mt |
| Corinth capacity | 7.5 Mtpa |
| Dealer reach | ~1,000,000 stations |
| Lubricants market | $40.7B |
| EU carbon price | ~90 €/t |
| Avg breach cost | $4.45M |
What is included in the product
 Detailed Word Document
A comprehensive Motor Oil Business Model Canvas detailing nine BMC blocks—customer segments (B2B/B2C), channels (refining, retail, marine, exports), value propositions (reliable fuel, petrochemicals, integrated logistics), key activities/assets (refineries, terminals, power), partners, revenue/cost structure and competitive advantages, plus linked SWOT and investor-ready narrative for strategic and funding use.

 Customizable Excel Spreadsheet
High-level view of Motor Oil’s business model with editable cells to quickly map refining, retail and logistics pain points. Great for brainstorming or boardroom use, saving hours by condensing strategy into a shareable, one-page snapshot for rapid decision-making.
Activities

Refining operations
Crude distillation, conversion, hydrotreating and blending at Motor Oil’s Corinth complex (7.5 Mtpa refining capacity) produce fuels and lubricants across gasoline, diesel and base oils. Scheduled turnarounds and reliability-centered maintenance target >95% availability, minimizing unplanned downtime. Advanced process control and digital optimisation lift product yields by ~1–2% and cut energy intensity around 5%. On-site quality labs ensure >99.9% spec compliance for shipments.
Supply & trading
Crude procurement and hedging by Motor Oil (refinery capacity c.280,000 barrels/day) balance margin exposure through coordinated buying and derivatives to protect refining margins.
Scheduling and inventory management smooth feedstock and product volatility, optimizing throughput and working capital across the Corinth complex.
Arbitrage across Mediterranean markets captures regional price dislocations while strict credit and risk management frameworks safeguard counterparties and limit counterparty exposure.

Marketing & distribution
Fuel, LPG, LNG/natural gas and lubricants are sold to retail and B2B clients, with lubricants part of a ~USD 35bn global market in 2024. Pricing, promotions and brand management drive share, while fleet and card programs secure over 50% of commercial volumes. After-sales support and technical service raise retention, cross-sell and margin.

Power generation & trading
Power generation & trading combines cogen and power assets to supply electricity and steam for refinery operations and the grid; in 2024 these assets support operational resilience and merchant sales. Trading monetizes flexibility via bids, balancing and ancillary services, capturing volatility in day-ahead and intraday markets. Gas procurement is aligned with spark spreads while emissions management (EU ETS compliance) optimizes netbacks.
- Assets: cogeneration for internal use and export
- Markets: bids, balancing, ancillary services
- Fuel: gas sourcing tied to spark spreads
- Emissions: ETS-driven netback optimization
ESG, safety, and compliance
Process safety, environmental controls and continuous monitoring comply with EU Industrial Emissions Directive and Greek permitting; EU ETS carbon price averaged about €80/t in 2024, driving emissions management. Energy-efficiency and decarbonization initiatives target lower carbon intensity and operational costs, aligned with EU -55% GHG by 2030. Reporting follows EU taxonomy, CSRD and Greek law, while active community engagement preserves license to operate.
- EU ETS ~€80/t (2024)
- EU GHG target -55% by 2030
- Compliance: IED, CSRD, EU taxonomy
- Stakeholder engagement: community programs, permitting
Refinery 7.5 Mtpa, > 95% uptime, +1–2%
Crude processing (7.5 Mtpa Corinth; c.280,000 b/d) plus conversion, hydrotreating and blending produce fuels, base oils and lubes with >95% availability. Digital optimisation raises yields ~1–2% and cuts energy intensity ~5%; on-site labs ensure >99.9% spec compliance. Trading, procurement and hedging protect margins; retail/fleet channels secure >50% commercial volumes.
| Metric | 2024 |
|---|---|
| Refinery capacity | 7.5 Mtpa / 280,000 b/d |
| Availability | >95% |
| Yield uplift | ~1–2% |
| Energy reduction | ~5% |
| EU ETS price | €80/t |
| Lubricants market | USD 35bn |
Full Document Unlocks After Purchase
Business Model Canvas
The Motor Oil Business Model Canvas you see here is the exact document, not a mockup—this preview is a direct snapshot of the final deliverable. When you purchase, you’ll receive the same complete file ready to edit and present, available in Word and Excel. No extras or surprises: instant download of the full, professionally formatted canvas.

Unlock an oil refiner Business Model Canvas: value, partners, revenue and cost levers
Unlock Motor Oil’s strategic playbook with a concise Business Model Canvas that maps value propositions, key partners, revenue streams and cost drivers. This snapshot uncovers competitive advantages and growth levers in a capital-intensive sector. Purchase the full, editable Canvas (Word/Excel) for a section-by-section guide to replicate or benchmark success.
Partnerships
Crude supply agreements
Crude supply agreements secure offtake from global producers, ensuring reliable feedstock and grade optionality; Motor Oil’s 2024 refinery throughput was about 11.5 million tonnes, underpinning stable operations. A mix of long-term and spot contracts balances price exposure with continuity, with spot purchases smoothing margins during 2024 Brent volatility. Strategic sourcing hubs in the Med, Black Sea and MENA cut logistics costs and transit times, while supplier diversification strengthens bargaining power and resilience.
Logistics & shipping alliances
Terminal operators, tank storage providers and tanker charters coordinate inbound crude and outbound products for Motor Oil’s Corinth refinery (crude capacity ~7.5 Mtpa), optimizing ship-to-shore flows and storage utilization. Port authorities and pilots sustain high-throughput operations at Corinth and regional terminals. Rail and truck partners extend reach inland. Joint scheduling cuts demurrage and improves vessel/terminal turnaround.
Power & gas ecosystem
Partnerships with electricity market operators, gas suppliers and grid operators enable Motor Oil to optimize power trading and cogeneration, capturing market spreads and reducing curtailment. LNG/LPG aggregators add supply flexibility amid global LNG trade of about 380 Mt in 2023 (IEA) and rising 2024 flows. Bilateral PPAs and balancing service providers lift margins by stabilizing cash flows and cutting imbalance costs. Cross-vector collaboration accelerates integration across power, gas and fuels.
Retail & wholesale distributors
Dealer networks and independent retailers expand market coverage for fuels and lubricants across roughly 1,000,000 retail stations worldwide in 2024; B2B wholesalers supply industrial and commercial fleets while co-branding and supply exclusivity boost channel loyalty and margin capture. Shared demand planning helps stabilize refinery runs and optimize throughput; the global lubricants market was about $40.7 billion in 2024.
- Dealer networks: wider station reach (~1,000,000 stations, 2024)
- Wholesalers: fleets & commercial accounts
- Co-branding: deeper loyalty, higher retention
- Shared demand planning: stabilizes refinery runs
- Market size: lubricants ~$40.7B (2024)
Technology & compliance partners
Process licensors, catalyst vendors and digital OEMs raise refining yields and energy efficiency; environmental consultants and auditors secure ESG, emissions and safety compliance amid EU carbon prices ~90 €/t in 2024; universities and R&D centers accelerate product innovation; cybersecurity and ERP partners protect uptime and data (average breach cost $4.45M, IBM 2024).
- Licensors & catalysts: yield & efficiency
- Environmental auditors: ESG & emissions (~90 €/t 2024)
- Universities & R&D: product innovation
- Cybersecurity & ERP: operational reliability ($4.45M breach cost 2024)
Crude & terminals secure 11.5 Mt throughput; lubricants $40.7B
Crude offtake and spot mixes secure feedstock for 11.5 Mt throughput (2024) and Corinth refinery ~7.5 Mtpa. Logistics, terminals and dealers (~1,000,000 stations reach) optimize flows and margins; lubricants market ~$40.7B (2024). Power/gas PPAs, LNG flexibility and licensors cut costs vs EU carbon ~90 €/t (2024) and cyber risk ~$4.45M breach cost (2024).
| Metric | 2024 |
|---|---|
| Refinery throughput | 11.5 Mt |
| Corinth capacity | 7.5 Mtpa |
| Dealer reach | ~1,000,000 stations |
| Lubricants market | $40.7B |
| EU carbon price | ~90 €/t |
| Avg breach cost | $4.45M |
What is included in the product
Detailed Word Document
A comprehensive Motor Oil Business Model Canvas detailing nine BMC blocks—customer segments (B2B/B2C), channels (refining, retail, marine, exports), value propositions (reliable fuel, petrochemicals, integrated logistics), key activities/assets (refineries, terminals, power), partners, revenue/cost structure and competitive advantages, plus linked SWOT and investor-ready narrative for strategic and funding use.
Customizable Excel Spreadsheet
High-level view of Motor Oil’s business model with editable cells to quickly map refining, retail and logistics pain points. Great for brainstorming or boardroom use, saving hours by condensing strategy into a shareable, one-page snapshot for rapid decision-making.
Activities
Refining operations
Crude distillation, conversion, hydrotreating and blending at Motor Oil’s Corinth complex (7.5 Mtpa refining capacity) produce fuels and lubricants across gasoline, diesel and base oils. Scheduled turnarounds and reliability-centered maintenance target >95% availability, minimizing unplanned downtime. Advanced process control and digital optimisation lift product yields by ~1–2% and cut energy intensity around 5%. On-site quality labs ensure >99.9% spec compliance for shipments.
Supply & trading
Crude procurement and hedging by Motor Oil (refinery capacity c.280,000 barrels/day) balance margin exposure through coordinated buying and derivatives to protect refining margins.
Scheduling and inventory management smooth feedstock and product volatility, optimizing throughput and working capital across the Corinth complex.
Arbitrage across Mediterranean markets captures regional price dislocations while strict credit and risk management frameworks safeguard counterparties and limit counterparty exposure.
Marketing & distribution
Fuel, LPG, LNG/natural gas and lubricants are sold to retail and B2B clients, with lubricants part of a ~USD 35bn global market in 2024. Pricing, promotions and brand management drive share, while fleet and card programs secure over 50% of commercial volumes. After-sales support and technical service raise retention, cross-sell and margin.
Power generation & trading
Power generation & trading combines cogen and power assets to supply electricity and steam for refinery operations and the grid; in 2024 these assets support operational resilience and merchant sales. Trading monetizes flexibility via bids, balancing and ancillary services, capturing volatility in day-ahead and intraday markets. Gas procurement is aligned with spark spreads while emissions management (EU ETS compliance) optimizes netbacks.
- Assets: cogeneration for internal use and export
- Markets: bids, balancing, ancillary services
- Fuel: gas sourcing tied to spark spreads
- Emissions: ETS-driven netback optimization
ESG, safety, and compliance
Process safety, environmental controls and continuous monitoring comply with EU Industrial Emissions Directive and Greek permitting; EU ETS carbon price averaged about €80/t in 2024, driving emissions management. Energy-efficiency and decarbonization initiatives target lower carbon intensity and operational costs, aligned with EU -55% GHG by 2030. Reporting follows EU taxonomy, CSRD and Greek law, while active community engagement preserves license to operate.
- EU ETS ~€80/t (2024)
- EU GHG target -55% by 2030
- Compliance: IED, CSRD, EU taxonomy
- Stakeholder engagement: community programs, permitting
Refinery 7.5 Mtpa, > 95% uptime, +1–2%
Crude processing (7.5 Mtpa Corinth; c.280,000 b/d) plus conversion, hydrotreating and blending produce fuels, base oils and lubes with >95% availability. Digital optimisation raises yields ~1–2% and cuts energy intensity ~5%; on-site labs ensure >99.9% spec compliance. Trading, procurement and hedging protect margins; retail/fleet channels secure >50% commercial volumes.
| Metric | 2024 |
|---|---|
| Refinery capacity | 7.5 Mtpa / 280,000 b/d |
| Availability | >95% |
| Yield uplift | ~1–2% |
| Energy reduction | ~5% |
| EU ETS price | €80/t |
| Lubricants market | USD 35bn |
Full Document Unlocks After Purchase
Business Model Canvas
The Motor Oil Business Model Canvas you see here is the exact document, not a mockup—this preview is a direct snapshot of the final deliverable. When you purchase, you’ll receive the same complete file ready to edit and present, available in Word and Excel. No extras or surprises: instant download of the full, professionally formatted canvas.
Original: $10.00
-65%$10.00
$3.50Description
Unlock an oil refiner Business Model Canvas: value, partners, revenue and cost levers
Unlock Motor Oil’s strategic playbook with a concise Business Model Canvas that maps value propositions, key partners, revenue streams and cost drivers. This snapshot uncovers competitive advantages and growth levers in a capital-intensive sector. Purchase the full, editable Canvas (Word/Excel) for a section-by-section guide to replicate or benchmark success.
Partnerships
Crude supply agreements
Crude supply agreements secure offtake from global producers, ensuring reliable feedstock and grade optionality; Motor Oil’s 2024 refinery throughput was about 11.5 million tonnes, underpinning stable operations. A mix of long-term and spot contracts balances price exposure with continuity, with spot purchases smoothing margins during 2024 Brent volatility. Strategic sourcing hubs in the Med, Black Sea and MENA cut logistics costs and transit times, while supplier diversification strengthens bargaining power and resilience.
Logistics & shipping alliances
Terminal operators, tank storage providers and tanker charters coordinate inbound crude and outbound products for Motor Oil’s Corinth refinery (crude capacity ~7.5 Mtpa), optimizing ship-to-shore flows and storage utilization. Port authorities and pilots sustain high-throughput operations at Corinth and regional terminals. Rail and truck partners extend reach inland. Joint scheduling cuts demurrage and improves vessel/terminal turnaround.
Power & gas ecosystem
Partnerships with electricity market operators, gas suppliers and grid operators enable Motor Oil to optimize power trading and cogeneration, capturing market spreads and reducing curtailment. LNG/LPG aggregators add supply flexibility amid global LNG trade of about 380 Mt in 2023 (IEA) and rising 2024 flows. Bilateral PPAs and balancing service providers lift margins by stabilizing cash flows and cutting imbalance costs. Cross-vector collaboration accelerates integration across power, gas and fuels.
Retail & wholesale distributors
Dealer networks and independent retailers expand market coverage for fuels and lubricants across roughly 1,000,000 retail stations worldwide in 2024; B2B wholesalers supply industrial and commercial fleets while co-branding and supply exclusivity boost channel loyalty and margin capture. Shared demand planning helps stabilize refinery runs and optimize throughput; the global lubricants market was about $40.7 billion in 2024.
- Dealer networks: wider station reach (~1,000,000 stations, 2024)
- Wholesalers: fleets & commercial accounts
- Co-branding: deeper loyalty, higher retention
- Shared demand planning: stabilizes refinery runs
- Market size: lubricants ~$40.7B (2024)
Technology & compliance partners
Process licensors, catalyst vendors and digital OEMs raise refining yields and energy efficiency; environmental consultants and auditors secure ESG, emissions and safety compliance amid EU carbon prices ~90 €/t in 2024; universities and R&D centers accelerate product innovation; cybersecurity and ERP partners protect uptime and data (average breach cost $4.45M, IBM 2024).
- Licensors & catalysts: yield & efficiency
- Environmental auditors: ESG & emissions (~90 €/t 2024)
- Universities & R&D: product innovation
- Cybersecurity & ERP: operational reliability ($4.45M breach cost 2024)
Crude & terminals secure 11.5 Mt throughput; lubricants $40.7B
Crude offtake and spot mixes secure feedstock for 11.5 Mt throughput (2024) and Corinth refinery ~7.5 Mtpa. Logistics, terminals and dealers (~1,000,000 stations reach) optimize flows and margins; lubricants market ~$40.7B (2024). Power/gas PPAs, LNG flexibility and licensors cut costs vs EU carbon ~90 €/t (2024) and cyber risk ~$4.45M breach cost (2024).
| Metric | 2024 |
|---|---|
| Refinery throughput | 11.5 Mt |
| Corinth capacity | 7.5 Mtpa |
| Dealer reach | ~1,000,000 stations |
| Lubricants market | $40.7B |
| EU carbon price | ~90 €/t |
| Avg breach cost | $4.45M |
What is included in the product
Detailed Word Document
A comprehensive Motor Oil Business Model Canvas detailing nine BMC blocks—customer segments (B2B/B2C), channels (refining, retail, marine, exports), value propositions (reliable fuel, petrochemicals, integrated logistics), key activities/assets (refineries, terminals, power), partners, revenue/cost structure and competitive advantages, plus linked SWOT and investor-ready narrative for strategic and funding use.
Customizable Excel Spreadsheet
High-level view of Motor Oil’s business model with editable cells to quickly map refining, retail and logistics pain points. Great for brainstorming or boardroom use, saving hours by condensing strategy into a shareable, one-page snapshot for rapid decision-making.
Activities
Refining operations
Crude distillation, conversion, hydrotreating and blending at Motor Oil’s Corinth complex (7.5 Mtpa refining capacity) produce fuels and lubricants across gasoline, diesel and base oils. Scheduled turnarounds and reliability-centered maintenance target >95% availability, minimizing unplanned downtime. Advanced process control and digital optimisation lift product yields by ~1–2% and cut energy intensity around 5%. On-site quality labs ensure >99.9% spec compliance for shipments.
Supply & trading
Crude procurement and hedging by Motor Oil (refinery capacity c.280,000 barrels/day) balance margin exposure through coordinated buying and derivatives to protect refining margins.
Scheduling and inventory management smooth feedstock and product volatility, optimizing throughput and working capital across the Corinth complex.
Arbitrage across Mediterranean markets captures regional price dislocations while strict credit and risk management frameworks safeguard counterparties and limit counterparty exposure.
Marketing & distribution
Fuel, LPG, LNG/natural gas and lubricants are sold to retail and B2B clients, with lubricants part of a ~USD 35bn global market in 2024. Pricing, promotions and brand management drive share, while fleet and card programs secure over 50% of commercial volumes. After-sales support and technical service raise retention, cross-sell and margin.
Power generation & trading
Power generation & trading combines cogen and power assets to supply electricity and steam for refinery operations and the grid; in 2024 these assets support operational resilience and merchant sales. Trading monetizes flexibility via bids, balancing and ancillary services, capturing volatility in day-ahead and intraday markets. Gas procurement is aligned with spark spreads while emissions management (EU ETS compliance) optimizes netbacks.
- Assets: cogeneration for internal use and export
- Markets: bids, balancing, ancillary services
- Fuel: gas sourcing tied to spark spreads
- Emissions: ETS-driven netback optimization
ESG, safety, and compliance
Process safety, environmental controls and continuous monitoring comply with EU Industrial Emissions Directive and Greek permitting; EU ETS carbon price averaged about €80/t in 2024, driving emissions management. Energy-efficiency and decarbonization initiatives target lower carbon intensity and operational costs, aligned with EU -55% GHG by 2030. Reporting follows EU taxonomy, CSRD and Greek law, while active community engagement preserves license to operate.
- EU ETS ~€80/t (2024)
- EU GHG target -55% by 2030
- Compliance: IED, CSRD, EU taxonomy
- Stakeholder engagement: community programs, permitting
Refinery 7.5 Mtpa, > 95% uptime, +1–2%
Crude processing (7.5 Mtpa Corinth; c.280,000 b/d) plus conversion, hydrotreating and blending produce fuels, base oils and lubes with >95% availability. Digital optimisation raises yields ~1–2% and cuts energy intensity ~5%; on-site labs ensure >99.9% spec compliance. Trading, procurement and hedging protect margins; retail/fleet channels secure >50% commercial volumes.
| Metric | 2024 |
|---|---|
| Refinery capacity | 7.5 Mtpa / 280,000 b/d |
| Availability | >95% |
| Yield uplift | ~1–2% |
| Energy reduction | ~5% |
| EU ETS price | €80/t |
| Lubricants market | USD 35bn |
Full Document Unlocks After Purchase
Business Model Canvas
The Motor Oil Business Model Canvas you see here is the exact document, not a mockup—this preview is a direct snapshot of the final deliverable. When you purchase, you’ll receive the same complete file ready to edit and present, available in Word and Excel. No extras or surprises: instant download of the full, professionally formatted canvas.











