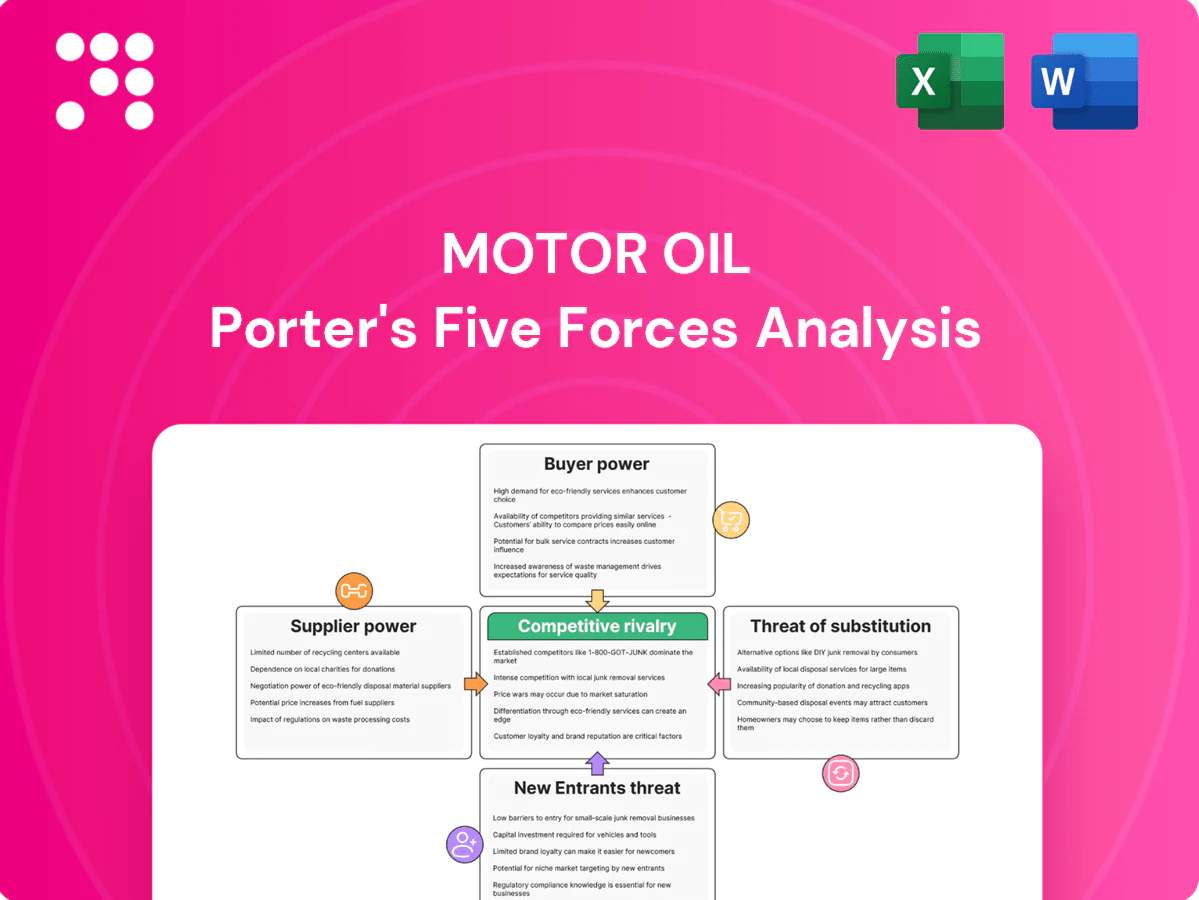
Motor Oil Porter's Five Forces Analysis

Elevate Your Analysis with the Complete Porter's Five Forces Analysis
Motor Oil faces varied pressures from supplier bargaining to substitute fuels, with competitive intensity shaped by scale and regulatory risk. This snapshot highlights key vulnerabilities and strategic levers. Unlock the full Porter's Five Forces Analysis for force-by-force ratings, visuals, and actionable recommendations to inform investment or strategy.
Suppliers Bargaining Power

Concentrated crude sources
Crude supply is concentrated among a few national oil companies and trading houses—OPEC+ and majors account for roughly 40–50% of global production in 2024—giving them pricing leverage. Sanctions, OPEC+ cuts and Mediterranean geopolitical risks tighten availability of refinery-compatible grades. Motor Oil hedges, secures long‑term offtake and diversifies trading, but unit configuration limits feedstock optionality. Hedging tempers volatility but does not remove supplier power.
Logistics and maritime constraints
Sea-borne crude and product flows hinge on tanker availability, freight rates and port operations; the Suez Canal alone handles about 12% of global seaborne trade, so disruptions rapidly tighten markets. Blockages or Bosporus/port outages elevate voyage times and insurance, squeezing Motor Oil’s negotiating flexibility. Greece’s location gives route options but seasonal congestion and double-digit 2024 spot-rate volatility let suppliers pass through higher freight and insurance costs.

Specialty inputs and catalysts
Process catalysts, specialty additives and turnaround services are sourced from a concentrated global cohort — notable suppliers include BASF, Johnson Matthey, Clariant and W.R. Grace. Switching costs are high because of performance qualification and warranty exposure. Lead times commonly extend weeks to months and price pass-throughs during outages amplify vendor leverage, while framework agreements mitigate but do not eliminate supplier concentration.

Natural gas and power feedstock
Natural gas and power feedstock costs track regional hub prices and LNG availability; EU market tightness after 2022 (TTF spikes >200 €/MWh) elevated supplier power. Greece’s Revithoussa plus new FSRUs and interconnectors improved access but remain tied to EU pricing. Long-term PPAs and hedges reduced but did not eliminate exposure in 2024.
- EU TTF volatility: post-2022 surge
- Greece LNG/regas capacity improved access
- PPAs/hedges: partial price protection
Compliance and carbon costs
EU ETS allowances function as a regulated input for Motor Oil — EUA average in 2024 ~€88/t — while EU renewable fuel mandates (RED II target ~14% renewable energy in transport by 2030) push demand for bio-components; limited supply and rising carbon prices strengthen certificate and bio-component suppliers. Refiners face pass-through limits in weak demand periods, embedding structural upstream cost pressure from compliance providers.
Supply squeeze: OPEC+ 40–50%, Suez risk and €88/t EUA tighten margins
Suppliers exert above-average power: OPEC+ and majors supply ~40–50% of crude in 2024, limiting price flexibility. Freight, Suez risks (12% of seaborne trade) and tanker tightness raise logistics costs. Critical catalysts/additives and EUA prices (~€88/t in 2024) are concentrated, with long lead times and limited biofeedstocks tightening inputs.
| Metric | 2024 Value |
|---|---|
| OPEC+ share | 40–50% |
| Suez seaborne trade | ~12% |
| EU EUA avg | ~€88/t |
What is included in the product
 Detailed Word Document
Provides a concise Porter’s Five Forces assessment tailored to Motor Oil, uncovering competitive intensity, buyer/supplier power, threats from new entrants and substitutes, and strategic barriers protecting incumbents, with actionable insights on emerging disruptions and profitability drivers.

 Customizable Excel Spreadsheet
A concise Porter's Five Forces snapshot for Motor Oil—instantly pinpoint supplier, buyer, competitive, entrant and substitute pressures to streamline strategic decisions and prioritize mitigation actions.
Customers Bargaining Power

Diverse but price sensitive base
Customers range from wholesalers, retail networks, aviation, marine bunkering, industry and power traders; many segments are highly price sensitive with roughly 60–80% of commercial contracts benchmark-linked to Platts/ICE, limiting margin capture. Product commoditization in fuels constrains differentiation; brand and forecourt services aid retail loyalty but rarely fully prevent price-driven switching, pressuring margins in 2024 market conditions.
Large contract buyers
Large contract buyers such as airlines, shipping fleets and utilities negotiate sizable volumes under formula pricing, using scale to force tougher terms, flexible deliveries and strict quality specs. IATA reported 2024 passenger traffic recovered to about 95% of 2019 levels, amplifying aviation bargaining power in peak tourism months. Failure to meet specs risks losing strategic accounts and long-term offtake contracts.

Regional trading alternatives
Buyers can switch to other Mediterranean refineries or import via traders, and H1 2024 saw tightened Mediterranean spot markets for gasoline, diesel and LPG that capped refinery margins. Spot liquidity provides alternatives, but proximity and lower transit times favor local supply for time-sensitive demand. Strong supply reliability and logistics execution have retained customers despite narrow price gaps.

Switching costs vary
Wholesale fuels face low switching costs; retail networks and B2B bundles raise stickiness through logistics and integrated services. Aviation and marine require certifications (ISO/CAA standards), creating moderate frictions but not insurmountable barriers. Contracts, often 1–12 month tenors in 2024, smooth volume swings but reprice frequently, leaving buyer power moderate to high.
Demand shifts and ESG criteria
Institutional buyers increasingly score suppliers on carbon intensity, biofuels and sustainability, with EU carbon prices averaging about €100/t in 2024 and global EV new‑car share reaching roughly 16% in 2024 (IEA), strengthening buyer negotiating leverage. Preference for lower‑emission fuels or electric alternatives forces Motor Oil to incur capex and reshape supply chains, or face margin squeeze and customer churn.
- Higher buyer leverage: sustainability KPIs tied to contracts
- Capex need: refinery upgrades and biofuel blending
- Risk: margin pressure and lost contracts if non‑compliant
Moderate–high buyer power; 60–80% benchmarked; EU carbon ~€100/t
Buyers (wholesale, retail, aviation, marine, industry) exert moderate–high power due to price sensitivity and commoditized fuels, with 60–80% of contracts benchmarked to Platts/ICE in 2024. Large fleets and utilities leverage scale and formula pricing; IATA passenger traffic ~95% of 2019 in 2024 boosts aviation demand. Sustainability KPIs (EU carbon ~€100/t; EV share ~16% in 2024) raise buyer leverage and capex needs.
| Metric | 2024 |
|---|---|
| Benchmark-linked contracts | 60–80% |
| IATA traffic | ~95% of 2019 |
| EU carbon price | ~€100/t |
| Global EV share (new cars) | ~16% |
| Buyer power | Moderate–High |
Same Document Delivered
Motor Oil Porter's Five Forces Analysis
This preview shows the exact Motor Oil Porter’s Five Forces analysis you'll receive immediately after purchase—no surprises, no placeholders. The document is the same professionally written, fully formatted analysis file, ready for download and use the moment you buy. You're viewing the final deliverable and will get instant access to this exact report upon payment.

Elevate Your Analysis with the Complete Porter's Five Forces Analysis
Motor Oil faces varied pressures from supplier bargaining to substitute fuels, with competitive intensity shaped by scale and regulatory risk. This snapshot highlights key vulnerabilities and strategic levers. Unlock the full Porter's Five Forces Analysis for force-by-force ratings, visuals, and actionable recommendations to inform investment or strategy.
Suppliers Bargaining Power
Concentrated crude sources
Crude supply is concentrated among a few national oil companies and trading houses—OPEC+ and majors account for roughly 40–50% of global production in 2024—giving them pricing leverage. Sanctions, OPEC+ cuts and Mediterranean geopolitical risks tighten availability of refinery-compatible grades. Motor Oil hedges, secures long‑term offtake and diversifies trading, but unit configuration limits feedstock optionality. Hedging tempers volatility but does not remove supplier power.
Logistics and maritime constraints
Sea-borne crude and product flows hinge on tanker availability, freight rates and port operations; the Suez Canal alone handles about 12% of global seaborne trade, so disruptions rapidly tighten markets. Blockages or Bosporus/port outages elevate voyage times and insurance, squeezing Motor Oil’s negotiating flexibility. Greece’s location gives route options but seasonal congestion and double-digit 2024 spot-rate volatility let suppliers pass through higher freight and insurance costs.
Specialty inputs and catalysts
Process catalysts, specialty additives and turnaround services are sourced from a concentrated global cohort — notable suppliers include BASF, Johnson Matthey, Clariant and W.R. Grace. Switching costs are high because of performance qualification and warranty exposure. Lead times commonly extend weeks to months and price pass-throughs during outages amplify vendor leverage, while framework agreements mitigate but do not eliminate supplier concentration.
Natural gas and power feedstock
Natural gas and power feedstock costs track regional hub prices and LNG availability; EU market tightness after 2022 (TTF spikes >200 €/MWh) elevated supplier power. Greece’s Revithoussa plus new FSRUs and interconnectors improved access but remain tied to EU pricing. Long-term PPAs and hedges reduced but did not eliminate exposure in 2024.
- EU TTF volatility: post-2022 surge
- Greece LNG/regas capacity improved access
- PPAs/hedges: partial price protection
Compliance and carbon costs
EU ETS allowances function as a regulated input for Motor Oil — EUA average in 2024 ~€88/t — while EU renewable fuel mandates (RED II target ~14% renewable energy in transport by 2030) push demand for bio-components; limited supply and rising carbon prices strengthen certificate and bio-component suppliers. Refiners face pass-through limits in weak demand periods, embedding structural upstream cost pressure from compliance providers.
Supply squeeze: OPEC+ 40–50%, Suez risk and €88/t EUA tighten margins
Suppliers exert above-average power: OPEC+ and majors supply ~40–50% of crude in 2024, limiting price flexibility. Freight, Suez risks (12% of seaborne trade) and tanker tightness raise logistics costs. Critical catalysts/additives and EUA prices (~€88/t in 2024) are concentrated, with long lead times and limited biofeedstocks tightening inputs.
| Metric | 2024 Value |
|---|---|
| OPEC+ share | 40–50% |
| Suez seaborne trade | ~12% |
| EU EUA avg | ~€88/t |
What is included in the product
Detailed Word Document
Provides a concise Porter’s Five Forces assessment tailored to Motor Oil, uncovering competitive intensity, buyer/supplier power, threats from new entrants and substitutes, and strategic barriers protecting incumbents, with actionable insights on emerging disruptions and profitability drivers.
Customizable Excel Spreadsheet
A concise Porter's Five Forces snapshot for Motor Oil—instantly pinpoint supplier, buyer, competitive, entrant and substitute pressures to streamline strategic decisions and prioritize mitigation actions.
Customers Bargaining Power
Diverse but price sensitive base
Customers range from wholesalers, retail networks, aviation, marine bunkering, industry and power traders; many segments are highly price sensitive with roughly 60–80% of commercial contracts benchmark-linked to Platts/ICE, limiting margin capture. Product commoditization in fuels constrains differentiation; brand and forecourt services aid retail loyalty but rarely fully prevent price-driven switching, pressuring margins in 2024 market conditions.
Large contract buyers
Large contract buyers such as airlines, shipping fleets and utilities negotiate sizable volumes under formula pricing, using scale to force tougher terms, flexible deliveries and strict quality specs. IATA reported 2024 passenger traffic recovered to about 95% of 2019 levels, amplifying aviation bargaining power in peak tourism months. Failure to meet specs risks losing strategic accounts and long-term offtake contracts.
Regional trading alternatives
Buyers can switch to other Mediterranean refineries or import via traders, and H1 2024 saw tightened Mediterranean spot markets for gasoline, diesel and LPG that capped refinery margins. Spot liquidity provides alternatives, but proximity and lower transit times favor local supply for time-sensitive demand. Strong supply reliability and logistics execution have retained customers despite narrow price gaps.
Switching costs vary
Wholesale fuels face low switching costs; retail networks and B2B bundles raise stickiness through logistics and integrated services. Aviation and marine require certifications (ISO/CAA standards), creating moderate frictions but not insurmountable barriers. Contracts, often 1–12 month tenors in 2024, smooth volume swings but reprice frequently, leaving buyer power moderate to high.
Demand shifts and ESG criteria
Institutional buyers increasingly score suppliers on carbon intensity, biofuels and sustainability, with EU carbon prices averaging about €100/t in 2024 and global EV new‑car share reaching roughly 16% in 2024 (IEA), strengthening buyer negotiating leverage. Preference for lower‑emission fuels or electric alternatives forces Motor Oil to incur capex and reshape supply chains, or face margin squeeze and customer churn.
- Higher buyer leverage: sustainability KPIs tied to contracts
- Capex need: refinery upgrades and biofuel blending
- Risk: margin pressure and lost contracts if non‑compliant
Moderate–high buyer power; 60–80% benchmarked; EU carbon ~€100/t
Buyers (wholesale, retail, aviation, marine, industry) exert moderate–high power due to price sensitivity and commoditized fuels, with 60–80% of contracts benchmarked to Platts/ICE in 2024. Large fleets and utilities leverage scale and formula pricing; IATA passenger traffic ~95% of 2019 in 2024 boosts aviation demand. Sustainability KPIs (EU carbon ~€100/t; EV share ~16% in 2024) raise buyer leverage and capex needs.
| Metric | 2024 |
|---|---|
| Benchmark-linked contracts | 60–80% |
| IATA traffic | ~95% of 2019 |
| EU carbon price | ~€100/t |
| Global EV share (new cars) | ~16% |
| Buyer power | Moderate–High |
Same Document Delivered
Motor Oil Porter's Five Forces Analysis
This preview shows the exact Motor Oil Porter’s Five Forces analysis you'll receive immediately after purchase—no surprises, no placeholders. The document is the same professionally written, fully formatted analysis file, ready for download and use the moment you buy. You're viewing the final deliverable and will get instant access to this exact report upon payment.
Description
Elevate Your Analysis with the Complete Porter's Five Forces Analysis
Motor Oil faces varied pressures from supplier bargaining to substitute fuels, with competitive intensity shaped by scale and regulatory risk. This snapshot highlights key vulnerabilities and strategic levers. Unlock the full Porter's Five Forces Analysis for force-by-force ratings, visuals, and actionable recommendations to inform investment or strategy.
Suppliers Bargaining Power
Concentrated crude sources
Crude supply is concentrated among a few national oil companies and trading houses—OPEC+ and majors account for roughly 40–50% of global production in 2024—giving them pricing leverage. Sanctions, OPEC+ cuts and Mediterranean geopolitical risks tighten availability of refinery-compatible grades. Motor Oil hedges, secures long‑term offtake and diversifies trading, but unit configuration limits feedstock optionality. Hedging tempers volatility but does not remove supplier power.
Logistics and maritime constraints
Sea-borne crude and product flows hinge on tanker availability, freight rates and port operations; the Suez Canal alone handles about 12% of global seaborne trade, so disruptions rapidly tighten markets. Blockages or Bosporus/port outages elevate voyage times and insurance, squeezing Motor Oil’s negotiating flexibility. Greece’s location gives route options but seasonal congestion and double-digit 2024 spot-rate volatility let suppliers pass through higher freight and insurance costs.
Specialty inputs and catalysts
Process catalysts, specialty additives and turnaround services are sourced from a concentrated global cohort — notable suppliers include BASF, Johnson Matthey, Clariant and W.R. Grace. Switching costs are high because of performance qualification and warranty exposure. Lead times commonly extend weeks to months and price pass-throughs during outages amplify vendor leverage, while framework agreements mitigate but do not eliminate supplier concentration.
Natural gas and power feedstock
Natural gas and power feedstock costs track regional hub prices and LNG availability; EU market tightness after 2022 (TTF spikes >200 €/MWh) elevated supplier power. Greece’s Revithoussa plus new FSRUs and interconnectors improved access but remain tied to EU pricing. Long-term PPAs and hedges reduced but did not eliminate exposure in 2024.
- EU TTF volatility: post-2022 surge
- Greece LNG/regas capacity improved access
- PPAs/hedges: partial price protection
Compliance and carbon costs
EU ETS allowances function as a regulated input for Motor Oil — EUA average in 2024 ~€88/t — while EU renewable fuel mandates (RED II target ~14% renewable energy in transport by 2030) push demand for bio-components; limited supply and rising carbon prices strengthen certificate and bio-component suppliers. Refiners face pass-through limits in weak demand periods, embedding structural upstream cost pressure from compliance providers.
Supply squeeze: OPEC+ 40–50%, Suez risk and €88/t EUA tighten margins
Suppliers exert above-average power: OPEC+ and majors supply ~40–50% of crude in 2024, limiting price flexibility. Freight, Suez risks (12% of seaborne trade) and tanker tightness raise logistics costs. Critical catalysts/additives and EUA prices (~€88/t in 2024) are concentrated, with long lead times and limited biofeedstocks tightening inputs.
| Metric | 2024 Value |
|---|---|
| OPEC+ share | 40–50% |
| Suez seaborne trade | ~12% |
| EU EUA avg | ~€88/t |
What is included in the product
Detailed Word Document
Provides a concise Porter’s Five Forces assessment tailored to Motor Oil, uncovering competitive intensity, buyer/supplier power, threats from new entrants and substitutes, and strategic barriers protecting incumbents, with actionable insights on emerging disruptions and profitability drivers.
Customizable Excel Spreadsheet
A concise Porter's Five Forces snapshot for Motor Oil—instantly pinpoint supplier, buyer, competitive, entrant and substitute pressures to streamline strategic decisions and prioritize mitigation actions.
Customers Bargaining Power
Diverse but price sensitive base
Customers range from wholesalers, retail networks, aviation, marine bunkering, industry and power traders; many segments are highly price sensitive with roughly 60–80% of commercial contracts benchmark-linked to Platts/ICE, limiting margin capture. Product commoditization in fuels constrains differentiation; brand and forecourt services aid retail loyalty but rarely fully prevent price-driven switching, pressuring margins in 2024 market conditions.
Large contract buyers
Large contract buyers such as airlines, shipping fleets and utilities negotiate sizable volumes under formula pricing, using scale to force tougher terms, flexible deliveries and strict quality specs. IATA reported 2024 passenger traffic recovered to about 95% of 2019 levels, amplifying aviation bargaining power in peak tourism months. Failure to meet specs risks losing strategic accounts and long-term offtake contracts.
Regional trading alternatives
Buyers can switch to other Mediterranean refineries or import via traders, and H1 2024 saw tightened Mediterranean spot markets for gasoline, diesel and LPG that capped refinery margins. Spot liquidity provides alternatives, but proximity and lower transit times favor local supply for time-sensitive demand. Strong supply reliability and logistics execution have retained customers despite narrow price gaps.
Switching costs vary
Wholesale fuels face low switching costs; retail networks and B2B bundles raise stickiness through logistics and integrated services. Aviation and marine require certifications (ISO/CAA standards), creating moderate frictions but not insurmountable barriers. Contracts, often 1–12 month tenors in 2024, smooth volume swings but reprice frequently, leaving buyer power moderate to high.
Demand shifts and ESG criteria
Institutional buyers increasingly score suppliers on carbon intensity, biofuels and sustainability, with EU carbon prices averaging about €100/t in 2024 and global EV new‑car share reaching roughly 16% in 2024 (IEA), strengthening buyer negotiating leverage. Preference for lower‑emission fuels or electric alternatives forces Motor Oil to incur capex and reshape supply chains, or face margin squeeze and customer churn.
- Higher buyer leverage: sustainability KPIs tied to contracts
- Capex need: refinery upgrades and biofuel blending
- Risk: margin pressure and lost contracts if non‑compliant
Moderate–high buyer power; 60–80% benchmarked; EU carbon ~€100/t
Buyers (wholesale, retail, aviation, marine, industry) exert moderate–high power due to price sensitivity and commoditized fuels, with 60–80% of contracts benchmarked to Platts/ICE in 2024. Large fleets and utilities leverage scale and formula pricing; IATA passenger traffic ~95% of 2019 in 2024 boosts aviation demand. Sustainability KPIs (EU carbon ~€100/t; EV share ~16% in 2024) raise buyer leverage and capex needs.
| Metric | 2024 |
|---|---|
| Benchmark-linked contracts | 60–80% |
| IATA traffic | ~95% of 2019 |
| EU carbon price | ~€100/t |
| Global EV share (new cars) | ~16% |
| Buyer power | Moderate–High |
Same Document Delivered
Motor Oil Porter's Five Forces Analysis
This preview shows the exact Motor Oil Porter’s Five Forces analysis you'll receive immediately after purchase—no surprises, no placeholders. The document is the same professionally written, fully formatted analysis file, ready for download and use the moment you buy. You're viewing the final deliverable and will get instant access to this exact report upon payment.











