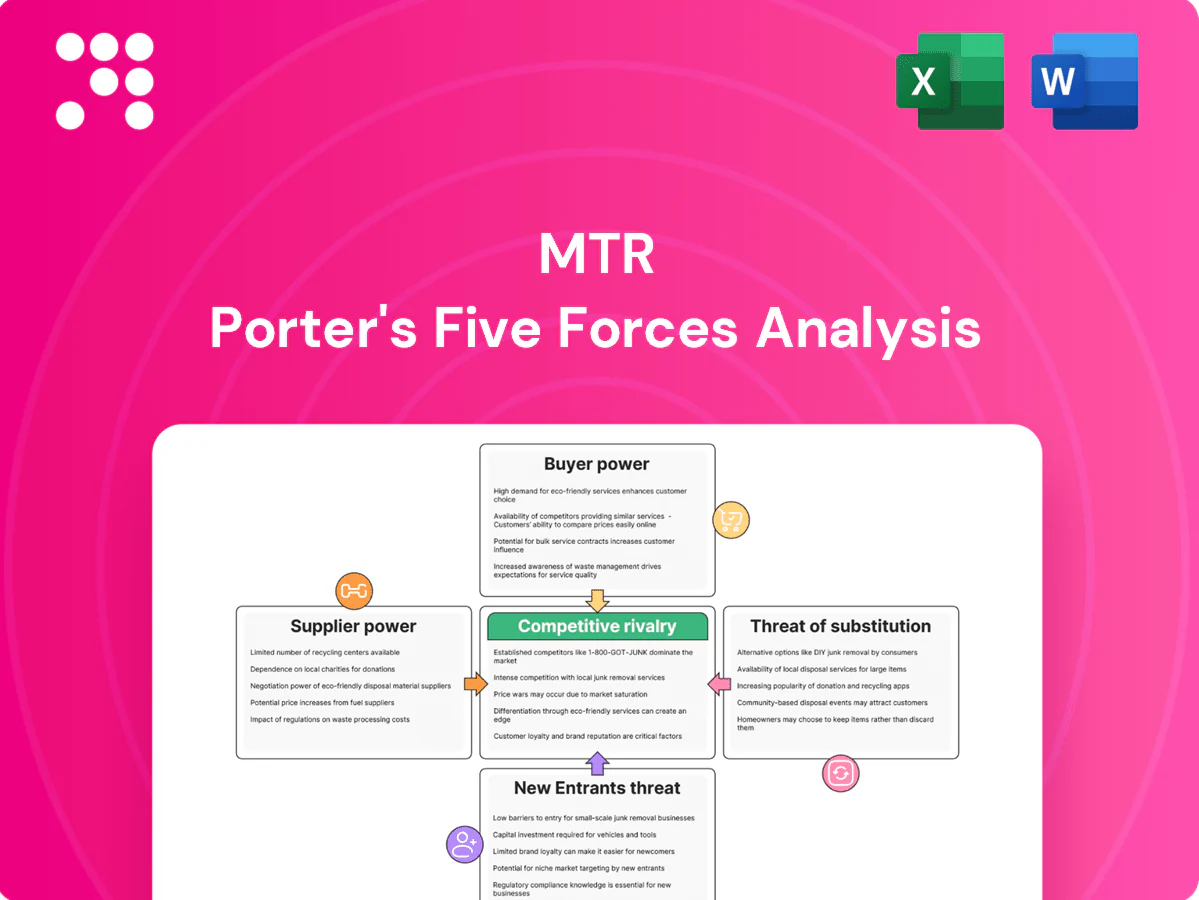
MTR Porter's Five Forces Analysis

Elevate Your Analysis with the Complete Porter's Five Forces Analysis
MTR faces moderate buyer power, strong regulator-driven barriers to entry, intense rivalry in urban transit, manageable supplier leverage, and growing substitute threats from mobility tech. This snapshot hints at strategic pressures—unlock the full Porter's Five Forces Analysis for force ratings, visuals, and actionable recommendations.
Suppliers Bargaining Power

Concentrated rail OEMs and signaling vendors
Rolling stock, signalling and platform systems are concentrated among a few global suppliers (CRRC, Siemens Mobility, Alstom, Thales, Hitachi), with CRRC estimated to account for roughly 40% of global rolling-stock output in 2023, giving suppliers strong pricing leverage. Vendor lock-in from compatibility and certification requirements raises switching costs, often compounded by safety re-approvals taking months. High switching costs and long replacement lead times—commonly 24–36 months for trains and 18–30 months for signalling—further tilt bargaining power to suppliers.
Electricity and energy dependence
MTR depends on two vertically integrated electricity suppliers in Hong Kong, CLP and HK Electric, which together create an approximate 80/20 service split across the territory. This concentration makes energy costs and reliability critical, with tariff adjustments in 2024 able to compress operating margins. Limited substitution options constrain MTRs negotiating power, though multi-year supply agreements and demand-management measures partially mitigate price volatility and supply risk.

Specialized maintenance parts and lifecycle services
Proprietary spares and software updates are predominantly controlled by OEMs, with industry estimates showing 60–80% OEM-exclusive parts. Lifecycle maintenance contracts often embed 2–4% annual pricing escalators. Technical IP limits third-party alternatives to ~10–20%. Forecasting and inventory strategies can cut stockouts by ~30% but dependency persists.

Construction contractors and materials for property
Skilled engineering and digital talent
Skilled signal engineers, cybersecurity and data specialists are scarce, with ISC2 reporting a 2024 global cybersecurity workforce gap of 3.4 million; wage inflation and retention pressures have raised labor supplier power for MTR. Immigration controls and limited training pipelines constrain availability, while targeted university partnerships and apprenticeships can ease hiring pressure and lower turnover.
- Signal engineers: limited supply
- Cybersecurity gap: 3.4 million (ISC2 2024)
- Wage inflation and retention risk
- Immigration/training affect availability
- Partnerships/apprenticeships mitigate pressure
High supplier concentration: CRRC ~40%, OEM parts 60-80%; power split & 3.4M skills gap
Supplier concentration is high: CRRC ~40% rolling-stock output (2023) and top OEMs control 60–80% of spare parts, giving pricing leverage and 24–36 month lead times. Power markets split CLP/HK Electric ~80/20, exposing MTR to tariff risk. Skilled labour tightness (ISC2 cybersecurity gap 3.4M in 2024) raises wage pressure and retention costs.
| Supplier | Metric | Value |
|---|---|---|
| CRRC | Market share (rolling stock) | ~40% (2023) |
| OEM parts | Exclusive share | 60–80% |
| Power providers | Territory split | CLP/HK Electric ~80/20 |
| Cybersecurity | Global workforce gap | 3.4M (2024) |
What is included in the product
 Detailed Word Document
Tailored Porter's Five Forces analysis for MTR uncovering competitive intensity, supplier and buyer power, threat of new entrants and substitutes, and strategic barriers that protect or expose its profitability.

 Customizable Excel Spreadsheet
A concise, one-sheet Porter’s Five Forces for MTR—instantly maps competitive pressures and regulatory risks for faster, clearer strategic decisions.
Customers Bargaining Power

Mass commuter base with limited individual leverage
Millions of riders—more than 4 million daily in 2024—have low individual bargaining power, but aggregated sentiment can trigger brand and policy scrutiny. Switching to buses or taxis is feasible yet often slower or more expensive, reducing churn. High reliability and frequent headways further lower customers’ propensity to switch.
Government and regulator fare mechanisms
Fare adjustments under MTR are governed by a formal Fare Adjustment Mechanism tying permitted changes to published inflation and wage indices, concentrating buyer power with government and regulators. Political scrutiny and public opinion in 2024 continue to cap pricing flexibility and force cautious proposals. Service performance is contract-linked to penalties and incentives, and ongoing stakeholder dialogue shapes acceptable fare paths.

Property buyers, tenants, and retailers
Property buyers, tenants, and retailers benchmark MTR’s mixed-use developments against other developers, with station-adjacent units typically commanding a documented 10–20% location premium that supports MTR’s pricing power. Anchor tenants can negotiate bespoke lease terms and step rents, influencing headline yields on retail portfolios. During downturns tenant bargaining rises, and in recovery phases MTR benefits from stronger sales velocity and rent growth. Recent Hong Kong transit-oriented premiums underpin resilient demand.

Advertising and corporate clients
Overseas transport authorities (concessions)
Overseas transport authorities set strict KPI and payment terms in concessions, and competitive bidding lets buyers squeeze operator margins; contract renewals increasingly hinge on measurable performance and local political shifts, while risk-sharing clauses transfer throughput and cost volatility to operators.
- Stringent KPIs drive penalties and bonus structures
- Competitive tenders compress operator margins
- Renewals depend on performance and politics
- Risk-sharing shifts cost exposure to operators
4m+ daily riders keep transit fares constrained while station proximity boosts property premiums
Millions of riders (over 4m daily in 2024) have low individual power but collective scrutiny limits fare moves; switching modes is feasible but often costlier or slower. Fare Adjustment Mechanism (CPI/wage-linked) and regulators constrain pricing. Property adjacencies command 10–20% premiums, boosting MTR’s retail/development leverage. Concession KPIs and tenders shift bargaining to authorities.
| Metric | 2024 |
|---|---|
| Daily riders | 4m+ |
| Pre-COVID (2019) | 5.65m |
| Station premium | 10–20% |
Preview the Actual Deliverable
MTR Porter's Five Forces Analysis
This MTR Porter's Five Forces Analysis preview is the exact, fully formatted document you'll receive immediately after purchase. It contains the complete competitive assessment, ready for download and use with no placeholders or mockups. What you see here is the final deliverable—no setup or customization required.

Elevate Your Analysis with the Complete Porter's Five Forces Analysis
MTR faces moderate buyer power, strong regulator-driven barriers to entry, intense rivalry in urban transit, manageable supplier leverage, and growing substitute threats from mobility tech. This snapshot hints at strategic pressures—unlock the full Porter's Five Forces Analysis for force ratings, visuals, and actionable recommendations.
Suppliers Bargaining Power
Concentrated rail OEMs and signaling vendors
Rolling stock, signalling and platform systems are concentrated among a few global suppliers (CRRC, Siemens Mobility, Alstom, Thales, Hitachi), with CRRC estimated to account for roughly 40% of global rolling-stock output in 2023, giving suppliers strong pricing leverage. Vendor lock-in from compatibility and certification requirements raises switching costs, often compounded by safety re-approvals taking months. High switching costs and long replacement lead times—commonly 24–36 months for trains and 18–30 months for signalling—further tilt bargaining power to suppliers.
Electricity and energy dependence
MTR depends on two vertically integrated electricity suppliers in Hong Kong, CLP and HK Electric, which together create an approximate 80/20 service split across the territory. This concentration makes energy costs and reliability critical, with tariff adjustments in 2024 able to compress operating margins. Limited substitution options constrain MTRs negotiating power, though multi-year supply agreements and demand-management measures partially mitigate price volatility and supply risk.
Specialized maintenance parts and lifecycle services
Proprietary spares and software updates are predominantly controlled by OEMs, with industry estimates showing 60–80% OEM-exclusive parts. Lifecycle maintenance contracts often embed 2–4% annual pricing escalators. Technical IP limits third-party alternatives to ~10–20%. Forecasting and inventory strategies can cut stockouts by ~30% but dependency persists.
Construction contractors and materials for property
Skilled engineering and digital talent
Skilled signal engineers, cybersecurity and data specialists are scarce, with ISC2 reporting a 2024 global cybersecurity workforce gap of 3.4 million; wage inflation and retention pressures have raised labor supplier power for MTR. Immigration controls and limited training pipelines constrain availability, while targeted university partnerships and apprenticeships can ease hiring pressure and lower turnover.
- Signal engineers: limited supply
- Cybersecurity gap: 3.4 million (ISC2 2024)
- Wage inflation and retention risk
- Immigration/training affect availability
- Partnerships/apprenticeships mitigate pressure
High supplier concentration: CRRC ~40%, OEM parts 60-80%; power split & 3.4M skills gap
Supplier concentration is high: CRRC ~40% rolling-stock output (2023) and top OEMs control 60–80% of spare parts, giving pricing leverage and 24–36 month lead times. Power markets split CLP/HK Electric ~80/20, exposing MTR to tariff risk. Skilled labour tightness (ISC2 cybersecurity gap 3.4M in 2024) raises wage pressure and retention costs.
| Supplier | Metric | Value |
|---|---|---|
| CRRC | Market share (rolling stock) | ~40% (2023) |
| OEM parts | Exclusive share | 60–80% |
| Power providers | Territory split | CLP/HK Electric ~80/20 |
| Cybersecurity | Global workforce gap | 3.4M (2024) |
What is included in the product
Detailed Word Document
Tailored Porter's Five Forces analysis for MTR uncovering competitive intensity, supplier and buyer power, threat of new entrants and substitutes, and strategic barriers that protect or expose its profitability.
Customizable Excel Spreadsheet
A concise, one-sheet Porter’s Five Forces for MTR—instantly maps competitive pressures and regulatory risks for faster, clearer strategic decisions.
Customers Bargaining Power
Mass commuter base with limited individual leverage
Millions of riders—more than 4 million daily in 2024—have low individual bargaining power, but aggregated sentiment can trigger brand and policy scrutiny. Switching to buses or taxis is feasible yet often slower or more expensive, reducing churn. High reliability and frequent headways further lower customers’ propensity to switch.
Government and regulator fare mechanisms
Fare adjustments under MTR are governed by a formal Fare Adjustment Mechanism tying permitted changes to published inflation and wage indices, concentrating buyer power with government and regulators. Political scrutiny and public opinion in 2024 continue to cap pricing flexibility and force cautious proposals. Service performance is contract-linked to penalties and incentives, and ongoing stakeholder dialogue shapes acceptable fare paths.
Property buyers, tenants, and retailers
Property buyers, tenants, and retailers benchmark MTR’s mixed-use developments against other developers, with station-adjacent units typically commanding a documented 10–20% location premium that supports MTR’s pricing power. Anchor tenants can negotiate bespoke lease terms and step rents, influencing headline yields on retail portfolios. During downturns tenant bargaining rises, and in recovery phases MTR benefits from stronger sales velocity and rent growth. Recent Hong Kong transit-oriented premiums underpin resilient demand.
Advertising and corporate clients
Overseas transport authorities (concessions)
Overseas transport authorities set strict KPI and payment terms in concessions, and competitive bidding lets buyers squeeze operator margins; contract renewals increasingly hinge on measurable performance and local political shifts, while risk-sharing clauses transfer throughput and cost volatility to operators.
- Stringent KPIs drive penalties and bonus structures
- Competitive tenders compress operator margins
- Renewals depend on performance and politics
- Risk-sharing shifts cost exposure to operators
4m+ daily riders keep transit fares constrained while station proximity boosts property premiums
Millions of riders (over 4m daily in 2024) have low individual power but collective scrutiny limits fare moves; switching modes is feasible but often costlier or slower. Fare Adjustment Mechanism (CPI/wage-linked) and regulators constrain pricing. Property adjacencies command 10–20% premiums, boosting MTR’s retail/development leverage. Concession KPIs and tenders shift bargaining to authorities.
| Metric | 2024 |
|---|---|
| Daily riders | 4m+ |
| Pre-COVID (2019) | 5.65m |
| Station premium | 10–20% |
Preview the Actual Deliverable
MTR Porter's Five Forces Analysis
This MTR Porter's Five Forces Analysis preview is the exact, fully formatted document you'll receive immediately after purchase. It contains the complete competitive assessment, ready for download and use with no placeholders or mockups. What you see here is the final deliverable—no setup or customization required.
Description
Elevate Your Analysis with the Complete Porter's Five Forces Analysis
MTR faces moderate buyer power, strong regulator-driven barriers to entry, intense rivalry in urban transit, manageable supplier leverage, and growing substitute threats from mobility tech. This snapshot hints at strategic pressures—unlock the full Porter's Five Forces Analysis for force ratings, visuals, and actionable recommendations.
Suppliers Bargaining Power
Concentrated rail OEMs and signaling vendors
Rolling stock, signalling and platform systems are concentrated among a few global suppliers (CRRC, Siemens Mobility, Alstom, Thales, Hitachi), with CRRC estimated to account for roughly 40% of global rolling-stock output in 2023, giving suppliers strong pricing leverage. Vendor lock-in from compatibility and certification requirements raises switching costs, often compounded by safety re-approvals taking months. High switching costs and long replacement lead times—commonly 24–36 months for trains and 18–30 months for signalling—further tilt bargaining power to suppliers.
Electricity and energy dependence
MTR depends on two vertically integrated electricity suppliers in Hong Kong, CLP and HK Electric, which together create an approximate 80/20 service split across the territory. This concentration makes energy costs and reliability critical, with tariff adjustments in 2024 able to compress operating margins. Limited substitution options constrain MTRs negotiating power, though multi-year supply agreements and demand-management measures partially mitigate price volatility and supply risk.
Specialized maintenance parts and lifecycle services
Proprietary spares and software updates are predominantly controlled by OEMs, with industry estimates showing 60–80% OEM-exclusive parts. Lifecycle maintenance contracts often embed 2–4% annual pricing escalators. Technical IP limits third-party alternatives to ~10–20%. Forecasting and inventory strategies can cut stockouts by ~30% but dependency persists.
Construction contractors and materials for property
Skilled engineering and digital talent
Skilled signal engineers, cybersecurity and data specialists are scarce, with ISC2 reporting a 2024 global cybersecurity workforce gap of 3.4 million; wage inflation and retention pressures have raised labor supplier power for MTR. Immigration controls and limited training pipelines constrain availability, while targeted university partnerships and apprenticeships can ease hiring pressure and lower turnover.
- Signal engineers: limited supply
- Cybersecurity gap: 3.4 million (ISC2 2024)
- Wage inflation and retention risk
- Immigration/training affect availability
- Partnerships/apprenticeships mitigate pressure
High supplier concentration: CRRC ~40%, OEM parts 60-80%; power split & 3.4M skills gap
Supplier concentration is high: CRRC ~40% rolling-stock output (2023) and top OEMs control 60–80% of spare parts, giving pricing leverage and 24–36 month lead times. Power markets split CLP/HK Electric ~80/20, exposing MTR to tariff risk. Skilled labour tightness (ISC2 cybersecurity gap 3.4M in 2024) raises wage pressure and retention costs.
| Supplier | Metric | Value |
|---|---|---|
| CRRC | Market share (rolling stock) | ~40% (2023) |
| OEM parts | Exclusive share | 60–80% |
| Power providers | Territory split | CLP/HK Electric ~80/20 |
| Cybersecurity | Global workforce gap | 3.4M (2024) |
What is included in the product
Detailed Word Document
Tailored Porter's Five Forces analysis for MTR uncovering competitive intensity, supplier and buyer power, threat of new entrants and substitutes, and strategic barriers that protect or expose its profitability.
Customizable Excel Spreadsheet
A concise, one-sheet Porter’s Five Forces for MTR—instantly maps competitive pressures and regulatory risks for faster, clearer strategic decisions.
Customers Bargaining Power
Mass commuter base with limited individual leverage
Millions of riders—more than 4 million daily in 2024—have low individual bargaining power, but aggregated sentiment can trigger brand and policy scrutiny. Switching to buses or taxis is feasible yet often slower or more expensive, reducing churn. High reliability and frequent headways further lower customers’ propensity to switch.
Government and regulator fare mechanisms
Fare adjustments under MTR are governed by a formal Fare Adjustment Mechanism tying permitted changes to published inflation and wage indices, concentrating buyer power with government and regulators. Political scrutiny and public opinion in 2024 continue to cap pricing flexibility and force cautious proposals. Service performance is contract-linked to penalties and incentives, and ongoing stakeholder dialogue shapes acceptable fare paths.
Property buyers, tenants, and retailers
Property buyers, tenants, and retailers benchmark MTR’s mixed-use developments against other developers, with station-adjacent units typically commanding a documented 10–20% location premium that supports MTR’s pricing power. Anchor tenants can negotiate bespoke lease terms and step rents, influencing headline yields on retail portfolios. During downturns tenant bargaining rises, and in recovery phases MTR benefits from stronger sales velocity and rent growth. Recent Hong Kong transit-oriented premiums underpin resilient demand.
Advertising and corporate clients
Overseas transport authorities (concessions)
Overseas transport authorities set strict KPI and payment terms in concessions, and competitive bidding lets buyers squeeze operator margins; contract renewals increasingly hinge on measurable performance and local political shifts, while risk-sharing clauses transfer throughput and cost volatility to operators.
- Stringent KPIs drive penalties and bonus structures
- Competitive tenders compress operator margins
- Renewals depend on performance and politics
- Risk-sharing shifts cost exposure to operators
4m+ daily riders keep transit fares constrained while station proximity boosts property premiums
Millions of riders (over 4m daily in 2024) have low individual power but collective scrutiny limits fare moves; switching modes is feasible but often costlier or slower. Fare Adjustment Mechanism (CPI/wage-linked) and regulators constrain pricing. Property adjacencies command 10–20% premiums, boosting MTR’s retail/development leverage. Concession KPIs and tenders shift bargaining to authorities.
| Metric | 2024 |
|---|---|
| Daily riders | 4m+ |
| Pre-COVID (2019) | 5.65m |
| Station premium | 10–20% |
Preview the Actual Deliverable
MTR Porter's Five Forces Analysis
This MTR Porter's Five Forces Analysis preview is the exact, fully formatted document you'll receive immediately after purchase. It contains the complete competitive assessment, ready for download and use with no placeholders or mockups. What you see here is the final deliverable—no setup or customization required.











