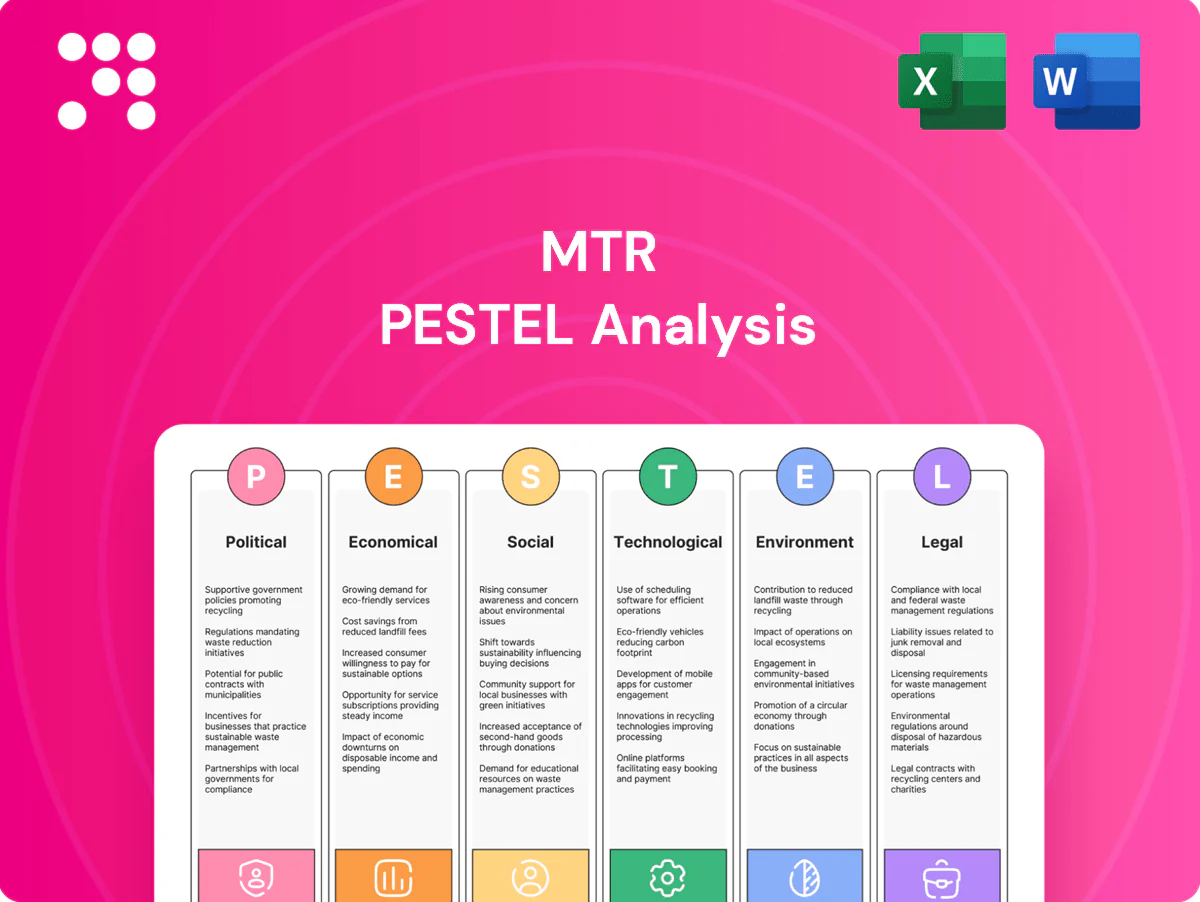
MTR PESTLE Analysis

Skip the Research. Get the Strategy.
Unlock strategic clarity with our PESTLE Analysis of MTR—three to five expert-level lenses revealing how politics, economy, society, technology, law and environment shape its future. Ideal for investors and strategists, this concise briefing highlights risks and opportunities you can act on now. Buy the full, editable report to get the complete, actionable breakdown instantly.
Political factors

Government ownership & policy
MTR’s largest shareholder is the HKSAR Government (about 75%), aligning corporate strategy with public policy priorities.
This can ease project approvals but increases scrutiny and political accountability, evident in heightened oversight since 2019.
Policy shifts on urban planning, housing and transport integration directly influence rail and property pipelines, where property remains a major earnings driver.
Alignment with Mainland initiatives such as the Greater Bay Area (population ~86 million) shapes expansion decisions.
Fare regulation & public expectations
Fare Adjustment Mechanism decisions directly affect MTR revenue visibility and social licence; ridership recovered to about 85% of 2019 levels by 2023, so fare moves have amplified financial impact. Political pressure to keep fares affordable can compress margins amid rising operating costs and inflation. High-profile service incidents have previously triggered policy reviews and fines, while transparent stakeholder engagement reduces reputational and regulatory backlash.

Cross-border & mainland engagement
Operations and JV projects in Mainland China are exposed to shifting central and provincial priorities, affecting approvals and land-use for projects such as the West Kowloon high-speed rail co-location arrangement initiated in 2018. Bilateral arrangements on cross-border rail (eg immigration facilities) require sustained political coordination across jurisdictions. Policy harmonization affects standards, staffing and security protocols, while geopolitical tensions can alter procurement and financing terms.

Infrastructure funding & land policies
The Rail-plus-Property model depends on land grants, planning permission and rezoning; shifts in land premium policy or revised housing targets materially change project IRRs and cashflows. Government capex timing dictates when new lines/extensions become viable; public consultation outcomes can alter station siting and development density. Hong Kong population ~7.4m (2024 est) shapes housing demand.
- Land grants/rezoning
- Land premium & housing targets
- Government capex timing
- Public consultation impact
Public accountability & governance
High visibility as a critical utility (MTR served over 5 million daily riders pre‑COVID in 2019) invites legislative oversight and audits; incidents often trigger board-level scrutiny and leadership changes. Rising ESG expectations—global sustainable investment reached US$35.3tn in 2020—drive greater disclosure and stakeholder engagement, while strong governance limits politicization of operations.
- Legislative oversight: high public profile
- Incident risk: board scrutiny/leadership turnover
- ESG pressure: increased disclosures
- Governance: buffer against politicization
HKSAR majority ownership (~75%) shifts rail+property strategy; ridership ~85% of 2019
HKSAR holds ~75% of MTR, aligning strategy with public policy and increasing oversight since 2019. Policy shifts on land grants, housing targets and Govt capex directly reshape the Rail‑plus‑Property pipeline; HK population ~7.4m (2024). Ridership ~85% of 2019 by 2023 amplifies fare/political sensitivity. GBA links (pop ~86m) guide expansion and cross‑border coordination.
| Metric | Value |
|---|---|
| Govt ownership | ~75% |
| HK pop (2024) | 7.4m |
| GBA pop | ~86m |
| Ridership vs 2019 (2023) | ~85% |
What is included in the product
 Detailed Word Document
Explores how macro-environmental factors uniquely affect MTR across Political, Economic, Social, Technological, Environmental, and Legal dimensions, with data-backed, forward-looking insights tailored to regional market and regulatory dynamics to support executives, investors and strategists in scenario planning, risk mitigation and opportunity identification.

 Customizable Excel Spreadsheet
A concise, visually segmented PESTLE summary tailored to MTR that enables quick interpretation, easy note-taking and sharing across teams, and is ready to drop into presentations to streamline external-risk discussions and strategic planning.
Economic factors

HK macro cycle & ridership
Ridership closely tracks employment, retail sales and tourism—MTR patronage recovered to c.85% of 2019 levels by 2024 while visitor arrivals rebounded to around 18–20 million in 2023–24, boosting fare revenue. Economic slowdowns compress fares but leave high fixed costs intact, squeezing margins. Recovery cycles and mega-events (e.g., trade fairs) drive sharp volume spikes; elasticity varies by line, peak vs off-peak and cross-border corridors.
Property market cyclicality
Development profits hinge on Hong Kong’s volatile property prices, which remain about 15% below the 2021 peak as of mid‑2025, and on absorption rates that have slowed in core districts. Interest rates and HIBOR levels (3‑month around 2–2.5% mid‑2025) raise financing costs and squeeze buyer affordability. Inventory timing and presales—often funding 30–50% of project costs—are critical to cash flow, while weak markets delay launches or force unit‑mix shifts.

Inflation, wages & materials
Operating and maintenance costs rise with wage inflation (Hong Kong wages up ~3–5% in 2024–H1 2025) and spare‑part price increases; construction inputs such as steel and cement swung roughly ±10–20% across 2023–2024, pushing project budgets. Long‑dated contracts need CPI/WPI escalation clauses to manage volatility. Productivity gains and procurement scale (typical savings 2–6%) partially offset cost pressures.

Currency & overseas exposure
Revenues and costs from Australia, Mainland China and Europe expose MTR to FX risk; 2024 CPI was about 3.3% in Australia, 0.3% in China and 2.4% in the eurozone, each affecting fare growth and operating costs. Hedging programs (currency forwards/options) materially affect reported earnings volatility and timing of cash flows. Local labor markets and inflation drive concession profitability, while geographic diversification smooths demand cycles but increases treasury and operational complexity.
- FX exposure: multi-currency revenues/costs
- Inflation: AUS 3.3%, CHN 0.3%, EZ 2.4% (2024)
- Hedging: impacts earnings timing and cash flows
- Diversification: stabilizes revenue, ups complexity
Tourism & retail ecosystems
Station retail, advertising and airport-linked routes scale with visitor arrivals—Hong Kong saw about 18.1 million inbound visitors in 2023, boosting MTR non-fare income from retail and advertising and strengthening airport express yields as HKIA recovered capacity to roughly 47 million passengers in 2023. Mainland visitor mix shifts and lower per-capita spending compress non-fare margins, while airline schedule volatility affects demand on specific lines. Strategic retailer partnerships (revenue-sharing, pop-ups) can stabilize ancillary revenue streams.
- Station retail: reliant on visitors; 2023 arrivals ~18.1m
- Airport routes: tied to HKIA ~47m pax (2023)
- Mainland mix: alters per-visitor spend, hits non-fare income
- Retail partnerships: stabilize ancillary revenue
HKSAR majority ownership (~75%) shifts rail+property strategy; ridership ~85% of 2019
Ridership ~85% of 2019 by 2024; visitors ~18–20m in 2023–24 boosting fares/non‑fare income. Property values ~15% below 2021 peak (mid‑2025); 3‑month HIBOR ~2–2.5% (mid‑2025) pressuring financing; wages +3–5% (2024–H1 2025) lift O&M costs; HKIA ~47m pax (2023) supports airport routes.
| Metric | Value |
|---|---|
| Ridership | ~85% of 2019 (2024) |
| Visitors | 18–20m (2023–24) |
| Property gap | ~−15% vs 2021 (mid‑2025) |
| 3m HIBOR | 2–2.5% (mid‑2025) |
| Wage growth | +3–5% (2024–H1 2025) |
| HKIA pax | ~47m (2023) |
Preview the Actual Deliverable
MTR PESTLE Analysis
The MTR PESTLE Analysis preview shown here is the exact document you’ll receive after purchase—fully formatted and ready to use. The layout, content, and structure visible are the final version with no placeholders or teasers. You’ll be able to download and apply this professionally structured file immediately after checkout.

Skip the Research. Get the Strategy.
Unlock strategic clarity with our PESTLE Analysis of MTR—three to five expert-level lenses revealing how politics, economy, society, technology, law and environment shape its future. Ideal for investors and strategists, this concise briefing highlights risks and opportunities you can act on now. Buy the full, editable report to get the complete, actionable breakdown instantly.
Political factors
Government ownership & policy
MTR’s largest shareholder is the HKSAR Government (about 75%), aligning corporate strategy with public policy priorities.
This can ease project approvals but increases scrutiny and political accountability, evident in heightened oversight since 2019.
Policy shifts on urban planning, housing and transport integration directly influence rail and property pipelines, where property remains a major earnings driver.
Alignment with Mainland initiatives such as the Greater Bay Area (population ~86 million) shapes expansion decisions.
Fare regulation & public expectations
Fare Adjustment Mechanism decisions directly affect MTR revenue visibility and social licence; ridership recovered to about 85% of 2019 levels by 2023, so fare moves have amplified financial impact. Political pressure to keep fares affordable can compress margins amid rising operating costs and inflation. High-profile service incidents have previously triggered policy reviews and fines, while transparent stakeholder engagement reduces reputational and regulatory backlash.
Cross-border & mainland engagement
Operations and JV projects in Mainland China are exposed to shifting central and provincial priorities, affecting approvals and land-use for projects such as the West Kowloon high-speed rail co-location arrangement initiated in 2018. Bilateral arrangements on cross-border rail (eg immigration facilities) require sustained political coordination across jurisdictions. Policy harmonization affects standards, staffing and security protocols, while geopolitical tensions can alter procurement and financing terms.
Infrastructure funding & land policies
The Rail-plus-Property model depends on land grants, planning permission and rezoning; shifts in land premium policy or revised housing targets materially change project IRRs and cashflows. Government capex timing dictates when new lines/extensions become viable; public consultation outcomes can alter station siting and development density. Hong Kong population ~7.4m (2024 est) shapes housing demand.
- Land grants/rezoning
- Land premium & housing targets
- Government capex timing
- Public consultation impact
Public accountability & governance
High visibility as a critical utility (MTR served over 5 million daily riders pre‑COVID in 2019) invites legislative oversight and audits; incidents often trigger board-level scrutiny and leadership changes. Rising ESG expectations—global sustainable investment reached US$35.3tn in 2020—drive greater disclosure and stakeholder engagement, while strong governance limits politicization of operations.
- Legislative oversight: high public profile
- Incident risk: board scrutiny/leadership turnover
- ESG pressure: increased disclosures
- Governance: buffer against politicization
HKSAR majority ownership (~75%) shifts rail+property strategy; ridership ~85% of 2019
HKSAR holds ~75% of MTR, aligning strategy with public policy and increasing oversight since 2019. Policy shifts on land grants, housing targets and Govt capex directly reshape the Rail‑plus‑Property pipeline; HK population ~7.4m (2024). Ridership ~85% of 2019 by 2023 amplifies fare/political sensitivity. GBA links (pop ~86m) guide expansion and cross‑border coordination.
| Metric | Value |
|---|---|
| Govt ownership | ~75% |
| HK pop (2024) | 7.4m |
| GBA pop | ~86m |
| Ridership vs 2019 (2023) | ~85% |
What is included in the product
Detailed Word Document
Explores how macro-environmental factors uniquely affect MTR across Political, Economic, Social, Technological, Environmental, and Legal dimensions, with data-backed, forward-looking insights tailored to regional market and regulatory dynamics to support executives, investors and strategists in scenario planning, risk mitigation and opportunity identification.
Customizable Excel Spreadsheet
A concise, visually segmented PESTLE summary tailored to MTR that enables quick interpretation, easy note-taking and sharing across teams, and is ready to drop into presentations to streamline external-risk discussions and strategic planning.
Economic factors
HK macro cycle & ridership
Ridership closely tracks employment, retail sales and tourism—MTR patronage recovered to c.85% of 2019 levels by 2024 while visitor arrivals rebounded to around 18–20 million in 2023–24, boosting fare revenue. Economic slowdowns compress fares but leave high fixed costs intact, squeezing margins. Recovery cycles and mega-events (e.g., trade fairs) drive sharp volume spikes; elasticity varies by line, peak vs off-peak and cross-border corridors.
Property market cyclicality
Development profits hinge on Hong Kong’s volatile property prices, which remain about 15% below the 2021 peak as of mid‑2025, and on absorption rates that have slowed in core districts. Interest rates and HIBOR levels (3‑month around 2–2.5% mid‑2025) raise financing costs and squeeze buyer affordability. Inventory timing and presales—often funding 30–50% of project costs—are critical to cash flow, while weak markets delay launches or force unit‑mix shifts.
Inflation, wages & materials
Operating and maintenance costs rise with wage inflation (Hong Kong wages up ~3–5% in 2024–H1 2025) and spare‑part price increases; construction inputs such as steel and cement swung roughly ±10–20% across 2023–2024, pushing project budgets. Long‑dated contracts need CPI/WPI escalation clauses to manage volatility. Productivity gains and procurement scale (typical savings 2–6%) partially offset cost pressures.
Currency & overseas exposure
Revenues and costs from Australia, Mainland China and Europe expose MTR to FX risk; 2024 CPI was about 3.3% in Australia, 0.3% in China and 2.4% in the eurozone, each affecting fare growth and operating costs. Hedging programs (currency forwards/options) materially affect reported earnings volatility and timing of cash flows. Local labor markets and inflation drive concession profitability, while geographic diversification smooths demand cycles but increases treasury and operational complexity.
- FX exposure: multi-currency revenues/costs
- Inflation: AUS 3.3%, CHN 0.3%, EZ 2.4% (2024)
- Hedging: impacts earnings timing and cash flows
- Diversification: stabilizes revenue, ups complexity
Tourism & retail ecosystems
Station retail, advertising and airport-linked routes scale with visitor arrivals—Hong Kong saw about 18.1 million inbound visitors in 2023, boosting MTR non-fare income from retail and advertising and strengthening airport express yields as HKIA recovered capacity to roughly 47 million passengers in 2023. Mainland visitor mix shifts and lower per-capita spending compress non-fare margins, while airline schedule volatility affects demand on specific lines. Strategic retailer partnerships (revenue-sharing, pop-ups) can stabilize ancillary revenue streams.
- Station retail: reliant on visitors; 2023 arrivals ~18.1m
- Airport routes: tied to HKIA ~47m pax (2023)
- Mainland mix: alters per-visitor spend, hits non-fare income
- Retail partnerships: stabilize ancillary revenue
HKSAR majority ownership (~75%) shifts rail+property strategy; ridership ~85% of 2019
Ridership ~85% of 2019 by 2024; visitors ~18–20m in 2023–24 boosting fares/non‑fare income. Property values ~15% below 2021 peak (mid‑2025); 3‑month HIBOR ~2–2.5% (mid‑2025) pressuring financing; wages +3–5% (2024–H1 2025) lift O&M costs; HKIA ~47m pax (2023) supports airport routes.
| Metric | Value |
|---|---|
| Ridership | ~85% of 2019 (2024) |
| Visitors | 18–20m (2023–24) |
| Property gap | ~−15% vs 2021 (mid‑2025) |
| 3m HIBOR | 2–2.5% (mid‑2025) |
| Wage growth | +3–5% (2024–H1 2025) |
| HKIA pax | ~47m (2023) |
Preview the Actual Deliverable
MTR PESTLE Analysis
The MTR PESTLE Analysis preview shown here is the exact document you’ll receive after purchase—fully formatted and ready to use. The layout, content, and structure visible are the final version with no placeholders or teasers. You’ll be able to download and apply this professionally structured file immediately after checkout.
Original: $10.00
-65%$10.00
$3.50Description
Skip the Research. Get the Strategy.
Unlock strategic clarity with our PESTLE Analysis of MTR—three to five expert-level lenses revealing how politics, economy, society, technology, law and environment shape its future. Ideal for investors and strategists, this concise briefing highlights risks and opportunities you can act on now. Buy the full, editable report to get the complete, actionable breakdown instantly.
Political factors
Government ownership & policy
MTR’s largest shareholder is the HKSAR Government (about 75%), aligning corporate strategy with public policy priorities.
This can ease project approvals but increases scrutiny and political accountability, evident in heightened oversight since 2019.
Policy shifts on urban planning, housing and transport integration directly influence rail and property pipelines, where property remains a major earnings driver.
Alignment with Mainland initiatives such as the Greater Bay Area (population ~86 million) shapes expansion decisions.
Fare regulation & public expectations
Fare Adjustment Mechanism decisions directly affect MTR revenue visibility and social licence; ridership recovered to about 85% of 2019 levels by 2023, so fare moves have amplified financial impact. Political pressure to keep fares affordable can compress margins amid rising operating costs and inflation. High-profile service incidents have previously triggered policy reviews and fines, while transparent stakeholder engagement reduces reputational and regulatory backlash.
Cross-border & mainland engagement
Operations and JV projects in Mainland China are exposed to shifting central and provincial priorities, affecting approvals and land-use for projects such as the West Kowloon high-speed rail co-location arrangement initiated in 2018. Bilateral arrangements on cross-border rail (eg immigration facilities) require sustained political coordination across jurisdictions. Policy harmonization affects standards, staffing and security protocols, while geopolitical tensions can alter procurement and financing terms.
Infrastructure funding & land policies
The Rail-plus-Property model depends on land grants, planning permission and rezoning; shifts in land premium policy or revised housing targets materially change project IRRs and cashflows. Government capex timing dictates when new lines/extensions become viable; public consultation outcomes can alter station siting and development density. Hong Kong population ~7.4m (2024 est) shapes housing demand.
- Land grants/rezoning
- Land premium & housing targets
- Government capex timing
- Public consultation impact
Public accountability & governance
High visibility as a critical utility (MTR served over 5 million daily riders pre‑COVID in 2019) invites legislative oversight and audits; incidents often trigger board-level scrutiny and leadership changes. Rising ESG expectations—global sustainable investment reached US$35.3tn in 2020—drive greater disclosure and stakeholder engagement, while strong governance limits politicization of operations.
- Legislative oversight: high public profile
- Incident risk: board scrutiny/leadership turnover
- ESG pressure: increased disclosures
- Governance: buffer against politicization
HKSAR majority ownership (~75%) shifts rail+property strategy; ridership ~85% of 2019
HKSAR holds ~75% of MTR, aligning strategy with public policy and increasing oversight since 2019. Policy shifts on land grants, housing targets and Govt capex directly reshape the Rail‑plus‑Property pipeline; HK population ~7.4m (2024). Ridership ~85% of 2019 by 2023 amplifies fare/political sensitivity. GBA links (pop ~86m) guide expansion and cross‑border coordination.
| Metric | Value |
|---|---|
| Govt ownership | ~75% |
| HK pop (2024) | 7.4m |
| GBA pop | ~86m |
| Ridership vs 2019 (2023) | ~85% |
What is included in the product
Detailed Word Document
Explores how macro-environmental factors uniquely affect MTR across Political, Economic, Social, Technological, Environmental, and Legal dimensions, with data-backed, forward-looking insights tailored to regional market and regulatory dynamics to support executives, investors and strategists in scenario planning, risk mitigation and opportunity identification.
Customizable Excel Spreadsheet
A concise, visually segmented PESTLE summary tailored to MTR that enables quick interpretation, easy note-taking and sharing across teams, and is ready to drop into presentations to streamline external-risk discussions and strategic planning.
Economic factors
HK macro cycle & ridership
Ridership closely tracks employment, retail sales and tourism—MTR patronage recovered to c.85% of 2019 levels by 2024 while visitor arrivals rebounded to around 18–20 million in 2023–24, boosting fare revenue. Economic slowdowns compress fares but leave high fixed costs intact, squeezing margins. Recovery cycles and mega-events (e.g., trade fairs) drive sharp volume spikes; elasticity varies by line, peak vs off-peak and cross-border corridors.
Property market cyclicality
Development profits hinge on Hong Kong’s volatile property prices, which remain about 15% below the 2021 peak as of mid‑2025, and on absorption rates that have slowed in core districts. Interest rates and HIBOR levels (3‑month around 2–2.5% mid‑2025) raise financing costs and squeeze buyer affordability. Inventory timing and presales—often funding 30–50% of project costs—are critical to cash flow, while weak markets delay launches or force unit‑mix shifts.
Inflation, wages & materials
Operating and maintenance costs rise with wage inflation (Hong Kong wages up ~3–5% in 2024–H1 2025) and spare‑part price increases; construction inputs such as steel and cement swung roughly ±10–20% across 2023–2024, pushing project budgets. Long‑dated contracts need CPI/WPI escalation clauses to manage volatility. Productivity gains and procurement scale (typical savings 2–6%) partially offset cost pressures.
Currency & overseas exposure
Revenues and costs from Australia, Mainland China and Europe expose MTR to FX risk; 2024 CPI was about 3.3% in Australia, 0.3% in China and 2.4% in the eurozone, each affecting fare growth and operating costs. Hedging programs (currency forwards/options) materially affect reported earnings volatility and timing of cash flows. Local labor markets and inflation drive concession profitability, while geographic diversification smooths demand cycles but increases treasury and operational complexity.
- FX exposure: multi-currency revenues/costs
- Inflation: AUS 3.3%, CHN 0.3%, EZ 2.4% (2024)
- Hedging: impacts earnings timing and cash flows
- Diversification: stabilizes revenue, ups complexity
Tourism & retail ecosystems
Station retail, advertising and airport-linked routes scale with visitor arrivals—Hong Kong saw about 18.1 million inbound visitors in 2023, boosting MTR non-fare income from retail and advertising and strengthening airport express yields as HKIA recovered capacity to roughly 47 million passengers in 2023. Mainland visitor mix shifts and lower per-capita spending compress non-fare margins, while airline schedule volatility affects demand on specific lines. Strategic retailer partnerships (revenue-sharing, pop-ups) can stabilize ancillary revenue streams.
- Station retail: reliant on visitors; 2023 arrivals ~18.1m
- Airport routes: tied to HKIA ~47m pax (2023)
- Mainland mix: alters per-visitor spend, hits non-fare income
- Retail partnerships: stabilize ancillary revenue
HKSAR majority ownership (~75%) shifts rail+property strategy; ridership ~85% of 2019
Ridership ~85% of 2019 by 2024; visitors ~18–20m in 2023–24 boosting fares/non‑fare income. Property values ~15% below 2021 peak (mid‑2025); 3‑month HIBOR ~2–2.5% (mid‑2025) pressuring financing; wages +3–5% (2024–H1 2025) lift O&M costs; HKIA ~47m pax (2023) supports airport routes.
| Metric | Value |
|---|---|
| Ridership | ~85% of 2019 (2024) |
| Visitors | 18–20m (2023–24) |
| Property gap | ~−15% vs 2021 (mid‑2025) |
| 3m HIBOR | 2–2.5% (mid‑2025) |
| Wage growth | +3–5% (2024–H1 2025) |
| HKIA pax | ~47m (2023) |
Preview the Actual Deliverable
MTR PESTLE Analysis
The MTR PESTLE Analysis preview shown here is the exact document you’ll receive after purchase—fully formatted and ready to use. The layout, content, and structure visible are the final version with no placeholders or teasers. You’ll be able to download and apply this professionally structured file immediately after checkout.











