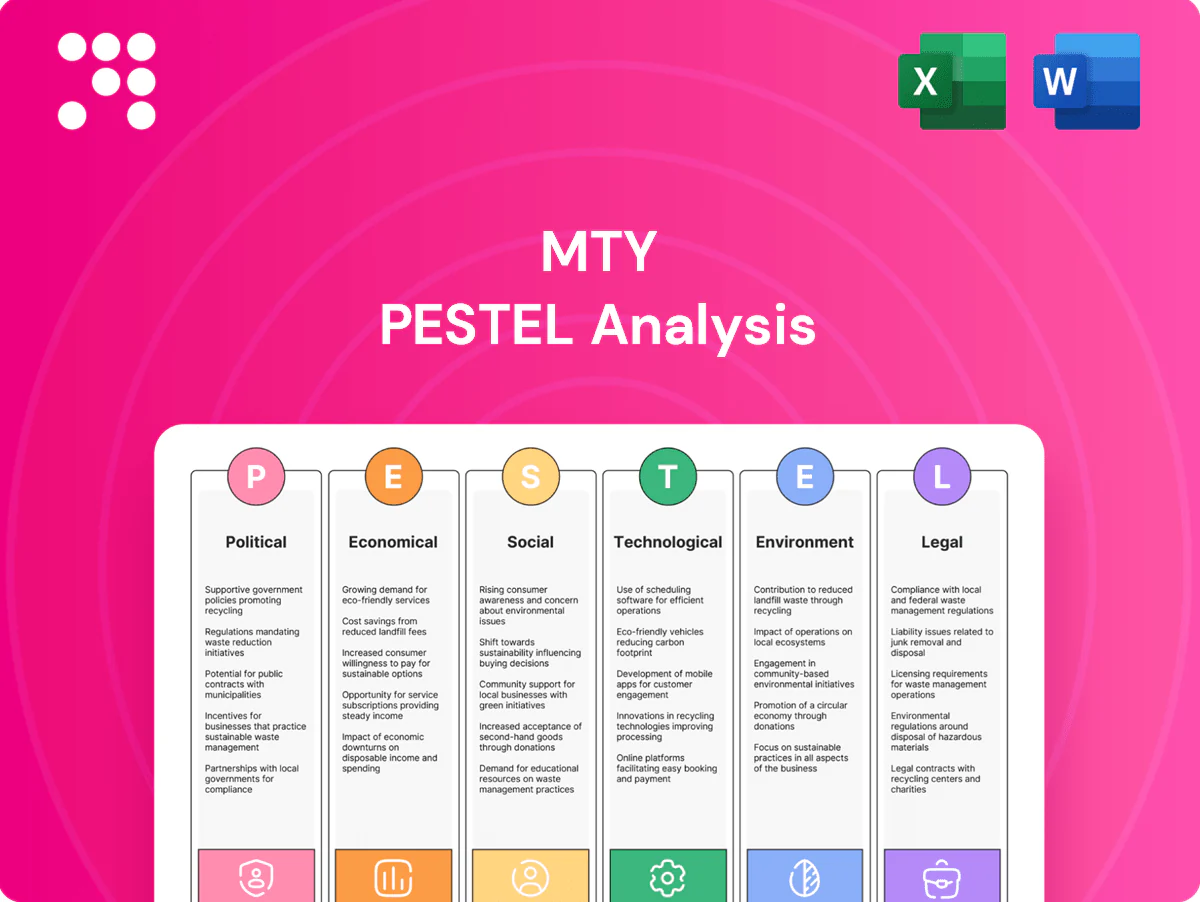
MTY PESTLE Analysis

Plan Smarter. Present Sharper. Compete Stronger.
Unlock strategic clarity with our MTY PESTLE Analysis—three to five concise insights reveal how political, economic, social, technological, legal, and environmental forces will shape MTY's trajectory. Ideal for investors and strategists, this report translates external trends into actionable recommendations. Purchase the full analysis to get the complete, editable dossier and make confident, data-driven decisions.
Political factors

Food safety oversight and inspections
Government agencies in Canada and other markets set and enforce food safety standards that MTY franchisees across its portfolio of over 50 brands and roughly 7,000 locations must meet. Stricter inspections raise compliance complexity and can add to operating costs and capital outlays for equipment and documentation. Consistent protocols and regular audits reduce brand risk but require ongoing training—MTY’s centralized QA programs aim to limit incident-driven policy shifts that force rapid operational adjustments.
Trade policies and import tariffs
MTY, operating over 7,000 locations globally, sources ingredients, packaging and equipment across borders, making it sensitive to tariff shifts; Canada’s average applied MFN tariff is about 2%, while sector-specific duties can be higher. Trade tensions or sudden tariff hikes under USMCA or other regimes can raise input costs and disrupt cuisine-specific supply chains. Diversifying suppliers and localizing inputs across Canada–US–Mexico reduces exposure and requires continuous monitoring of trade policies.

Government support and incentives
Local subsidies, tax credits and post-crisis relief—for example Canada’s CEWS program disbursed about CAD 86 billion—can accelerate MTY’s franchise expansion across its ~80 brands and ~7,000 global locations. Incentives tied to job creation or urban revitalization reduce build-out costs and improve IRR for new outlets. Airports and transit hubs may grant rent or fee concessions subject to political conditions and security mandates. Differing municipal priorities then shape site selection and approval timelines.

Public health policy and pandemics
Mandated capacity limits and mask rules directly reduce quick-service footfall and ordering cadence; WHO declared COVID-19 a pandemic on 11 March 2020 and ended the global emergency on 5 May 2023, underscoring shifting policy phases. Fragmented provincial, state and city responses fragment operations; readiness for on-off restrictions improves resilience in malls and airports; vaccination and health-pass rules affect labor availability and customer flow.
- Fragmented policies increase compliance costs
- Preparedness reduces downtime risk in malls/airports
- Health-pass/vaccine rules alter staffing and peak traffic
Geopolitical stability and currency controls
International operations face elevated risks from political instability and foreign-exchange restrictions that can abruptly block franchise fee repatriation; IMF global growth slowed to about 3.0% in 2024, heightening sensitivity to shocks. Stability in host markets supports predictable royalty flows and supply planning, while rigorous country risk assessment guides measured brand rollout pacing.
- Risk: FX controls can halt fee repatriation
- Benefit: stable countries yield steady royalties
- Action: country risk scores dictate rollout speed
Political risks raise costs and curb expansion for ~7,000-location multi-brand operator
Political risks shape MTY’s cost base and market access across ~7,000 locations and ~80 brands, raising compliance and supply-chain exposure. Tariff shifts (Canada MFN ~2% average) and trade frictions increase input costs while subsidies or rent relief (Canada CEWS ~CAD 86B) can lower build‑out CAPEX. Country instability and FX controls plus IMF 2024 growth ~3.0% affect royalty repatriation and rollout pacing.
| Metric | 2024/25 Value | Implication |
|---|---|---|
| MTY footprint | ~7,000 locations / ~80 brands | High regulatory spread |
| Canada MFN tariff | ~2% | Moderate input cost risk |
| CEWS (example) | ~CAD 86B | Support for openings |
| Global growth (IMF) | ~3.0% (2024) | Sensitivity to shocks |
What is included in the product
 Detailed Word Document
Explores how macro-environmental forces uniquely affect MTY across Political, Economic, Social, Technological, Environmental, and Legal dimensions, with data-backed trends and region-specific examples. Designed for executives and investors, it highlights forward-looking opportunities and risks, supporting scenario planning, pitch decks, and strategic decision-making.

 Customizable Excel Spreadsheet
A concise, visually segmented PESTLE summary of MTY that fits slides and meeting notes, enabling quick identification of political, economic, social, technological, legal and environmental risks; editable for local contexts and easily shareable for rapid team alignment.
Economic factors

Consumer spending and real income
Quick-service demand is highly sensitive to disposable income shifts; with US CPI at 3.4% in 2023 (BLS) and real wages stagnant, customers trade down toward QSRs that represent roughly half of US restaurant visits. Inflation erodes basket size unless prices are adjusted carefully, forcing menus to tighten portions or margins. Value menus and combos—proven in 2024 NPD promotions—can defend traffic, while premium casual concepts face sharper cyclical swings.
Food and labor cost inflation
Protein, grains and dairy volatility — FAO food price index rose about 6% in 2024 — squeezed franchisee margins as beef and dairy input costs spiked. Tight U.S. labor markets (unemployment ~3.8% in 2024) pushed wages and benefits up roughly 4% YoY, inflating payrolls. Menu engineering, portion control and centralized procurement helped protect unit economics and capture scale savings.

Interest rates and credit availability
Higher interest rates—Bank of Canada policy rate at 5.00% as of mid‑2025—increase financing costs for build‑outs and remodels, pushing franchisee borrowing costs into the mid‑single to high‑single digits for commercial loans. Franchisee access to credit therefore directly influences system growth and remodel cadence, with many operators delaying projects when lending terms tighten. MTY’s cost of capital rising with rate cycles raises hurdle rates for M&A and brand refresh investments, and rate volatility shapes valuation multiples and expansion timing.

Foot traffic in retail corridors
Mall and airport volumes still drive many MTY locations: TSA screened passengers in 2024 reached about 90% of 2019 levels, supporting airport-sales heavy units, while mall visits remain roughly 20–30% below 2019 in many trade areas. E-commerce penetration rose to about 16% of US retail in 2024 and remote work has reduced weekday traffic, prompting landlords to renegotiate leases, often cutting effective rents by up to ~15% in 2023–24. Diversifying into street-front and suburban formats spreads foot-traffic risk and captures local daytime demand.
- Mall/airport dependence: TSA ~90% of 2019 (2024)
- Mall visits: -20–30% vs 2019
- E-commerce: ~16% of retail (2024)
- Lease resets: up to ~15% effective rent relief (2023–24)
- Strategy: add street-front/suburban formats
Currency fluctuations
Currency fluctuations create both translation and transaction exposure for MTY, which operates 70+ brands and over 7,300 restaurants across multiple jurisdictions; a strong Canadian dollar can compress reported royalty income when foreign sales are converted to CAD. Hedging programs and natural offsets from local-costed operations help stabilize cash flows and protect margins. Pricing strategies must be adjusted locally to preserve affordability and franchisee margins amid exchange-rate swings.
- translation exposure: affects reported royalties
- transaction exposure: impacts costs and remittances
- hedging & natural offsets: reduce volatility
- local pricing: essential to maintain affordability
Political risks raise costs and curb expansion for ~7,000-location multi-brand operator
QSR demand benefits from trade‑down as US CPI ~3.4% (2023) and real wages stagnate; value menus defend traffic. Input shocks (FAO food index +~6% in 2024) and tight labor (unemp ~3.8% 2024) lift unit costs; BoC rate ~5.00% mid‑2025 raises franchise financing costs. Mall/airport recovery (TSA ~90% of 2019 in 2024) and e‑commerce ~16% (2024) shift format strategy.
| Metric | Value |
|---|---|
| US CPI (2023) | 3.4% |
| FAO food index (2024) | +~6% |
| Unemployment (US, 2024) | ~3.8% |
| BoC policy rate (mid‑2025) | 5.00% |
| TSA vs 2019 (2024) | ~90% |
| E‑commerce (2024) | ~16% |
Preview Before You Purchase
MTY PESTLE Analysis
The MTY PESTLE Analysis preview shown here is the exact document you’ll receive after purchase—fully formatted, professionally structured, and ready to use. No placeholders or teasers: the content and layout are identical to the downloadable file. Purchase delivers this same final document instantly.

Plan Smarter. Present Sharper. Compete Stronger.
Unlock strategic clarity with our MTY PESTLE Analysis—three to five concise insights reveal how political, economic, social, technological, legal, and environmental forces will shape MTY's trajectory. Ideal for investors and strategists, this report translates external trends into actionable recommendations. Purchase the full analysis to get the complete, editable dossier and make confident, data-driven decisions.
Political factors
Food safety oversight and inspections
Government agencies in Canada and other markets set and enforce food safety standards that MTY franchisees across its portfolio of over 50 brands and roughly 7,000 locations must meet. Stricter inspections raise compliance complexity and can add to operating costs and capital outlays for equipment and documentation. Consistent protocols and regular audits reduce brand risk but require ongoing training—MTY’s centralized QA programs aim to limit incident-driven policy shifts that force rapid operational adjustments.
Trade policies and import tariffs
MTY, operating over 7,000 locations globally, sources ingredients, packaging and equipment across borders, making it sensitive to tariff shifts; Canada’s average applied MFN tariff is about 2%, while sector-specific duties can be higher. Trade tensions or sudden tariff hikes under USMCA or other regimes can raise input costs and disrupt cuisine-specific supply chains. Diversifying suppliers and localizing inputs across Canada–US–Mexico reduces exposure and requires continuous monitoring of trade policies.
Government support and incentives
Local subsidies, tax credits and post-crisis relief—for example Canada’s CEWS program disbursed about CAD 86 billion—can accelerate MTY’s franchise expansion across its ~80 brands and ~7,000 global locations. Incentives tied to job creation or urban revitalization reduce build-out costs and improve IRR for new outlets. Airports and transit hubs may grant rent or fee concessions subject to political conditions and security mandates. Differing municipal priorities then shape site selection and approval timelines.
Public health policy and pandemics
Mandated capacity limits and mask rules directly reduce quick-service footfall and ordering cadence; WHO declared COVID-19 a pandemic on 11 March 2020 and ended the global emergency on 5 May 2023, underscoring shifting policy phases. Fragmented provincial, state and city responses fragment operations; readiness for on-off restrictions improves resilience in malls and airports; vaccination and health-pass rules affect labor availability and customer flow.
- Fragmented policies increase compliance costs
- Preparedness reduces downtime risk in malls/airports
- Health-pass/vaccine rules alter staffing and peak traffic
Geopolitical stability and currency controls
International operations face elevated risks from political instability and foreign-exchange restrictions that can abruptly block franchise fee repatriation; IMF global growth slowed to about 3.0% in 2024, heightening sensitivity to shocks. Stability in host markets supports predictable royalty flows and supply planning, while rigorous country risk assessment guides measured brand rollout pacing.
- Risk: FX controls can halt fee repatriation
- Benefit: stable countries yield steady royalties
- Action: country risk scores dictate rollout speed
Political risks raise costs and curb expansion for ~7,000-location multi-brand operator
Political risks shape MTY’s cost base and market access across ~7,000 locations and ~80 brands, raising compliance and supply-chain exposure. Tariff shifts (Canada MFN ~2% average) and trade frictions increase input costs while subsidies or rent relief (Canada CEWS ~CAD 86B) can lower build‑out CAPEX. Country instability and FX controls plus IMF 2024 growth ~3.0% affect royalty repatriation and rollout pacing.
| Metric | 2024/25 Value | Implication |
|---|---|---|
| MTY footprint | ~7,000 locations / ~80 brands | High regulatory spread |
| Canada MFN tariff | ~2% | Moderate input cost risk |
| CEWS (example) | ~CAD 86B | Support for openings |
| Global growth (IMF) | ~3.0% (2024) | Sensitivity to shocks |
What is included in the product
Detailed Word Document
Explores how macro-environmental forces uniquely affect MTY across Political, Economic, Social, Technological, Environmental, and Legal dimensions, with data-backed trends and region-specific examples. Designed for executives and investors, it highlights forward-looking opportunities and risks, supporting scenario planning, pitch decks, and strategic decision-making.
Customizable Excel Spreadsheet
A concise, visually segmented PESTLE summary of MTY that fits slides and meeting notes, enabling quick identification of political, economic, social, technological, legal and environmental risks; editable for local contexts and easily shareable for rapid team alignment.
Economic factors
Consumer spending and real income
Quick-service demand is highly sensitive to disposable income shifts; with US CPI at 3.4% in 2023 (BLS) and real wages stagnant, customers trade down toward QSRs that represent roughly half of US restaurant visits. Inflation erodes basket size unless prices are adjusted carefully, forcing menus to tighten portions or margins. Value menus and combos—proven in 2024 NPD promotions—can defend traffic, while premium casual concepts face sharper cyclical swings.
Food and labor cost inflation
Protein, grains and dairy volatility — FAO food price index rose about 6% in 2024 — squeezed franchisee margins as beef and dairy input costs spiked. Tight U.S. labor markets (unemployment ~3.8% in 2024) pushed wages and benefits up roughly 4% YoY, inflating payrolls. Menu engineering, portion control and centralized procurement helped protect unit economics and capture scale savings.
Interest rates and credit availability
Higher interest rates—Bank of Canada policy rate at 5.00% as of mid‑2025—increase financing costs for build‑outs and remodels, pushing franchisee borrowing costs into the mid‑single to high‑single digits for commercial loans. Franchisee access to credit therefore directly influences system growth and remodel cadence, with many operators delaying projects when lending terms tighten. MTY’s cost of capital rising with rate cycles raises hurdle rates for M&A and brand refresh investments, and rate volatility shapes valuation multiples and expansion timing.
Foot traffic in retail corridors
Mall and airport volumes still drive many MTY locations: TSA screened passengers in 2024 reached about 90% of 2019 levels, supporting airport-sales heavy units, while mall visits remain roughly 20–30% below 2019 in many trade areas. E-commerce penetration rose to about 16% of US retail in 2024 and remote work has reduced weekday traffic, prompting landlords to renegotiate leases, often cutting effective rents by up to ~15% in 2023–24. Diversifying into street-front and suburban formats spreads foot-traffic risk and captures local daytime demand.
- Mall/airport dependence: TSA ~90% of 2019 (2024)
- Mall visits: -20–30% vs 2019
- E-commerce: ~16% of retail (2024)
- Lease resets: up to ~15% effective rent relief (2023–24)
- Strategy: add street-front/suburban formats
Currency fluctuations
Currency fluctuations create both translation and transaction exposure for MTY, which operates 70+ brands and over 7,300 restaurants across multiple jurisdictions; a strong Canadian dollar can compress reported royalty income when foreign sales are converted to CAD. Hedging programs and natural offsets from local-costed operations help stabilize cash flows and protect margins. Pricing strategies must be adjusted locally to preserve affordability and franchisee margins amid exchange-rate swings.
- translation exposure: affects reported royalties
- transaction exposure: impacts costs and remittances
- hedging & natural offsets: reduce volatility
- local pricing: essential to maintain affordability
Political risks raise costs and curb expansion for ~7,000-location multi-brand operator
QSR demand benefits from trade‑down as US CPI ~3.4% (2023) and real wages stagnate; value menus defend traffic. Input shocks (FAO food index +~6% in 2024) and tight labor (unemp ~3.8% 2024) lift unit costs; BoC rate ~5.00% mid‑2025 raises franchise financing costs. Mall/airport recovery (TSA ~90% of 2019 in 2024) and e‑commerce ~16% (2024) shift format strategy.
| Metric | Value |
|---|---|
| US CPI (2023) | 3.4% |
| FAO food index (2024) | +~6% |
| Unemployment (US, 2024) | ~3.8% |
| BoC policy rate (mid‑2025) | 5.00% |
| TSA vs 2019 (2024) | ~90% |
| E‑commerce (2024) | ~16% |
Preview Before You Purchase
MTY PESTLE Analysis
The MTY PESTLE Analysis preview shown here is the exact document you’ll receive after purchase—fully formatted, professionally structured, and ready to use. No placeholders or teasers: the content and layout are identical to the downloadable file. Purchase delivers this same final document instantly.
Description
Plan Smarter. Present Sharper. Compete Stronger.
Unlock strategic clarity with our MTY PESTLE Analysis—three to five concise insights reveal how political, economic, social, technological, legal, and environmental forces will shape MTY's trajectory. Ideal for investors and strategists, this report translates external trends into actionable recommendations. Purchase the full analysis to get the complete, editable dossier and make confident, data-driven decisions.
Political factors
Food safety oversight and inspections
Government agencies in Canada and other markets set and enforce food safety standards that MTY franchisees across its portfolio of over 50 brands and roughly 7,000 locations must meet. Stricter inspections raise compliance complexity and can add to operating costs and capital outlays for equipment and documentation. Consistent protocols and regular audits reduce brand risk but require ongoing training—MTY’s centralized QA programs aim to limit incident-driven policy shifts that force rapid operational adjustments.
Trade policies and import tariffs
MTY, operating over 7,000 locations globally, sources ingredients, packaging and equipment across borders, making it sensitive to tariff shifts; Canada’s average applied MFN tariff is about 2%, while sector-specific duties can be higher. Trade tensions or sudden tariff hikes under USMCA or other regimes can raise input costs and disrupt cuisine-specific supply chains. Diversifying suppliers and localizing inputs across Canada–US–Mexico reduces exposure and requires continuous monitoring of trade policies.
Government support and incentives
Local subsidies, tax credits and post-crisis relief—for example Canada’s CEWS program disbursed about CAD 86 billion—can accelerate MTY’s franchise expansion across its ~80 brands and ~7,000 global locations. Incentives tied to job creation or urban revitalization reduce build-out costs and improve IRR for new outlets. Airports and transit hubs may grant rent or fee concessions subject to political conditions and security mandates. Differing municipal priorities then shape site selection and approval timelines.
Public health policy and pandemics
Mandated capacity limits and mask rules directly reduce quick-service footfall and ordering cadence; WHO declared COVID-19 a pandemic on 11 March 2020 and ended the global emergency on 5 May 2023, underscoring shifting policy phases. Fragmented provincial, state and city responses fragment operations; readiness for on-off restrictions improves resilience in malls and airports; vaccination and health-pass rules affect labor availability and customer flow.
- Fragmented policies increase compliance costs
- Preparedness reduces downtime risk in malls/airports
- Health-pass/vaccine rules alter staffing and peak traffic
Geopolitical stability and currency controls
International operations face elevated risks from political instability and foreign-exchange restrictions that can abruptly block franchise fee repatriation; IMF global growth slowed to about 3.0% in 2024, heightening sensitivity to shocks. Stability in host markets supports predictable royalty flows and supply planning, while rigorous country risk assessment guides measured brand rollout pacing.
- Risk: FX controls can halt fee repatriation
- Benefit: stable countries yield steady royalties
- Action: country risk scores dictate rollout speed
Political risks raise costs and curb expansion for ~7,000-location multi-brand operator
Political risks shape MTY’s cost base and market access across ~7,000 locations and ~80 brands, raising compliance and supply-chain exposure. Tariff shifts (Canada MFN ~2% average) and trade frictions increase input costs while subsidies or rent relief (Canada CEWS ~CAD 86B) can lower build‑out CAPEX. Country instability and FX controls plus IMF 2024 growth ~3.0% affect royalty repatriation and rollout pacing.
| Metric | 2024/25 Value | Implication |
|---|---|---|
| MTY footprint | ~7,000 locations / ~80 brands | High regulatory spread |
| Canada MFN tariff | ~2% | Moderate input cost risk |
| CEWS (example) | ~CAD 86B | Support for openings |
| Global growth (IMF) | ~3.0% (2024) | Sensitivity to shocks |
What is included in the product
Detailed Word Document
Explores how macro-environmental forces uniquely affect MTY across Political, Economic, Social, Technological, Environmental, and Legal dimensions, with data-backed trends and region-specific examples. Designed for executives and investors, it highlights forward-looking opportunities and risks, supporting scenario planning, pitch decks, and strategic decision-making.
Customizable Excel Spreadsheet
A concise, visually segmented PESTLE summary of MTY that fits slides and meeting notes, enabling quick identification of political, economic, social, technological, legal and environmental risks; editable for local contexts and easily shareable for rapid team alignment.
Economic factors
Consumer spending and real income
Quick-service demand is highly sensitive to disposable income shifts; with US CPI at 3.4% in 2023 (BLS) and real wages stagnant, customers trade down toward QSRs that represent roughly half of US restaurant visits. Inflation erodes basket size unless prices are adjusted carefully, forcing menus to tighten portions or margins. Value menus and combos—proven in 2024 NPD promotions—can defend traffic, while premium casual concepts face sharper cyclical swings.
Food and labor cost inflation
Protein, grains and dairy volatility — FAO food price index rose about 6% in 2024 — squeezed franchisee margins as beef and dairy input costs spiked. Tight U.S. labor markets (unemployment ~3.8% in 2024) pushed wages and benefits up roughly 4% YoY, inflating payrolls. Menu engineering, portion control and centralized procurement helped protect unit economics and capture scale savings.
Interest rates and credit availability
Higher interest rates—Bank of Canada policy rate at 5.00% as of mid‑2025—increase financing costs for build‑outs and remodels, pushing franchisee borrowing costs into the mid‑single to high‑single digits for commercial loans. Franchisee access to credit therefore directly influences system growth and remodel cadence, with many operators delaying projects when lending terms tighten. MTY’s cost of capital rising with rate cycles raises hurdle rates for M&A and brand refresh investments, and rate volatility shapes valuation multiples and expansion timing.
Foot traffic in retail corridors
Mall and airport volumes still drive many MTY locations: TSA screened passengers in 2024 reached about 90% of 2019 levels, supporting airport-sales heavy units, while mall visits remain roughly 20–30% below 2019 in many trade areas. E-commerce penetration rose to about 16% of US retail in 2024 and remote work has reduced weekday traffic, prompting landlords to renegotiate leases, often cutting effective rents by up to ~15% in 2023–24. Diversifying into street-front and suburban formats spreads foot-traffic risk and captures local daytime demand.
- Mall/airport dependence: TSA ~90% of 2019 (2024)
- Mall visits: -20–30% vs 2019
- E-commerce: ~16% of retail (2024)
- Lease resets: up to ~15% effective rent relief (2023–24)
- Strategy: add street-front/suburban formats
Currency fluctuations
Currency fluctuations create both translation and transaction exposure for MTY, which operates 70+ brands and over 7,300 restaurants across multiple jurisdictions; a strong Canadian dollar can compress reported royalty income when foreign sales are converted to CAD. Hedging programs and natural offsets from local-costed operations help stabilize cash flows and protect margins. Pricing strategies must be adjusted locally to preserve affordability and franchisee margins amid exchange-rate swings.
- translation exposure: affects reported royalties
- transaction exposure: impacts costs and remittances
- hedging & natural offsets: reduce volatility
- local pricing: essential to maintain affordability
Political risks raise costs and curb expansion for ~7,000-location multi-brand operator
QSR demand benefits from trade‑down as US CPI ~3.4% (2023) and real wages stagnate; value menus defend traffic. Input shocks (FAO food index +~6% in 2024) and tight labor (unemp ~3.8% 2024) lift unit costs; BoC rate ~5.00% mid‑2025 raises franchise financing costs. Mall/airport recovery (TSA ~90% of 2019 in 2024) and e‑commerce ~16% (2024) shift format strategy.
| Metric | Value |
|---|---|
| US CPI (2023) | 3.4% |
| FAO food index (2024) | +~6% |
| Unemployment (US, 2024) | ~3.8% |
| BoC policy rate (mid‑2025) | 5.00% |
| TSA vs 2019 (2024) | ~90% |
| E‑commerce (2024) | ~16% |
Preview Before You Purchase
MTY PESTLE Analysis
The MTY PESTLE Analysis preview shown here is the exact document you’ll receive after purchase—fully formatted, professionally structured, and ready to use. No placeholders or teasers: the content and layout are identical to the downloadable file. Purchase delivers this same final document instantly.











