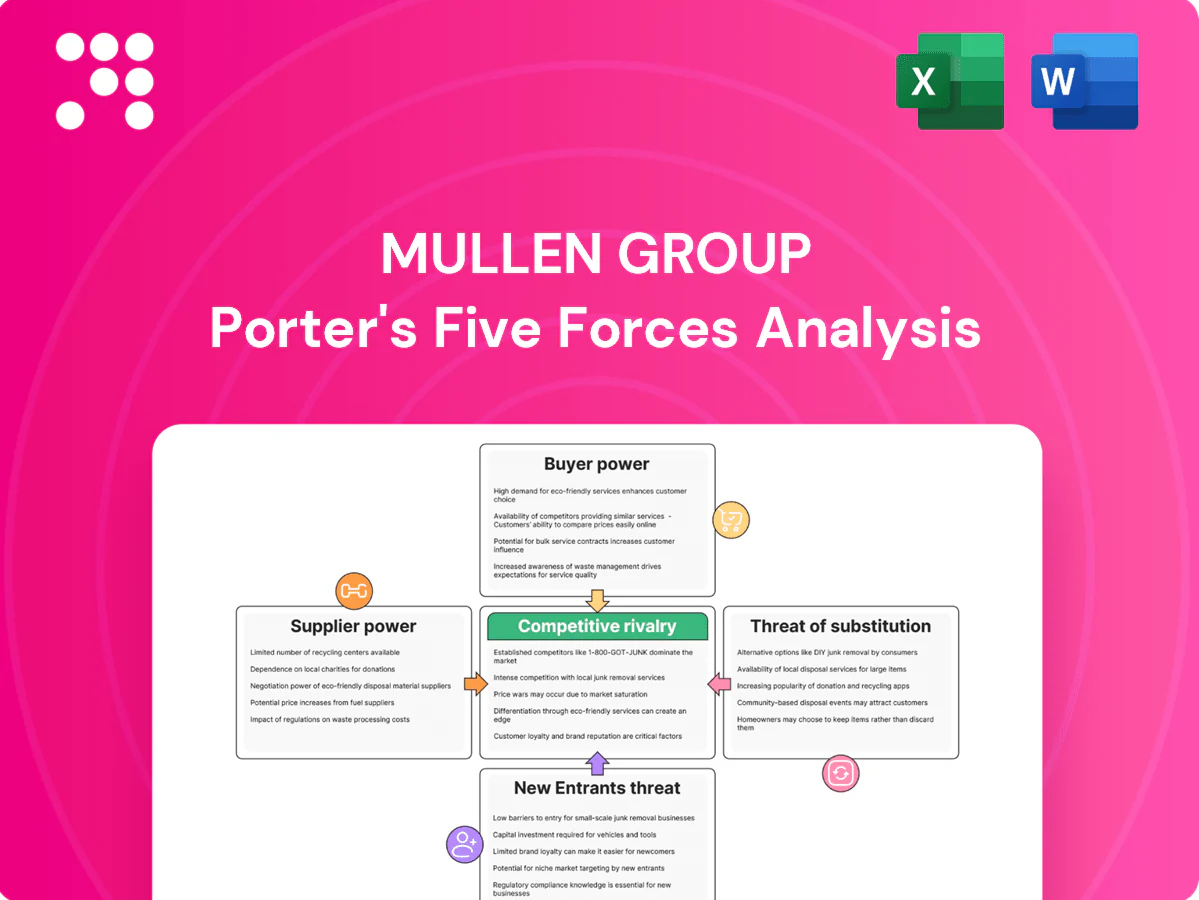
Mullen Group Porter's Five Forces Analysis

From Overview to Strategy Blueprint
Mullen Group faces moderate buyer power, fragmented suppliers, intense regional rivalry, low substitute threat, and regulatory and fuel-cost pressures that shape entry barriers. This brief snapshot only scratches the surface. Unlock the full Porter's Five Forces Analysis to explore Mullen Group’s competitive dynamics in detail.
Suppliers Bargaining Power

Concentrated equipment OEMs
Heavy trucks, trailers and specialized equipment are sourced from a concentrated set of OEMs, giving suppliers leverage on pricing and lead times. Custom specs for specialized freight raise switching costs and retrofit expense. Order backlogs averaged roughly 6–12 months in 2024, constraining capacity growth. Mullen mitigates this via multi-vendor sourcing and fleet standardization where feasible.
Fuel and energy volatility
Fuel providers are numerous but pricing is anchored to global markets (Brent averaged about USD 82/bbl in 2024), shifting bargaining power away from carriers like Mullen Group. Fuel surcharges enable partial pass-through of higher costs but create timing and reconciliation gaps that compress margins. Adoption of alternative fuels and efficiency programs can lower fuel's roughly 20–30% share of operating costs, while regional purchasing pools and hedging strategies temper volatility.

Parts, maintenance, and telematics
Proprietary parts and subscription-based ELDs/telematics create supplier lock-in, with ELD use effectively universal in North American heavy fleets by 2024. Vendor consolidation in components has tightened supply chains and pressured service terms. Robust in-house maintenance and spare inventory materially strengthen Mullen Groups negotiating posture. Adoption of open-platform telematics and APIs in 2024 is reducing single-vendor dependence.

Labor and owner-operators
Real estate and intermodal access
Warehouse landlords in tight nodes and rail terminals with slot constraints exert measurable leverage in 2024, driving higher rents and access fees that squeeze carriers like Mullen Group. Long-term leases and strategic site control support service continuity, while multi-node networks mitigate local bottleneck risk.
- Landlord leverage: elevated in constrained nodes (2024)
- Leases: buffer continuity
- Network: diversifies local exposure
OEM backlogs and high fuel costs magnify supplier leverage amid driver shortfall
OEM concentration and 6–12 month backlogs (2024) raise supplier leverage for trucks/equipment; Mullen mitigates via multi-vendor sourcing. Fuel (Brent ~USD 82/bbl in 2024) drives 20–30% of costs; surcharges partially pass through. Driver shortfall ~20,000 in Canada with ~5% wage inflation increases labor bargaining power. Landlord/rail bottlenecks elevate access fees in key nodes.
| Supplier | 2024 metric | Impact |
|---|---|---|
| OEMs | 6–12m backlog | Higher prices, lead times |
| Fuel | Brent ~USD82/bbl; 20–30% cost | Margin volatility |
| Drivers | ~20,000 shortfall; +5% wages | Higher labor costs |
| Landlords | Tight nodes | Higher rents/fees |
What is included in the product
 Detailed Word Document
Tailored Porter’s Five Forces analysis for Mullen Group, revealing competitive intensity, buyer/supplier leverage, threat of new entrants and substitutes, plus disruptive risks and strategic implications for pricing and profitability.

 Customizable Excel Spreadsheet
A compact Porter's Five Forces snapshot for Mullen Group that distills competitive pressures into a single-sheet, customizable view—toggle threat levels, swap data, and export a spider chart for decks or boardrooms to rapidly relieve strategic decision-making pain points.
Customers Bargaining Power

Large shippers with scale
Large enterprise customers aggregate volumes and run competitive bids, forcing Mullen Group to match market bids and service SLAs; in 2024 these RFP-driven dynamics intensified across energy and mining accounts. Their visibility tools and KPIs raise performance demands, shortening acceptable delivery variances. Multi-year contracts are used to trade price for stability, while customer concentration risk necessitates diversified sector exposure to protect margins.
Service comparability in core lanes
For standard truckload and LTL in 2024 offerings remain broadly comparable across carriers, enabling price-driven switching; lane-by-lane mini-bids further increase buyer leverage by isolating rates per corridor. Differentiation through reliability, claims performance and real-time tracking can blunt price pressure and retain shippers. Density in Mullen Group core corridors improves cost-to-serve via higher asset utilization and shorter deadhead legs.

Specialized freight reduces options
Complex, oversized, or hazardous loads shrink qualified carrier pools, lowering buyer power as switching options are limited; in 2024 Mullen Group reported CAD 1.22 billion revenue, reflecting premiums for specialized services. Compliance, certifications and equipment specificity create switching frictions that sustain margins. Mullen’s heavy-haul, escort and specialized fleet command premium pricing, and performance and safety records function as selection gates rather than tie-breakers.

Integrated logistics expectations
Buyers increasingly demand bundled trucking, warehousing and 3PL to cut handoffs, raising dependency on single providers and elevating switching costs across services; in 2024 this trend intensified as customers prioritized end-to-end visibility. Data integration and KPI dashboards are now table stakes for contracts and RFPs. Cross-border expertise and customs capabilities further embed long-term relationships.
- integration
- higher switching-costs
- data-KPIs
- cross-border expertise
Demand cyclicality and spot exposure
Demand cyclicality amplifies buyer leverage in downturns as excess capacity pushes spot rates lower; DAT Freight & Analytics reported U.S. spot TL rates down about 10% YoY in 2024 Q3, while tight markets reversed leverage to carriers. A balanced contract/spot mix stabilizes yields and collaborative forecasting with shippers reduces capacity mismatches and price volatility.
- Downturns: excess capacity → buyer leverage
- Tight markets: carrier leverage rebounds
- Mix: contracts + spot stabilizes yields
- Collaboration: forecasting aligns capacity
RFPs tighten SLAs; TL spot rates down -10%, specialists sustain premiums
Enterprise RFPs intensified in 2024, forcing bid-matching and tighter SLAs; Mullen reported CAD 1.22B revenue in 2024. Standard TL/LTL remain commoditized—DAT: US spot TL rates -10% YoY in 2024 Q3—boosting buyer price power, while specialized/heavy loads and cross-border services sustain premiums and stickiness. A balanced contract/spot mix and KPI integration moderate volatility.
| Metric | 2024 |
|---|---|
| Revenue | CAD 1.22B |
| Spot TL rates (Q3 YoY) | -10% |
| Buyer leverage | High (commoditized lanes) |
| Specialized premium | Supports margins |
Full Version Awaits
Mullen Group Porter's Five Forces Analysis
This preview shows the exact Mullen Group Porter’s Five Forces analysis you'll receive immediately after purchase—no surprises or placeholders. The file is professionally formatted, comprehensive and ready for download and use the moment you buy. It covers competitive rivalry, supplier and buyer power, and threats of entry and substitutes with clear strategic implications.

From Overview to Strategy Blueprint
Mullen Group faces moderate buyer power, fragmented suppliers, intense regional rivalry, low substitute threat, and regulatory and fuel-cost pressures that shape entry barriers. This brief snapshot only scratches the surface. Unlock the full Porter's Five Forces Analysis to explore Mullen Group’s competitive dynamics in detail.
Suppliers Bargaining Power
Concentrated equipment OEMs
Heavy trucks, trailers and specialized equipment are sourced from a concentrated set of OEMs, giving suppliers leverage on pricing and lead times. Custom specs for specialized freight raise switching costs and retrofit expense. Order backlogs averaged roughly 6–12 months in 2024, constraining capacity growth. Mullen mitigates this via multi-vendor sourcing and fleet standardization where feasible.
Fuel and energy volatility
Fuel providers are numerous but pricing is anchored to global markets (Brent averaged about USD 82/bbl in 2024), shifting bargaining power away from carriers like Mullen Group. Fuel surcharges enable partial pass-through of higher costs but create timing and reconciliation gaps that compress margins. Adoption of alternative fuels and efficiency programs can lower fuel's roughly 20–30% share of operating costs, while regional purchasing pools and hedging strategies temper volatility.
Parts, maintenance, and telematics
Proprietary parts and subscription-based ELDs/telematics create supplier lock-in, with ELD use effectively universal in North American heavy fleets by 2024. Vendor consolidation in components has tightened supply chains and pressured service terms. Robust in-house maintenance and spare inventory materially strengthen Mullen Groups negotiating posture. Adoption of open-platform telematics and APIs in 2024 is reducing single-vendor dependence.
Labor and owner-operators
Real estate and intermodal access
Warehouse landlords in tight nodes and rail terminals with slot constraints exert measurable leverage in 2024, driving higher rents and access fees that squeeze carriers like Mullen Group. Long-term leases and strategic site control support service continuity, while multi-node networks mitigate local bottleneck risk.
- Landlord leverage: elevated in constrained nodes (2024)
- Leases: buffer continuity
- Network: diversifies local exposure
OEM backlogs and high fuel costs magnify supplier leverage amid driver shortfall
OEM concentration and 6–12 month backlogs (2024) raise supplier leverage for trucks/equipment; Mullen mitigates via multi-vendor sourcing. Fuel (Brent ~USD 82/bbl in 2024) drives 20–30% of costs; surcharges partially pass through. Driver shortfall ~20,000 in Canada with ~5% wage inflation increases labor bargaining power. Landlord/rail bottlenecks elevate access fees in key nodes.
| Supplier | 2024 metric | Impact |
|---|---|---|
| OEMs | 6–12m backlog | Higher prices, lead times |
| Fuel | Brent ~USD82/bbl; 20–30% cost | Margin volatility |
| Drivers | ~20,000 shortfall; +5% wages | Higher labor costs |
| Landlords | Tight nodes | Higher rents/fees |
What is included in the product
Detailed Word Document
Tailored Porter’s Five Forces analysis for Mullen Group, revealing competitive intensity, buyer/supplier leverage, threat of new entrants and substitutes, plus disruptive risks and strategic implications for pricing and profitability.
Customizable Excel Spreadsheet
A compact Porter's Five Forces snapshot for Mullen Group that distills competitive pressures into a single-sheet, customizable view—toggle threat levels, swap data, and export a spider chart for decks or boardrooms to rapidly relieve strategic decision-making pain points.
Customers Bargaining Power
Large shippers with scale
Large enterprise customers aggregate volumes and run competitive bids, forcing Mullen Group to match market bids and service SLAs; in 2024 these RFP-driven dynamics intensified across energy and mining accounts. Their visibility tools and KPIs raise performance demands, shortening acceptable delivery variances. Multi-year contracts are used to trade price for stability, while customer concentration risk necessitates diversified sector exposure to protect margins.
Service comparability in core lanes
For standard truckload and LTL in 2024 offerings remain broadly comparable across carriers, enabling price-driven switching; lane-by-lane mini-bids further increase buyer leverage by isolating rates per corridor. Differentiation through reliability, claims performance and real-time tracking can blunt price pressure and retain shippers. Density in Mullen Group core corridors improves cost-to-serve via higher asset utilization and shorter deadhead legs.
Specialized freight reduces options
Complex, oversized, or hazardous loads shrink qualified carrier pools, lowering buyer power as switching options are limited; in 2024 Mullen Group reported CAD 1.22 billion revenue, reflecting premiums for specialized services. Compliance, certifications and equipment specificity create switching frictions that sustain margins. Mullen’s heavy-haul, escort and specialized fleet command premium pricing, and performance and safety records function as selection gates rather than tie-breakers.
Integrated logistics expectations
Buyers increasingly demand bundled trucking, warehousing and 3PL to cut handoffs, raising dependency on single providers and elevating switching costs across services; in 2024 this trend intensified as customers prioritized end-to-end visibility. Data integration and KPI dashboards are now table stakes for contracts and RFPs. Cross-border expertise and customs capabilities further embed long-term relationships.
- integration
- higher switching-costs
- data-KPIs
- cross-border expertise
Demand cyclicality and spot exposure
Demand cyclicality amplifies buyer leverage in downturns as excess capacity pushes spot rates lower; DAT Freight & Analytics reported U.S. spot TL rates down about 10% YoY in 2024 Q3, while tight markets reversed leverage to carriers. A balanced contract/spot mix stabilizes yields and collaborative forecasting with shippers reduces capacity mismatches and price volatility.
- Downturns: excess capacity → buyer leverage
- Tight markets: carrier leverage rebounds
- Mix: contracts + spot stabilizes yields
- Collaboration: forecasting aligns capacity
RFPs tighten SLAs; TL spot rates down -10%, specialists sustain premiums
Enterprise RFPs intensified in 2024, forcing bid-matching and tighter SLAs; Mullen reported CAD 1.22B revenue in 2024. Standard TL/LTL remain commoditized—DAT: US spot TL rates -10% YoY in 2024 Q3—boosting buyer price power, while specialized/heavy loads and cross-border services sustain premiums and stickiness. A balanced contract/spot mix and KPI integration moderate volatility.
| Metric | 2024 |
|---|---|
| Revenue | CAD 1.22B |
| Spot TL rates (Q3 YoY) | -10% |
| Buyer leverage | High (commoditized lanes) |
| Specialized premium | Supports margins |
Full Version Awaits
Mullen Group Porter's Five Forces Analysis
This preview shows the exact Mullen Group Porter’s Five Forces analysis you'll receive immediately after purchase—no surprises or placeholders. The file is professionally formatted, comprehensive and ready for download and use the moment you buy. It covers competitive rivalry, supplier and buyer power, and threats of entry and substitutes with clear strategic implications.
Original: $10.00
-65%$10.00
$3.50Description
From Overview to Strategy Blueprint
Mullen Group faces moderate buyer power, fragmented suppliers, intense regional rivalry, low substitute threat, and regulatory and fuel-cost pressures that shape entry barriers. This brief snapshot only scratches the surface. Unlock the full Porter's Five Forces Analysis to explore Mullen Group’s competitive dynamics in detail.
Suppliers Bargaining Power
Concentrated equipment OEMs
Heavy trucks, trailers and specialized equipment are sourced from a concentrated set of OEMs, giving suppliers leverage on pricing and lead times. Custom specs for specialized freight raise switching costs and retrofit expense. Order backlogs averaged roughly 6–12 months in 2024, constraining capacity growth. Mullen mitigates this via multi-vendor sourcing and fleet standardization where feasible.
Fuel and energy volatility
Fuel providers are numerous but pricing is anchored to global markets (Brent averaged about USD 82/bbl in 2024), shifting bargaining power away from carriers like Mullen Group. Fuel surcharges enable partial pass-through of higher costs but create timing and reconciliation gaps that compress margins. Adoption of alternative fuels and efficiency programs can lower fuel's roughly 20–30% share of operating costs, while regional purchasing pools and hedging strategies temper volatility.
Parts, maintenance, and telematics
Proprietary parts and subscription-based ELDs/telematics create supplier lock-in, with ELD use effectively universal in North American heavy fleets by 2024. Vendor consolidation in components has tightened supply chains and pressured service terms. Robust in-house maintenance and spare inventory materially strengthen Mullen Groups negotiating posture. Adoption of open-platform telematics and APIs in 2024 is reducing single-vendor dependence.
Labor and owner-operators
Real estate and intermodal access
Warehouse landlords in tight nodes and rail terminals with slot constraints exert measurable leverage in 2024, driving higher rents and access fees that squeeze carriers like Mullen Group. Long-term leases and strategic site control support service continuity, while multi-node networks mitigate local bottleneck risk.
- Landlord leverage: elevated in constrained nodes (2024)
- Leases: buffer continuity
- Network: diversifies local exposure
OEM backlogs and high fuel costs magnify supplier leverage amid driver shortfall
OEM concentration and 6–12 month backlogs (2024) raise supplier leverage for trucks/equipment; Mullen mitigates via multi-vendor sourcing. Fuel (Brent ~USD 82/bbl in 2024) drives 20–30% of costs; surcharges partially pass through. Driver shortfall ~20,000 in Canada with ~5% wage inflation increases labor bargaining power. Landlord/rail bottlenecks elevate access fees in key nodes.
| Supplier | 2024 metric | Impact |
|---|---|---|
| OEMs | 6–12m backlog | Higher prices, lead times |
| Fuel | Brent ~USD82/bbl; 20–30% cost | Margin volatility |
| Drivers | ~20,000 shortfall; +5% wages | Higher labor costs |
| Landlords | Tight nodes | Higher rents/fees |
What is included in the product
Detailed Word Document
Tailored Porter’s Five Forces analysis for Mullen Group, revealing competitive intensity, buyer/supplier leverage, threat of new entrants and substitutes, plus disruptive risks and strategic implications for pricing and profitability.
Customizable Excel Spreadsheet
A compact Porter's Five Forces snapshot for Mullen Group that distills competitive pressures into a single-sheet, customizable view—toggle threat levels, swap data, and export a spider chart for decks or boardrooms to rapidly relieve strategic decision-making pain points.
Customers Bargaining Power
Large shippers with scale
Large enterprise customers aggregate volumes and run competitive bids, forcing Mullen Group to match market bids and service SLAs; in 2024 these RFP-driven dynamics intensified across energy and mining accounts. Their visibility tools and KPIs raise performance demands, shortening acceptable delivery variances. Multi-year contracts are used to trade price for stability, while customer concentration risk necessitates diversified sector exposure to protect margins.
Service comparability in core lanes
For standard truckload and LTL in 2024 offerings remain broadly comparable across carriers, enabling price-driven switching; lane-by-lane mini-bids further increase buyer leverage by isolating rates per corridor. Differentiation through reliability, claims performance and real-time tracking can blunt price pressure and retain shippers. Density in Mullen Group core corridors improves cost-to-serve via higher asset utilization and shorter deadhead legs.
Specialized freight reduces options
Complex, oversized, or hazardous loads shrink qualified carrier pools, lowering buyer power as switching options are limited; in 2024 Mullen Group reported CAD 1.22 billion revenue, reflecting premiums for specialized services. Compliance, certifications and equipment specificity create switching frictions that sustain margins. Mullen’s heavy-haul, escort and specialized fleet command premium pricing, and performance and safety records function as selection gates rather than tie-breakers.
Integrated logistics expectations
Buyers increasingly demand bundled trucking, warehousing and 3PL to cut handoffs, raising dependency on single providers and elevating switching costs across services; in 2024 this trend intensified as customers prioritized end-to-end visibility. Data integration and KPI dashboards are now table stakes for contracts and RFPs. Cross-border expertise and customs capabilities further embed long-term relationships.
- integration
- higher switching-costs
- data-KPIs
- cross-border expertise
Demand cyclicality and spot exposure
Demand cyclicality amplifies buyer leverage in downturns as excess capacity pushes spot rates lower; DAT Freight & Analytics reported U.S. spot TL rates down about 10% YoY in 2024 Q3, while tight markets reversed leverage to carriers. A balanced contract/spot mix stabilizes yields and collaborative forecasting with shippers reduces capacity mismatches and price volatility.
- Downturns: excess capacity → buyer leverage
- Tight markets: carrier leverage rebounds
- Mix: contracts + spot stabilizes yields
- Collaboration: forecasting aligns capacity
RFPs tighten SLAs; TL spot rates down -10%, specialists sustain premiums
Enterprise RFPs intensified in 2024, forcing bid-matching and tighter SLAs; Mullen reported CAD 1.22B revenue in 2024. Standard TL/LTL remain commoditized—DAT: US spot TL rates -10% YoY in 2024 Q3—boosting buyer price power, while specialized/heavy loads and cross-border services sustain premiums and stickiness. A balanced contract/spot mix and KPI integration moderate volatility.
| Metric | 2024 |
|---|---|
| Revenue | CAD 1.22B |
| Spot TL rates (Q3 YoY) | -10% |
| Buyer leverage | High (commoditized lanes) |
| Specialized premium | Supports margins |
Full Version Awaits
Mullen Group Porter's Five Forces Analysis
This preview shows the exact Mullen Group Porter’s Five Forces analysis you'll receive immediately after purchase—no surprises or placeholders. The file is professionally formatted, comprehensive and ready for download and use the moment you buy. It covers competitive rivalry, supplier and buyer power, and threats of entry and substitutes with clear strategic implications.











