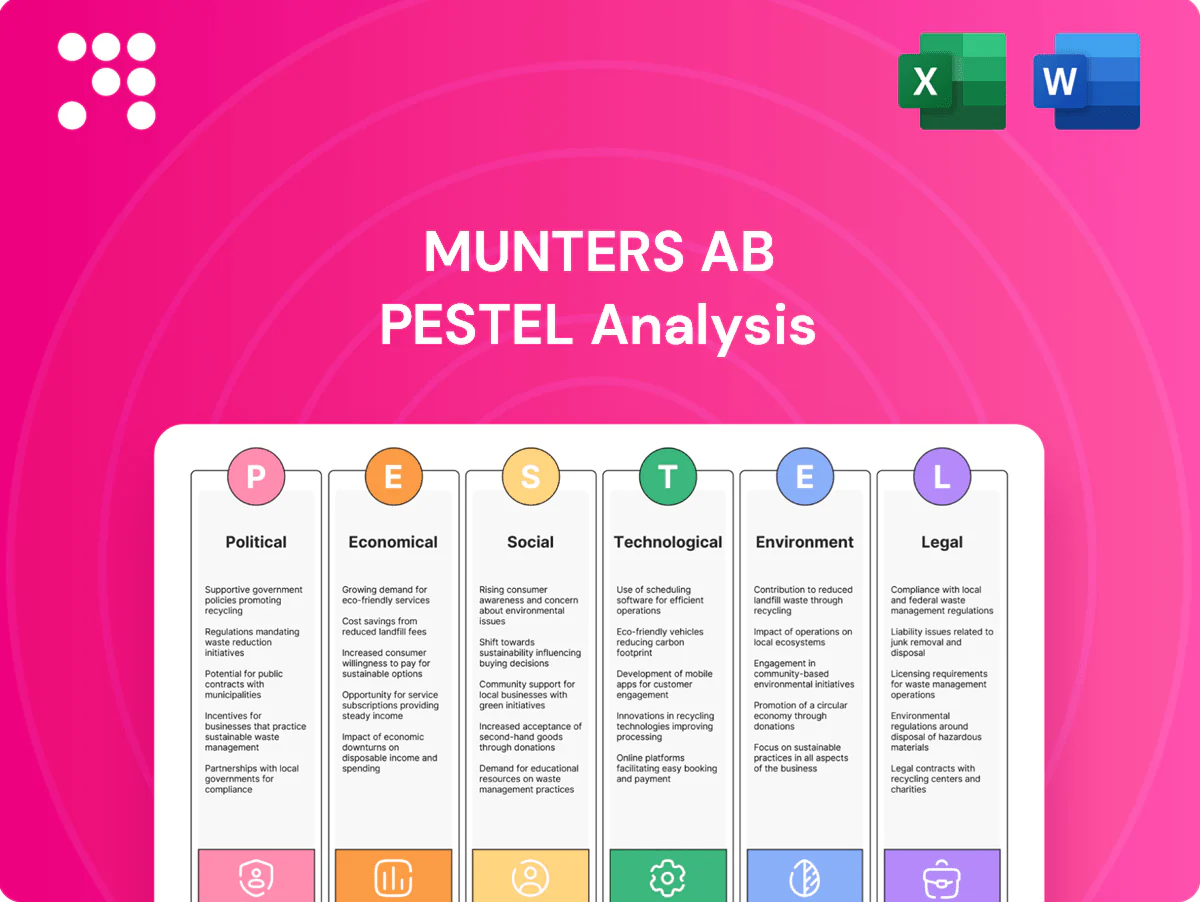
Munters AB PESTLE Analysis

Make Smarter Strategic Decisions with a Complete PESTEL View
Unlock how political, economic, social, technological, legal and environmental forces are reshaping Munters AB and its market position. Our concise PESTLE highlights risks and growth levers for investors, strategists and consultants. Purchase the full analysis for detailed, actionable insights you can deploy immediately.
Political factors

Energy policy incentives
Shifts like the EU Fit for 55 (55% emissions cut by 2030) and US Inflation Reduction Act (about $369 billion for clean energy) boost demand for Munters dehumidification and high-efficiency climate systems in food, pharma and data centers; subsidies, tax credits and public tenders speed adoption. Sudden policy reversals or budget cuts can delay orders and lengthen sales cycles. Monitoring green industrial strategies and the EU Green Deal mobilizing ~€1 trillion through the decade helps prioritize bids and capacity.
Trade and tariffs
Tariffs on metals, electronics or HVAC components directly raise Munters’ input costs and pricing pressure; for example US Section 232 steel tariffs remain at up to 25%, lifting steel-based component costs. Geopolitical tensions disrupt cross-border flows, extending lead times and driving higher safety stock. Regionalization and friend-shoring may force supplier duplication, potentially increasing sourcing costs an estimated 5–15%, so Munters hedges by qualifying multi-region vendors.

Public infrastructure programs
Government-backed data center, healthcare and cold-chain investments create steady public project pipelines for climate control and dehumidification, with procurement cycles often spanning 6–24 months. Procurement rules favor certified, energy-efficient equipment and proven vendors, raising technical spec thresholds. Longer administrative timelines can shift revenue recognition and cashflow timing. Aligning product specs with public standards materially increases win rates.

Geopolitical risk
Geopolitical conflicts and sanctions can directly restrict Munters ABs sales, service access and project financing in affected regions, driving customers—especially in emerging markets—to postpone capex and extend procurement cycles. Logistics disruptions raise freight and insurance costs and can delay spare-part delivery, while scenario planning helps allocate inventory and deploy service teams to maintain uptime.
- Sanctions/restrictions: limit market access
- Capex delays: higher in emerging markets
- Logistics: increased cost and unreliability
- Mitigation: scenario planning for inventory/service
Industrial policy competition
Industrial policy competition shapes Munters AB bids as national local-content rules can tilt procurement toward domestic HVAC suppliers; Munters reported group net sales of about SEK 7.8 billion in 2024, increasing exposure to such policies in key markets.
Export credit agency support for competitors on large projects improves their pricing power; OECD data show official export credit commitments exceeded USD 130 billion in 2024, raising contestability on large EPC contracts.
Active engagement with trade bodies lets Munters influence standards favoring energy-efficient solutions and chillers, while local assembly hubs reduce tariff and local-content disadvantages in markets with procurement preferences.
- Local-content rules: can bias bids in favor of domestic suppliers
- Export credit: OECD official commitments > USD 130B (2024)
- Standards: trade-body engagement shapes energy-efficiency requirements
- Mitigation: local assembly lowers policy-driven competitive gaps
EU Fit for 55 & US IRA USD 369B boost dehumidifiers demand; tariffs raise costs
EU Fit for 55 and US IRA (≈USD 369 billion) accelerate demand for energy-efficient dehumidification; Munters reported group net sales ~SEK 7.8bn (2024). US Section 232 steel tariffs (up to 25%) and friend-shoring can raise sourcing costs ~5–15%, extending lead times. OECD export credit commitments >USD 130bn (2024) increase competition on large EPC projects.
| Political factor | Metric/2024–25 | Impact on Munters |
|---|---|---|
| Green policies | IRA USD 369B; EU Fit for 55 | ↑project pipeline, higher spec demand |
| Tariffs | US steel up to 25% | ↑input costs, pricing pressure |
| Export credit | OECD >USD130B | ↑competitor bidding power |
What is included in the product
 Detailed Word Document
Explores how Political, Economic, Social, Technological, Environmental and Legal forces uniquely impact Munters AB, with data-backed trends and region- and industry-specific examples. Designed for executives and investors, it offers forward-looking insights, scenario cues and ready-to-insert findings for strategic planning.

 Customizable Excel Spreadsheet
A concise, PESTLE‑segmented summary of Munters AB that clarifies external risks and opportunities for quick reference in meetings, presentations, or client reports; editable notes let teams adapt insights to their region or business unit.
Economic factors

Capex cycles
Capex cycles in food processing, pharma and data center expansions drive Munters AB order intake volatility as these end-markets are cyclical; hyperscaler/cloud capex surged to roughly 150 billion USD annually around 2023–24, creating step-changes in demand for cooling and dehumidification equipment.
Conversely, macro downturns and inventory corrections rapidly compress Munters backlog and shipments, while investments in flexible, modular manufacturing and configurable product lines help buffer cycle volatility and shorten lead times.
FX and inflation
Munters faces currency risk across SEK, EUR, USD and CNY as commercial and manufacturing flows span Europe, North America and China; FX moves in 2024 saw SEK fluctuate ~10% vs USD and ~6% vs EUR, amplifying translation and transaction exposure. Input inflation in steel, aluminum and electronics pressured margins—global steel and aluminum prices fell roughly 8–12% in 2024 but input costs remain above 2021 levels. Pricing escalators and hedges (typically covering up to 12 months) blunt volatility, yet lag effects persist and squeeze near-term EBIT. Disciplined regional pricing and cost pass-through are essential to protect operating margin.

Interest rates
Higher policy rates (US Fed funds 5.25–5.50% and Riksbank ~4.00% in mid‑2025) raise customer WACC, causing non‑critical HVAC upgrades to be deferred and slowing Munters AB order flow; project financing costs can postpone large retrofits given typical commercial loan spreads of 200–400 bps. As rates ease, energy‑savings ROI improves and deal velocity can rise; leasing or performance contracts bridge tight credit cycles.

Energy prices
Supply chain costs
Supply chain costs for Munters are pressured by elevated freight and lingering chip and component scarcity, increasing delivery times and cost-to-serve across HVAC and air-treatment product lines.
Dual-sourcing, strategic redesigns and longer lead-time buys have reduced bottlenecks and improved on-time delivery metrics in 2024.
Inventory policies must balance higher service-level targets against tied-up working capital, while close vendor partnerships secure strategic parts and prioritised allocation.
- freight pressure — impacts margins and lead times
- chip/component scarcity — affects production continuity
- dual-sourcing & redesign — mitigates single-source risk
- inventory vs working capital — trade-off for service levels
- vendor partnerships — secure strategic allocations
EU Fit for 55 & US IRA USD 369B boost dehumidifiers demand; tariffs raise costs
Munters faces cyclical demand as food, pharma and hyperscaler capex (hyperscaler/cloud ~150 billion USD p.a. in 2023–24) drive order volatility. Currency swings—SEK ~10% vs USD and ~6% vs EUR in 2024—plus input inflation (steel/aluminum down ~8–12% in 2024 but above 2021) pressure margins. Higher rates (Fed 5.25–5.50% mid‑2025) raise customer WACC and delay projects. Energy at ~0.14 EUR/kWh in 2024 boosts ROI for efficient systems.
Same Document Delivered
Munters AB PESTLE Analysis
The Munters AB PESTLE Analysis preview shown here is the exact document you’ll receive after purchase—fully formatted and ready to use. It includes political, economic, social, technological, legal, and environmental assessments tailored to Munters AB. No placeholders, no surprises. Download the final file immediately after checkout.

Make Smarter Strategic Decisions with a Complete PESTEL View
Unlock how political, economic, social, technological, legal and environmental forces are reshaping Munters AB and its market position. Our concise PESTLE highlights risks and growth levers for investors, strategists and consultants. Purchase the full analysis for detailed, actionable insights you can deploy immediately.
Political factors
Energy policy incentives
Shifts like the EU Fit for 55 (55% emissions cut by 2030) and US Inflation Reduction Act (about $369 billion for clean energy) boost demand for Munters dehumidification and high-efficiency climate systems in food, pharma and data centers; subsidies, tax credits and public tenders speed adoption. Sudden policy reversals or budget cuts can delay orders and lengthen sales cycles. Monitoring green industrial strategies and the EU Green Deal mobilizing ~€1 trillion through the decade helps prioritize bids and capacity.
Trade and tariffs
Tariffs on metals, electronics or HVAC components directly raise Munters’ input costs and pricing pressure; for example US Section 232 steel tariffs remain at up to 25%, lifting steel-based component costs. Geopolitical tensions disrupt cross-border flows, extending lead times and driving higher safety stock. Regionalization and friend-shoring may force supplier duplication, potentially increasing sourcing costs an estimated 5–15%, so Munters hedges by qualifying multi-region vendors.
Public infrastructure programs
Government-backed data center, healthcare and cold-chain investments create steady public project pipelines for climate control and dehumidification, with procurement cycles often spanning 6–24 months. Procurement rules favor certified, energy-efficient equipment and proven vendors, raising technical spec thresholds. Longer administrative timelines can shift revenue recognition and cashflow timing. Aligning product specs with public standards materially increases win rates.
Geopolitical risk
Geopolitical conflicts and sanctions can directly restrict Munters ABs sales, service access and project financing in affected regions, driving customers—especially in emerging markets—to postpone capex and extend procurement cycles. Logistics disruptions raise freight and insurance costs and can delay spare-part delivery, while scenario planning helps allocate inventory and deploy service teams to maintain uptime.
- Sanctions/restrictions: limit market access
- Capex delays: higher in emerging markets
- Logistics: increased cost and unreliability
- Mitigation: scenario planning for inventory/service
Industrial policy competition
Industrial policy competition shapes Munters AB bids as national local-content rules can tilt procurement toward domestic HVAC suppliers; Munters reported group net sales of about SEK 7.8 billion in 2024, increasing exposure to such policies in key markets.
Export credit agency support for competitors on large projects improves their pricing power; OECD data show official export credit commitments exceeded USD 130 billion in 2024, raising contestability on large EPC contracts.
Active engagement with trade bodies lets Munters influence standards favoring energy-efficient solutions and chillers, while local assembly hubs reduce tariff and local-content disadvantages in markets with procurement preferences.
- Local-content rules: can bias bids in favor of domestic suppliers
- Export credit: OECD official commitments > USD 130B (2024)
- Standards: trade-body engagement shapes energy-efficiency requirements
- Mitigation: local assembly lowers policy-driven competitive gaps
EU Fit for 55 & US IRA USD 369B boost dehumidifiers demand; tariffs raise costs
EU Fit for 55 and US IRA (≈USD 369 billion) accelerate demand for energy-efficient dehumidification; Munters reported group net sales ~SEK 7.8bn (2024). US Section 232 steel tariffs (up to 25%) and friend-shoring can raise sourcing costs ~5–15%, extending lead times. OECD export credit commitments >USD 130bn (2024) increase competition on large EPC projects.
| Political factor | Metric/2024–25 | Impact on Munters |
|---|---|---|
| Green policies | IRA USD 369B; EU Fit for 55 | ↑project pipeline, higher spec demand |
| Tariffs | US steel up to 25% | ↑input costs, pricing pressure |
| Export credit | OECD >USD130B | ↑competitor bidding power |
What is included in the product
Detailed Word Document
Explores how Political, Economic, Social, Technological, Environmental and Legal forces uniquely impact Munters AB, with data-backed trends and region- and industry-specific examples. Designed for executives and investors, it offers forward-looking insights, scenario cues and ready-to-insert findings for strategic planning.
Customizable Excel Spreadsheet
A concise, PESTLE‑segmented summary of Munters AB that clarifies external risks and opportunities for quick reference in meetings, presentations, or client reports; editable notes let teams adapt insights to their region or business unit.
Economic factors
Capex cycles
Capex cycles in food processing, pharma and data center expansions drive Munters AB order intake volatility as these end-markets are cyclical; hyperscaler/cloud capex surged to roughly 150 billion USD annually around 2023–24, creating step-changes in demand for cooling and dehumidification equipment.
Conversely, macro downturns and inventory corrections rapidly compress Munters backlog and shipments, while investments in flexible, modular manufacturing and configurable product lines help buffer cycle volatility and shorten lead times.
FX and inflation
Munters faces currency risk across SEK, EUR, USD and CNY as commercial and manufacturing flows span Europe, North America and China; FX moves in 2024 saw SEK fluctuate ~10% vs USD and ~6% vs EUR, amplifying translation and transaction exposure. Input inflation in steel, aluminum and electronics pressured margins—global steel and aluminum prices fell roughly 8–12% in 2024 but input costs remain above 2021 levels. Pricing escalators and hedges (typically covering up to 12 months) blunt volatility, yet lag effects persist and squeeze near-term EBIT. Disciplined regional pricing and cost pass-through are essential to protect operating margin.
Interest rates
Higher policy rates (US Fed funds 5.25–5.50% and Riksbank ~4.00% in mid‑2025) raise customer WACC, causing non‑critical HVAC upgrades to be deferred and slowing Munters AB order flow; project financing costs can postpone large retrofits given typical commercial loan spreads of 200–400 bps. As rates ease, energy‑savings ROI improves and deal velocity can rise; leasing or performance contracts bridge tight credit cycles.
Energy prices
Supply chain costs
Supply chain costs for Munters are pressured by elevated freight and lingering chip and component scarcity, increasing delivery times and cost-to-serve across HVAC and air-treatment product lines.
Dual-sourcing, strategic redesigns and longer lead-time buys have reduced bottlenecks and improved on-time delivery metrics in 2024.
Inventory policies must balance higher service-level targets against tied-up working capital, while close vendor partnerships secure strategic parts and prioritised allocation.
- freight pressure — impacts margins and lead times
- chip/component scarcity — affects production continuity
- dual-sourcing & redesign — mitigates single-source risk
- inventory vs working capital — trade-off for service levels
- vendor partnerships — secure strategic allocations
EU Fit for 55 & US IRA USD 369B boost dehumidifiers demand; tariffs raise costs
Munters faces cyclical demand as food, pharma and hyperscaler capex (hyperscaler/cloud ~150 billion USD p.a. in 2023–24) drive order volatility. Currency swings—SEK ~10% vs USD and ~6% vs EUR in 2024—plus input inflation (steel/aluminum down ~8–12% in 2024 but above 2021) pressure margins. Higher rates (Fed 5.25–5.50% mid‑2025) raise customer WACC and delay projects. Energy at ~0.14 EUR/kWh in 2024 boosts ROI for efficient systems.
Same Document Delivered
Munters AB PESTLE Analysis
The Munters AB PESTLE Analysis preview shown here is the exact document you’ll receive after purchase—fully formatted and ready to use. It includes political, economic, social, technological, legal, and environmental assessments tailored to Munters AB. No placeholders, no surprises. Download the final file immediately after checkout.
Description
Make Smarter Strategic Decisions with a Complete PESTEL View
Unlock how political, economic, social, technological, legal and environmental forces are reshaping Munters AB and its market position. Our concise PESTLE highlights risks and growth levers for investors, strategists and consultants. Purchase the full analysis for detailed, actionable insights you can deploy immediately.
Political factors
Energy policy incentives
Shifts like the EU Fit for 55 (55% emissions cut by 2030) and US Inflation Reduction Act (about $369 billion for clean energy) boost demand for Munters dehumidification and high-efficiency climate systems in food, pharma and data centers; subsidies, tax credits and public tenders speed adoption. Sudden policy reversals or budget cuts can delay orders and lengthen sales cycles. Monitoring green industrial strategies and the EU Green Deal mobilizing ~€1 trillion through the decade helps prioritize bids and capacity.
Trade and tariffs
Tariffs on metals, electronics or HVAC components directly raise Munters’ input costs and pricing pressure; for example US Section 232 steel tariffs remain at up to 25%, lifting steel-based component costs. Geopolitical tensions disrupt cross-border flows, extending lead times and driving higher safety stock. Regionalization and friend-shoring may force supplier duplication, potentially increasing sourcing costs an estimated 5–15%, so Munters hedges by qualifying multi-region vendors.
Public infrastructure programs
Government-backed data center, healthcare and cold-chain investments create steady public project pipelines for climate control and dehumidification, with procurement cycles often spanning 6–24 months. Procurement rules favor certified, energy-efficient equipment and proven vendors, raising technical spec thresholds. Longer administrative timelines can shift revenue recognition and cashflow timing. Aligning product specs with public standards materially increases win rates.
Geopolitical risk
Geopolitical conflicts and sanctions can directly restrict Munters ABs sales, service access and project financing in affected regions, driving customers—especially in emerging markets—to postpone capex and extend procurement cycles. Logistics disruptions raise freight and insurance costs and can delay spare-part delivery, while scenario planning helps allocate inventory and deploy service teams to maintain uptime.
- Sanctions/restrictions: limit market access
- Capex delays: higher in emerging markets
- Logistics: increased cost and unreliability
- Mitigation: scenario planning for inventory/service
Industrial policy competition
Industrial policy competition shapes Munters AB bids as national local-content rules can tilt procurement toward domestic HVAC suppliers; Munters reported group net sales of about SEK 7.8 billion in 2024, increasing exposure to such policies in key markets.
Export credit agency support for competitors on large projects improves their pricing power; OECD data show official export credit commitments exceeded USD 130 billion in 2024, raising contestability on large EPC contracts.
Active engagement with trade bodies lets Munters influence standards favoring energy-efficient solutions and chillers, while local assembly hubs reduce tariff and local-content disadvantages in markets with procurement preferences.
- Local-content rules: can bias bids in favor of domestic suppliers
- Export credit: OECD official commitments > USD 130B (2024)
- Standards: trade-body engagement shapes energy-efficiency requirements
- Mitigation: local assembly lowers policy-driven competitive gaps
EU Fit for 55 & US IRA USD 369B boost dehumidifiers demand; tariffs raise costs
EU Fit for 55 and US IRA (≈USD 369 billion) accelerate demand for energy-efficient dehumidification; Munters reported group net sales ~SEK 7.8bn (2024). US Section 232 steel tariffs (up to 25%) and friend-shoring can raise sourcing costs ~5–15%, extending lead times. OECD export credit commitments >USD 130bn (2024) increase competition on large EPC projects.
| Political factor | Metric/2024–25 | Impact on Munters |
|---|---|---|
| Green policies | IRA USD 369B; EU Fit for 55 | ↑project pipeline, higher spec demand |
| Tariffs | US steel up to 25% | ↑input costs, pricing pressure |
| Export credit | OECD >USD130B | ↑competitor bidding power |
What is included in the product
Detailed Word Document
Explores how Political, Economic, Social, Technological, Environmental and Legal forces uniquely impact Munters AB, with data-backed trends and region- and industry-specific examples. Designed for executives and investors, it offers forward-looking insights, scenario cues and ready-to-insert findings for strategic planning.
Customizable Excel Spreadsheet
A concise, PESTLE‑segmented summary of Munters AB that clarifies external risks and opportunities for quick reference in meetings, presentations, or client reports; editable notes let teams adapt insights to their region or business unit.
Economic factors
Capex cycles
Capex cycles in food processing, pharma and data center expansions drive Munters AB order intake volatility as these end-markets are cyclical; hyperscaler/cloud capex surged to roughly 150 billion USD annually around 2023–24, creating step-changes in demand for cooling and dehumidification equipment.
Conversely, macro downturns and inventory corrections rapidly compress Munters backlog and shipments, while investments in flexible, modular manufacturing and configurable product lines help buffer cycle volatility and shorten lead times.
FX and inflation
Munters faces currency risk across SEK, EUR, USD and CNY as commercial and manufacturing flows span Europe, North America and China; FX moves in 2024 saw SEK fluctuate ~10% vs USD and ~6% vs EUR, amplifying translation and transaction exposure. Input inflation in steel, aluminum and electronics pressured margins—global steel and aluminum prices fell roughly 8–12% in 2024 but input costs remain above 2021 levels. Pricing escalators and hedges (typically covering up to 12 months) blunt volatility, yet lag effects persist and squeeze near-term EBIT. Disciplined regional pricing and cost pass-through are essential to protect operating margin.
Interest rates
Higher policy rates (US Fed funds 5.25–5.50% and Riksbank ~4.00% in mid‑2025) raise customer WACC, causing non‑critical HVAC upgrades to be deferred and slowing Munters AB order flow; project financing costs can postpone large retrofits given typical commercial loan spreads of 200–400 bps. As rates ease, energy‑savings ROI improves and deal velocity can rise; leasing or performance contracts bridge tight credit cycles.
Energy prices
Supply chain costs
Supply chain costs for Munters are pressured by elevated freight and lingering chip and component scarcity, increasing delivery times and cost-to-serve across HVAC and air-treatment product lines.
Dual-sourcing, strategic redesigns and longer lead-time buys have reduced bottlenecks and improved on-time delivery metrics in 2024.
Inventory policies must balance higher service-level targets against tied-up working capital, while close vendor partnerships secure strategic parts and prioritised allocation.
- freight pressure — impacts margins and lead times
- chip/component scarcity — affects production continuity
- dual-sourcing & redesign — mitigates single-source risk
- inventory vs working capital — trade-off for service levels
- vendor partnerships — secure strategic allocations
EU Fit for 55 & US IRA USD 369B boost dehumidifiers demand; tariffs raise costs
Munters faces cyclical demand as food, pharma and hyperscaler capex (hyperscaler/cloud ~150 billion USD p.a. in 2023–24) drive order volatility. Currency swings—SEK ~10% vs USD and ~6% vs EUR in 2024—plus input inflation (steel/aluminum down ~8–12% in 2024 but above 2021) pressure margins. Higher rates (Fed 5.25–5.50% mid‑2025) raise customer WACC and delay projects. Energy at ~0.14 EUR/kWh in 2024 boosts ROI for efficient systems.
Same Document Delivered
Munters AB PESTLE Analysis
The Munters AB PESTLE Analysis preview shown here is the exact document you’ll receive after purchase—fully formatted and ready to use. It includes political, economic, social, technological, legal, and environmental assessments tailored to Munters AB. No placeholders, no surprises. Download the final file immediately after checkout.











