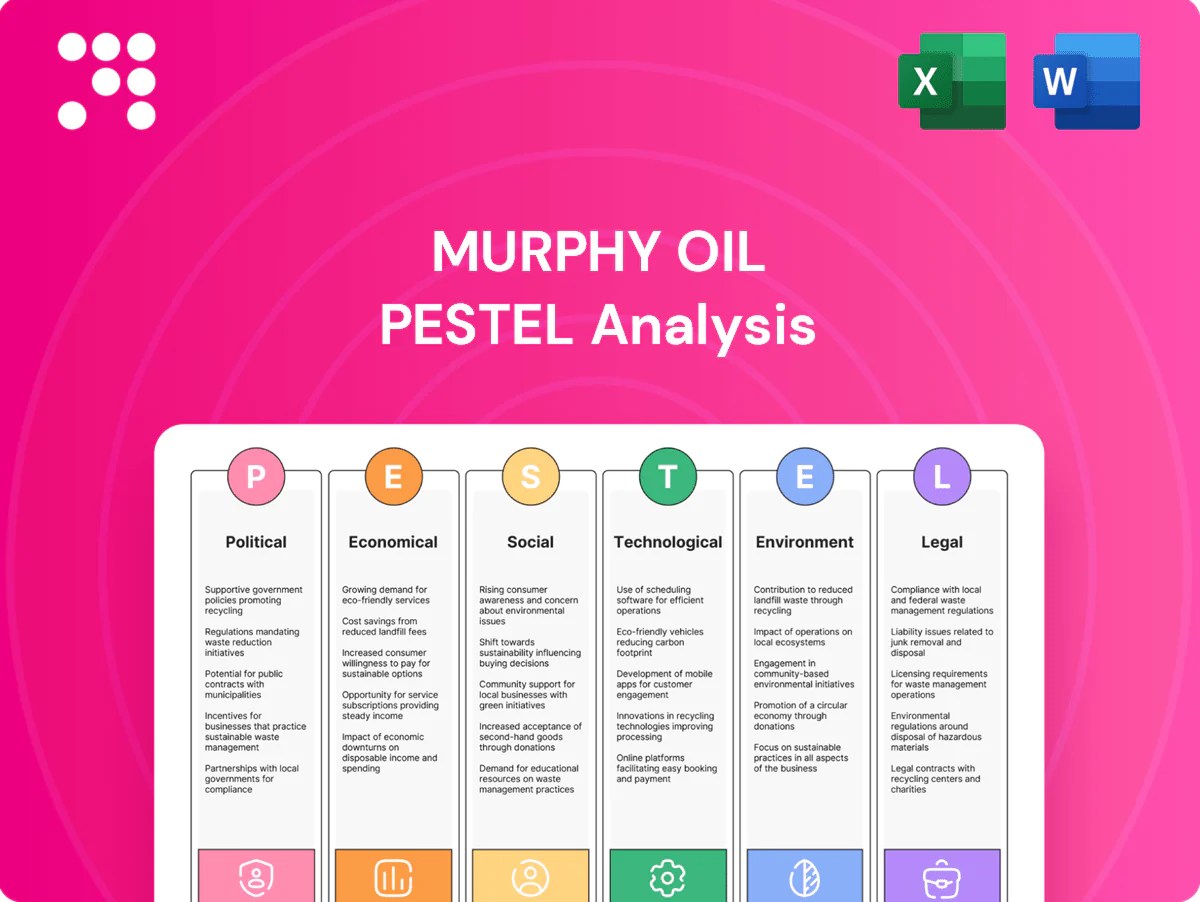
Murphy Oil PESTLE Analysis

Your Shortcut to Market Insight Starts Here
Our PESTLE Analysis of Murphy Oil reveals how political shifts, economic cycles, and environmental rules shape strategic risks and opportunities. Ideal for investors and strategists, it delivers actionable, up-to-date insights. Buy the full report to access the complete, editable analysis now.
Political factors

US energy policy shifts
Federal priorities on leasing, permitting and emissions directly shape onshore and Gulf of Mexico activity; US crude production averaged about 12.4 million b/d in 2024 with Gulf output near 1.6 million b/d (EIA), so federal lease and permit decisions materially affect volumes. Administrations can tighten methane rules (EPA finalized new oil/gas methane standards in 2023) or pause leases, changing drilling cadence. Policy stability enables multi-year project planning; abrupt shifts raise execution and cost risk, so Murphy must keep optionality across basins to buffer swings.
Canada provincial-federal dynamics
Royalties, carbon pricing and Indigenous consultation differ by province—royalty regimes can swing materially with Alberta/Saskatchewan regimes adjusting effective rates up to ~40% by price band, while the federal carbon price was CAD 65/t in 2023 and is scheduled to rise to CAD 170/t by 2030. Federal climate targets sometimes clash with provinces pursuing competitiveness, altering project NPV and break-evens. Constructive First Nations engagement is essential for access and can add 12–36 months to timelines. Stable, transparent frameworks reduce risk for long-cycle upstream investments.

Brazil local content and licensing
ANP licensing rules and local content quotas directly raise offshore project costs and extend schedules for Murphy Oil; Brazil produced about 3.2 million bpd in 2024, keeping pre-salt activity high and competition for local supply tight. Government emphasis on domestic industry under recent administrations has tightened procurement flexibility and often requires higher Brazilian-sourced inputs. Currency volatility (BRL swung roughly 10–15% in 2023–24) and political cycles add approval-timing risk for contracts and CAPEX. Strong local partnerships historically improve compliance, speed execution and reduce penalty exposure.

Southeast Asia geopolitical and fiscal risk
Changes to production-sharing contract terms, local content rules or export policies in Southeast Asia can materially alter realized value for Murphy Oil; ASEAN GDP grew about 4.6% in 2024, underscoring fiscal shifts and revenue needs that drive policy changes. Maritime boundary disputes and election cycles (Indonesia presidential election May 2024, Malaysia GE 2022) can delay permitting and access to fields. Reliable state counterparties affect timing of cash flows, so geographic diversification reduces single-country exposure and sovereign-concentration risk.
- PSC/national content/export policy risk
- Permitting affected by maritime disputes & election timing
- State counterparty reliability drives cash-flow predictability
- Diversification lowers single-country concentration
Trade, sanctions, and geopolitics
Global tensions continue to disrupt crude flows, service availability, and insurance access, with persistent Russia-related measures and Middle East flare-ups constraining logistics and raising premiums for offshore operations.
Expanding sanctions regimes increase counterparty and compliance complexity for Murphy Oil, while redirected supplies shift regional differentials and compress netbacks on some barrels.
Proactive compliance, diversified service partners, and agile marketing of grades help mitigate price and supply shocks.
- Geopolitics raise insurance/service costs
- Sanctions increase compliance and counterparty risk
- Supply redirections affect regional differentials/netbacks
- Compliance + agility = shock mitigation
Policy shifts reshape US, Canada, Brazil oil: leasing, carbon costs, BRL volatility, geopolitics
Federal leasing, methane rules and permitting in US (crude ~12.4m b/d in 2024) directly affect Gulf/onshore activity; policy shifts change drilling cadence and costs. Canadian royalty/carbon (CAD65/t 2023; CAD170/t by 2030) and Indigenous consultations alter NPV and timelines. Brazil pre-salt/local content and BRL volatility (≈10–15% 2023–24) raise costs; geopolitics/sanctions increase insurance and compliance burden.
| Factor | Key metric | Impact |
|---|---|---|
| US leasing | 12.4m b/d (2024) | Drilling cadence |
| Canada | CAD65/t (2023) → CAD170/t (2030) | Higher break-evens |
| Brazil | 3.2m bpd (2024); BRL ±10–15% | Cost/schedule |
| Geopolitics | Sanctions/flare-ups | Insurance/compliance |
What is included in the product
 Detailed Word Document
Explores how external macro-environmental factors uniquely affect Murphy Oil across Political, Economic, Social, Technological, Environmental and Legal dimensions, with data-backed trends and forward-looking insights to inform strategic planning and scenario analysis for executives, investors and advisors.

 Customizable Excel Spreadsheet
A clean, summarized Murphy Oil PESTLE that’s visually segmented by category for quick interpretation, ideal for meeting briefings or slide insertion; editable notes let teams adapt risks and opportunities to regional operations and business lines for faster alignment and decision-making.
Economic factors

Oil and gas price volatility
Murphy Oil's cash flow, capex and shareholder returns track realized prices: Brent averaged about $86/bbl in 2024 and Henry Hub near $2.75/MMBtu, directly affecting free cash flow. OPEC+ voluntary cuts of roughly 3.6 million b/d since 2023, US shale rapid responsiveness and demand cycles keep prices volatile. Hedging programs smooth cash but cap upside, while a balanced mix of oil, gas and NGLs reduces earnings swings.
Service cost inflation
Rigs, frac crews and tubulars saw cyclical tightness as the US rig count recovered to roughly 650 rigs by 2024, pressuring well costs and dayrates. Supply-chain bottlenecks extended cycle times and procurement lead times for tubulars and frac equipment. Long-term service contracts and standardization helped cap cost volatility. Efficiency gains must outpace service-cost inflation to protect margins.

Interest rates and capital access
Higher interest rates (US 10-year ~4.2% mid-2025) raise Murphy Oil’s debt costs and project hurdle rates, tightening returns thresholds. Credit and equity market risk appetite affects funding flexibility; stronger markets lower refinancing risk. Murphy’s 2024 free cash flow (~$1.3bn) and disciplined capital allocation have funded buybacks and deleveraging, with net debt/EBITDA near 0.8x supporting investment‑grade‑like WACC benefits.

FX exposure (USD/CAD/BRL)
Murphy Oil's revenues are largely USD-linked while operating costs in CAD and BRL create basis risk; mid‑2025 FX levels: USD/CAD ~1.35, USD/BRL ~5.0. Depreciating CAD/BRL can lower local opex but volatility complicates capex and cash‑flow planning; selective hedging stabilizes budgets. FX translation swings also affect reported earnings and leverage ratios.
- USD revenue vs CAD/BRL costs: basis risk
- USD/CAD ~1.35; USD/BRL ~5.0 (mid‑2025)
- Hedging used to smooth budgets and leverage effects
Global demand and transition pace
Global growth, petrochemicals and transport fuels underpin oil demand; IEA estimates ~101 million barrels/day in 2024, up ~0.7 mb/d year-on-year.
Efficiency gains and rising EV adoption (global EV stock ~35–40 million by 2024) temper long-term growth, but near-term demand remains resilient.
Natural gas demand swings with weather and LNG flows (global LNG trade ~520 million tonnes in 2024); Murphy uses scenario planning to guide asset life and reinvestment.
- Economic growth: demand base ~101 mb/d (2024)
- EVs/efficiency: EV stock ~35–40m (2024)
- Gas/LNG: ~520 Mt LNG trade (2024)
- Strategy: scenario planning for asset life/reinvestment
Policy shifts reshape US, Canada, Brazil oil: leasing, carbon costs, BRL volatility, geopolitics
Murphy’s cash flow and shareholder returns remain tightly tied to realized prices (Brent ~$86/bbl 2024; HH ~$2.75/MMBtu), with hedges smoothing volatility but capping upside. Service-cost inflation from a ~650 US rig count in 2024 and higher funding costs (US 10y ~4.2% mid‑2025) pressure project hurdles. FX (USD/CAD ~1.35; USD/BRL ~5.0) and disciplined capex (FCF ~$1.3bn; net debt/EBITDA ~0.8x) underpin strategy.
| Metric | Value |
|---|---|
| Brent 2024 | $86/bbl |
| HH 2024 | $2.75/MMBtu |
| US 10y mid‑2025 | ~4.2% |
| FCF 2024 | $1.3bn |
| Net debt/EBITDA | ~0.8x |
| USD/CAD | ~1.35 |
| USD/BRL | ~5.0 |
Same Document Delivered
Murphy Oil PESTLE Analysis
The preview shown here is the exact Murphy Oil PESTLE Analysis you’ll receive after purchase—fully formatted and ready to use. This is the real, finished file with all sections and insights included. No placeholders or teasers; download the identical document immediately after payment.

Your Shortcut to Market Insight Starts Here
Our PESTLE Analysis of Murphy Oil reveals how political shifts, economic cycles, and environmental rules shape strategic risks and opportunities. Ideal for investors and strategists, it delivers actionable, up-to-date insights. Buy the full report to access the complete, editable analysis now.
Political factors
US energy policy shifts
Federal priorities on leasing, permitting and emissions directly shape onshore and Gulf of Mexico activity; US crude production averaged about 12.4 million b/d in 2024 with Gulf output near 1.6 million b/d (EIA), so federal lease and permit decisions materially affect volumes. Administrations can tighten methane rules (EPA finalized new oil/gas methane standards in 2023) or pause leases, changing drilling cadence. Policy stability enables multi-year project planning; abrupt shifts raise execution and cost risk, so Murphy must keep optionality across basins to buffer swings.
Canada provincial-federal dynamics
Royalties, carbon pricing and Indigenous consultation differ by province—royalty regimes can swing materially with Alberta/Saskatchewan regimes adjusting effective rates up to ~40% by price band, while the federal carbon price was CAD 65/t in 2023 and is scheduled to rise to CAD 170/t by 2030. Federal climate targets sometimes clash with provinces pursuing competitiveness, altering project NPV and break-evens. Constructive First Nations engagement is essential for access and can add 12–36 months to timelines. Stable, transparent frameworks reduce risk for long-cycle upstream investments.
Brazil local content and licensing
ANP licensing rules and local content quotas directly raise offshore project costs and extend schedules for Murphy Oil; Brazil produced about 3.2 million bpd in 2024, keeping pre-salt activity high and competition for local supply tight. Government emphasis on domestic industry under recent administrations has tightened procurement flexibility and often requires higher Brazilian-sourced inputs. Currency volatility (BRL swung roughly 10–15% in 2023–24) and political cycles add approval-timing risk for contracts and CAPEX. Strong local partnerships historically improve compliance, speed execution and reduce penalty exposure.
Southeast Asia geopolitical and fiscal risk
Changes to production-sharing contract terms, local content rules or export policies in Southeast Asia can materially alter realized value for Murphy Oil; ASEAN GDP grew about 4.6% in 2024, underscoring fiscal shifts and revenue needs that drive policy changes. Maritime boundary disputes and election cycles (Indonesia presidential election May 2024, Malaysia GE 2022) can delay permitting and access to fields. Reliable state counterparties affect timing of cash flows, so geographic diversification reduces single-country exposure and sovereign-concentration risk.
- PSC/national content/export policy risk
- Permitting affected by maritime disputes & election timing
- State counterparty reliability drives cash-flow predictability
- Diversification lowers single-country concentration
Trade, sanctions, and geopolitics
Global tensions continue to disrupt crude flows, service availability, and insurance access, with persistent Russia-related measures and Middle East flare-ups constraining logistics and raising premiums for offshore operations.
Expanding sanctions regimes increase counterparty and compliance complexity for Murphy Oil, while redirected supplies shift regional differentials and compress netbacks on some barrels.
Proactive compliance, diversified service partners, and agile marketing of grades help mitigate price and supply shocks.
- Geopolitics raise insurance/service costs
- Sanctions increase compliance and counterparty risk
- Supply redirections affect regional differentials/netbacks
- Compliance + agility = shock mitigation
Policy shifts reshape US, Canada, Brazil oil: leasing, carbon costs, BRL volatility, geopolitics
Federal leasing, methane rules and permitting in US (crude ~12.4m b/d in 2024) directly affect Gulf/onshore activity; policy shifts change drilling cadence and costs. Canadian royalty/carbon (CAD65/t 2023; CAD170/t by 2030) and Indigenous consultations alter NPV and timelines. Brazil pre-salt/local content and BRL volatility (≈10–15% 2023–24) raise costs; geopolitics/sanctions increase insurance and compliance burden.
| Factor | Key metric | Impact |
|---|---|---|
| US leasing | 12.4m b/d (2024) | Drilling cadence |
| Canada | CAD65/t (2023) → CAD170/t (2030) | Higher break-evens |
| Brazil | 3.2m bpd (2024); BRL ±10–15% | Cost/schedule |
| Geopolitics | Sanctions/flare-ups | Insurance/compliance |
What is included in the product
Detailed Word Document
Explores how external macro-environmental factors uniquely affect Murphy Oil across Political, Economic, Social, Technological, Environmental and Legal dimensions, with data-backed trends and forward-looking insights to inform strategic planning and scenario analysis for executives, investors and advisors.
Customizable Excel Spreadsheet
A clean, summarized Murphy Oil PESTLE that’s visually segmented by category for quick interpretation, ideal for meeting briefings or slide insertion; editable notes let teams adapt risks and opportunities to regional operations and business lines for faster alignment and decision-making.
Economic factors
Oil and gas price volatility
Murphy Oil's cash flow, capex and shareholder returns track realized prices: Brent averaged about $86/bbl in 2024 and Henry Hub near $2.75/MMBtu, directly affecting free cash flow. OPEC+ voluntary cuts of roughly 3.6 million b/d since 2023, US shale rapid responsiveness and demand cycles keep prices volatile. Hedging programs smooth cash but cap upside, while a balanced mix of oil, gas and NGLs reduces earnings swings.
Service cost inflation
Rigs, frac crews and tubulars saw cyclical tightness as the US rig count recovered to roughly 650 rigs by 2024, pressuring well costs and dayrates. Supply-chain bottlenecks extended cycle times and procurement lead times for tubulars and frac equipment. Long-term service contracts and standardization helped cap cost volatility. Efficiency gains must outpace service-cost inflation to protect margins.
Interest rates and capital access
Higher interest rates (US 10-year ~4.2% mid-2025) raise Murphy Oil’s debt costs and project hurdle rates, tightening returns thresholds. Credit and equity market risk appetite affects funding flexibility; stronger markets lower refinancing risk. Murphy’s 2024 free cash flow (~$1.3bn) and disciplined capital allocation have funded buybacks and deleveraging, with net debt/EBITDA near 0.8x supporting investment‑grade‑like WACC benefits.
FX exposure (USD/CAD/BRL)
Murphy Oil's revenues are largely USD-linked while operating costs in CAD and BRL create basis risk; mid‑2025 FX levels: USD/CAD ~1.35, USD/BRL ~5.0. Depreciating CAD/BRL can lower local opex but volatility complicates capex and cash‑flow planning; selective hedging stabilizes budgets. FX translation swings also affect reported earnings and leverage ratios.
- USD revenue vs CAD/BRL costs: basis risk
- USD/CAD ~1.35; USD/BRL ~5.0 (mid‑2025)
- Hedging used to smooth budgets and leverage effects
Global demand and transition pace
Global growth, petrochemicals and transport fuels underpin oil demand; IEA estimates ~101 million barrels/day in 2024, up ~0.7 mb/d year-on-year.
Efficiency gains and rising EV adoption (global EV stock ~35–40 million by 2024) temper long-term growth, but near-term demand remains resilient.
Natural gas demand swings with weather and LNG flows (global LNG trade ~520 million tonnes in 2024); Murphy uses scenario planning to guide asset life and reinvestment.
- Economic growth: demand base ~101 mb/d (2024)
- EVs/efficiency: EV stock ~35–40m (2024)
- Gas/LNG: ~520 Mt LNG trade (2024)
- Strategy: scenario planning for asset life/reinvestment
Policy shifts reshape US, Canada, Brazil oil: leasing, carbon costs, BRL volatility, geopolitics
Murphy’s cash flow and shareholder returns remain tightly tied to realized prices (Brent ~$86/bbl 2024; HH ~$2.75/MMBtu), with hedges smoothing volatility but capping upside. Service-cost inflation from a ~650 US rig count in 2024 and higher funding costs (US 10y ~4.2% mid‑2025) pressure project hurdles. FX (USD/CAD ~1.35; USD/BRL ~5.0) and disciplined capex (FCF ~$1.3bn; net debt/EBITDA ~0.8x) underpin strategy.
| Metric | Value |
|---|---|
| Brent 2024 | $86/bbl |
| HH 2024 | $2.75/MMBtu |
| US 10y mid‑2025 | ~4.2% |
| FCF 2024 | $1.3bn |
| Net debt/EBITDA | ~0.8x |
| USD/CAD | ~1.35 |
| USD/BRL | ~5.0 |
Same Document Delivered
Murphy Oil PESTLE Analysis
The preview shown here is the exact Murphy Oil PESTLE Analysis you’ll receive after purchase—fully formatted and ready to use. This is the real, finished file with all sections and insights included. No placeholders or teasers; download the identical document immediately after payment.
Description
Your Shortcut to Market Insight Starts Here
Our PESTLE Analysis of Murphy Oil reveals how political shifts, economic cycles, and environmental rules shape strategic risks and opportunities. Ideal for investors and strategists, it delivers actionable, up-to-date insights. Buy the full report to access the complete, editable analysis now.
Political factors
US energy policy shifts
Federal priorities on leasing, permitting and emissions directly shape onshore and Gulf of Mexico activity; US crude production averaged about 12.4 million b/d in 2024 with Gulf output near 1.6 million b/d (EIA), so federal lease and permit decisions materially affect volumes. Administrations can tighten methane rules (EPA finalized new oil/gas methane standards in 2023) or pause leases, changing drilling cadence. Policy stability enables multi-year project planning; abrupt shifts raise execution and cost risk, so Murphy must keep optionality across basins to buffer swings.
Canada provincial-federal dynamics
Royalties, carbon pricing and Indigenous consultation differ by province—royalty regimes can swing materially with Alberta/Saskatchewan regimes adjusting effective rates up to ~40% by price band, while the federal carbon price was CAD 65/t in 2023 and is scheduled to rise to CAD 170/t by 2030. Federal climate targets sometimes clash with provinces pursuing competitiveness, altering project NPV and break-evens. Constructive First Nations engagement is essential for access and can add 12–36 months to timelines. Stable, transparent frameworks reduce risk for long-cycle upstream investments.
Brazil local content and licensing
ANP licensing rules and local content quotas directly raise offshore project costs and extend schedules for Murphy Oil; Brazil produced about 3.2 million bpd in 2024, keeping pre-salt activity high and competition for local supply tight. Government emphasis on domestic industry under recent administrations has tightened procurement flexibility and often requires higher Brazilian-sourced inputs. Currency volatility (BRL swung roughly 10–15% in 2023–24) and political cycles add approval-timing risk for contracts and CAPEX. Strong local partnerships historically improve compliance, speed execution and reduce penalty exposure.
Southeast Asia geopolitical and fiscal risk
Changes to production-sharing contract terms, local content rules or export policies in Southeast Asia can materially alter realized value for Murphy Oil; ASEAN GDP grew about 4.6% in 2024, underscoring fiscal shifts and revenue needs that drive policy changes. Maritime boundary disputes and election cycles (Indonesia presidential election May 2024, Malaysia GE 2022) can delay permitting and access to fields. Reliable state counterparties affect timing of cash flows, so geographic diversification reduces single-country exposure and sovereign-concentration risk.
- PSC/national content/export policy risk
- Permitting affected by maritime disputes & election timing
- State counterparty reliability drives cash-flow predictability
- Diversification lowers single-country concentration
Trade, sanctions, and geopolitics
Global tensions continue to disrupt crude flows, service availability, and insurance access, with persistent Russia-related measures and Middle East flare-ups constraining logistics and raising premiums for offshore operations.
Expanding sanctions regimes increase counterparty and compliance complexity for Murphy Oil, while redirected supplies shift regional differentials and compress netbacks on some barrels.
Proactive compliance, diversified service partners, and agile marketing of grades help mitigate price and supply shocks.
- Geopolitics raise insurance/service costs
- Sanctions increase compliance and counterparty risk
- Supply redirections affect regional differentials/netbacks
- Compliance + agility = shock mitigation
Policy shifts reshape US, Canada, Brazil oil: leasing, carbon costs, BRL volatility, geopolitics
Federal leasing, methane rules and permitting in US (crude ~12.4m b/d in 2024) directly affect Gulf/onshore activity; policy shifts change drilling cadence and costs. Canadian royalty/carbon (CAD65/t 2023; CAD170/t by 2030) and Indigenous consultations alter NPV and timelines. Brazil pre-salt/local content and BRL volatility (≈10–15% 2023–24) raise costs; geopolitics/sanctions increase insurance and compliance burden.
| Factor | Key metric | Impact |
|---|---|---|
| US leasing | 12.4m b/d (2024) | Drilling cadence |
| Canada | CAD65/t (2023) → CAD170/t (2030) | Higher break-evens |
| Brazil | 3.2m bpd (2024); BRL ±10–15% | Cost/schedule |
| Geopolitics | Sanctions/flare-ups | Insurance/compliance |
What is included in the product
Detailed Word Document
Explores how external macro-environmental factors uniquely affect Murphy Oil across Political, Economic, Social, Technological, Environmental and Legal dimensions, with data-backed trends and forward-looking insights to inform strategic planning and scenario analysis for executives, investors and advisors.
Customizable Excel Spreadsheet
A clean, summarized Murphy Oil PESTLE that’s visually segmented by category for quick interpretation, ideal for meeting briefings or slide insertion; editable notes let teams adapt risks and opportunities to regional operations and business lines for faster alignment and decision-making.
Economic factors
Oil and gas price volatility
Murphy Oil's cash flow, capex and shareholder returns track realized prices: Brent averaged about $86/bbl in 2024 and Henry Hub near $2.75/MMBtu, directly affecting free cash flow. OPEC+ voluntary cuts of roughly 3.6 million b/d since 2023, US shale rapid responsiveness and demand cycles keep prices volatile. Hedging programs smooth cash but cap upside, while a balanced mix of oil, gas and NGLs reduces earnings swings.
Service cost inflation
Rigs, frac crews and tubulars saw cyclical tightness as the US rig count recovered to roughly 650 rigs by 2024, pressuring well costs and dayrates. Supply-chain bottlenecks extended cycle times and procurement lead times for tubulars and frac equipment. Long-term service contracts and standardization helped cap cost volatility. Efficiency gains must outpace service-cost inflation to protect margins.
Interest rates and capital access
Higher interest rates (US 10-year ~4.2% mid-2025) raise Murphy Oil’s debt costs and project hurdle rates, tightening returns thresholds. Credit and equity market risk appetite affects funding flexibility; stronger markets lower refinancing risk. Murphy’s 2024 free cash flow (~$1.3bn) and disciplined capital allocation have funded buybacks and deleveraging, with net debt/EBITDA near 0.8x supporting investment‑grade‑like WACC benefits.
FX exposure (USD/CAD/BRL)
Murphy Oil's revenues are largely USD-linked while operating costs in CAD and BRL create basis risk; mid‑2025 FX levels: USD/CAD ~1.35, USD/BRL ~5.0. Depreciating CAD/BRL can lower local opex but volatility complicates capex and cash‑flow planning; selective hedging stabilizes budgets. FX translation swings also affect reported earnings and leverage ratios.
- USD revenue vs CAD/BRL costs: basis risk
- USD/CAD ~1.35; USD/BRL ~5.0 (mid‑2025)
- Hedging used to smooth budgets and leverage effects
Global demand and transition pace
Global growth, petrochemicals and transport fuels underpin oil demand; IEA estimates ~101 million barrels/day in 2024, up ~0.7 mb/d year-on-year.
Efficiency gains and rising EV adoption (global EV stock ~35–40 million by 2024) temper long-term growth, but near-term demand remains resilient.
Natural gas demand swings with weather and LNG flows (global LNG trade ~520 million tonnes in 2024); Murphy uses scenario planning to guide asset life and reinvestment.
- Economic growth: demand base ~101 mb/d (2024)
- EVs/efficiency: EV stock ~35–40m (2024)
- Gas/LNG: ~520 Mt LNG trade (2024)
- Strategy: scenario planning for asset life/reinvestment
Policy shifts reshape US, Canada, Brazil oil: leasing, carbon costs, BRL volatility, geopolitics
Murphy’s cash flow and shareholder returns remain tightly tied to realized prices (Brent ~$86/bbl 2024; HH ~$2.75/MMBtu), with hedges smoothing volatility but capping upside. Service-cost inflation from a ~650 US rig count in 2024 and higher funding costs (US 10y ~4.2% mid‑2025) pressure project hurdles. FX (USD/CAD ~1.35; USD/BRL ~5.0) and disciplined capex (FCF ~$1.3bn; net debt/EBITDA ~0.8x) underpin strategy.
| Metric | Value |
|---|---|
| Brent 2024 | $86/bbl |
| HH 2024 | $2.75/MMBtu |
| US 10y mid‑2025 | ~4.2% |
| FCF 2024 | $1.3bn |
| Net debt/EBITDA | ~0.8x |
| USD/CAD | ~1.35 |
| USD/BRL | ~5.0 |
Same Document Delivered
Murphy Oil PESTLE Analysis
The preview shown here is the exact Murphy Oil PESTLE Analysis you’ll receive after purchase—fully formatted and ready to use. This is the real, finished file with all sections and insights included. No placeholders or teasers; download the identical document immediately after payment.











