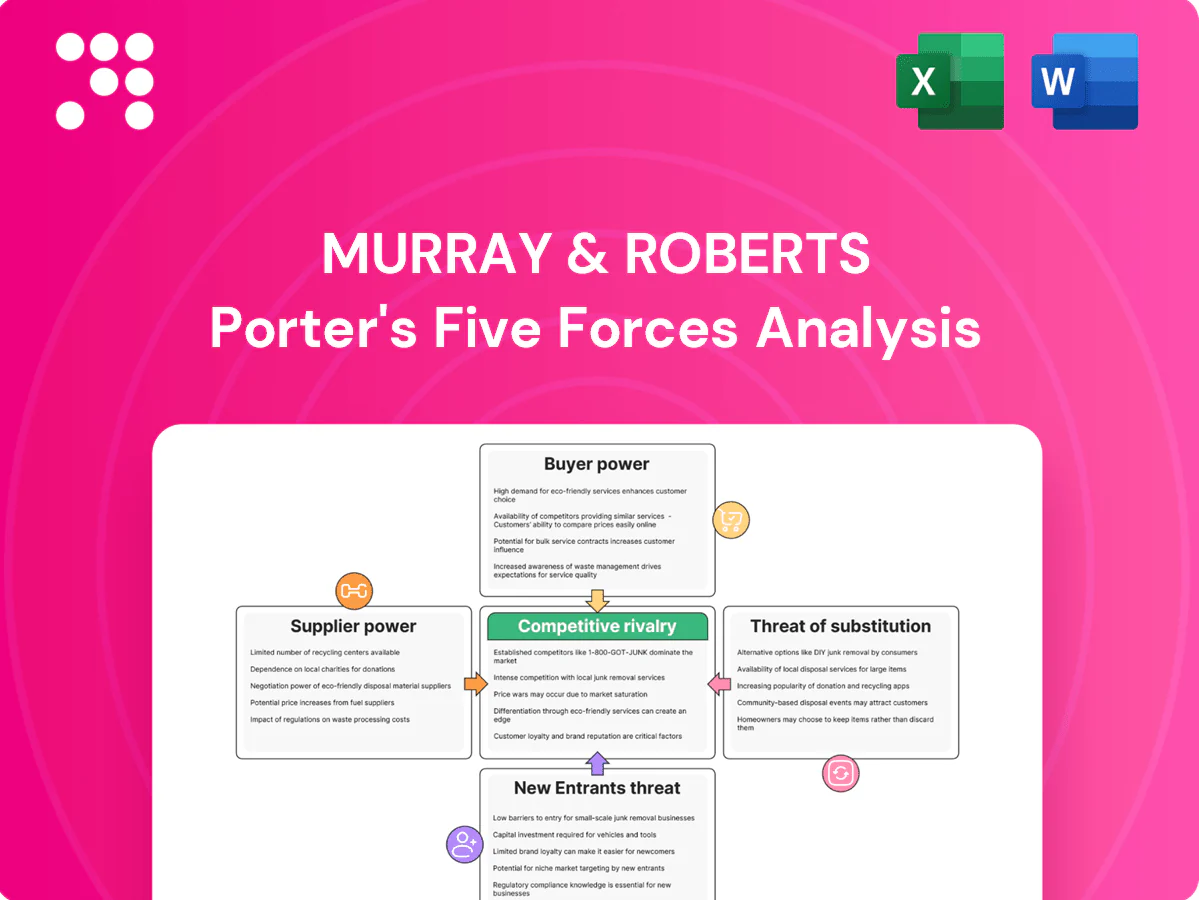
Murray & Roberts Porter's Five Forces Analysis

From Overview to Strategy Blueprint
Murray & Roberts faces complex competitive pressures across supplier leverage, buyer bargaining, new entrants, substitutes and rivalry—our snapshot highlights key drivers and vulnerabilities. The analysis shows where strategic focus can reduce risk and unlock value. Unlock the full Porter's Five Forces Analysis to explore Murray & Roberts’s competitive dynamics in detail. Get the complete report to inform smarter decisions.
Suppliers Bargaining Power

Specialized OEM concentration
High-end mining and energy equipment is concentrated among a few global OEMs—Caterpillar, Komatsu, Epiroc and Sandvik—giving suppliers outsized leverage and elevating switching costs; the global mining equipment market was about USD 47 billion in 2024. OEM lead times for major fleets commonly exceed 12 months and limited qualified alternatives allow suppliers to dictate pricing and delivery. Long certification cycles and 12–36 month warranty dependencies further entrench OEM influence, which Murray & Roberts offsets with frame agreements and selective multi-vendor qualification where feasible.
Critical materials volatility
Steel, cement and specialty-alloy prices proved volatile in 2024, swinging roughly 15–25% in key markets and allowing suppliers to pass through costs; bid-to-procurement timing gaps of 60–90 days commonly amplified exposure. Escalation clauses and hedging reduced reported cost-overrun incidence by about 30% in industry surveys, while local sourcing mandates—applying to roughly 40% of regional contracts—either diversified supply or constrained options depending on supplier depth.

Skilled subcontractor scarcity
Skilled subcontractor scarcity—notably shaft sinking, heavy lifting and instrumentation—creates regional capacity constraints that let niche firms command premiums of up to 15–20% during peak cycles in 2024. Performance bonds and back-to-back risk flow-downs partially rebalance power by transferring credit and performance exposure to subs. Murray & Roberts leverages strategic partner ecosystems to secure priority access and schedule resilience.

Logistics and remote site dependence
Remote mining and energy sites depend on limited logistics providers and corridors, giving upstream handlers elevated bargaining power as transport bottlenecks and port congestion in 2024 constrained delivery windows and capacity. Schedule penalties magnify the financial impact of delays, increasing contractors' exposure to liquidated damages. Early logistics engineering and multi-route planning materially reduce single-source dependency and delay risk.
- Limited carriers: increases supplier leverage
- Port congestion: tightens schedules, raises costs
- Penalties: amplify delay costs
- Mitigation: early logistics engineering, multi-route planning
Software and digital tool lock-in
Engineering platforms (BIM, design suites, digital twins) create ecosystem lock-in for Murray & Roberts, raising retraining and integration costs; major vendors like Autodesk reported revenue of about 5.33 billion USD in FY2024, underscoring vendor market power.
Data portability and licensing terms often favor vendors, while standardized data models and open APIs reduce switching friction; enterprise agreements help stabilize software spend across multi-year projects.
- Vendor concentration: Autodesk 2024 revenue 5.33B USD
- Risk: high retraining and integration costs
- Mitigation: open APIs and standardized data models
- Policy: enterprise agreements stabilize costs
Supplier power: OEMs USD 47B, lead times >12m, commodity swings
Suppliers hold high bargaining power: OEMs (market ~USD 47B in 2024) and engineering-software vendors (Autodesk revenue USD 5.33B in FY2024) create concentration and long lead times (>12 months), raising switching costs. Commodity price swings (steel/cement 15–25% in 2024) and local content rules (~40% of contracts) further strengthen suppliers. Niche subs command 15–20% premiums; logistics bottlenecks amplify schedule risk.
| Metric | 2024 Value |
|---|---|
| Mining equipment market | USD 47B |
| OEM lead times | >12 months |
| Steel/cement volatility | 15–25% |
| Local sourcing mandates | ~40% |
| Subcontractor premium | 15–20% |
| Autodesk revenue (FY2024) | USD 5.33B |
What is included in the product
 Detailed Word Document
Tailored analysis of Murray & Roberts that uncovers competitive drivers, supplier and buyer influence on pricing and profitability, barriers to entry protecting incumbents, and emerging threats or substitutes—ideal for investor materials, strategy decks, or academic use and fully editable for easy customization.

 Customizable Excel Spreadsheet
A concise, one-sheet Five Forces summary tailored to Murray & Roberts—instantly highlights competitive pressures and strategic levers, ready for decks or scenario tabs; no macros, fully editable to reflect new data or regulatory shifts.
Customers Bargaining Power

Highly concentrated blue-chip clients
Mining majors, oil & gas operators and utilities such as BHP, Rio Tinto, Shell, ExxonMobil and large state utilities are few but enormous, giving them strong bargaining power over contractors.
Their procurement teams run rigorous global tenders where procurement budgets often exceed $1bn and single contracts commonly top $100m, enabling steep price pressure and demanding SLAs.
Volume potential forces contractors to accept tight margins; referenceability and TRIFR/safety records (benchmarks often <1.0) are table stakes to even qualify.
Competitive tendering and risk transfer
Clients increasingly push EPC/EPCM deals with fixed-price elements and tight LDs, commonly 0.25–0.5%/week with caps of 5–10%, shifting cost risk to contractors.
Buyer-favourable risk allocation on geotech, interfaces and escalation drives claims; targeted pre-contract value engineering is a lever to reshape risk and reduce headline price.
Rigorous bid/no-bid discipline and quantified contingencies are essential to avoid value-destroying awards and margin erosion.

Payment terms and cash flow control
Buyers often push 60–120 day payment terms and stringent milestone acceptance, extending cash conversion cycles in 2024. Retentions and performance guarantees commonly consume 5–10% of contract value, shifting working capital to contractors. Robust project controls and milestone design can cut cash gaps by 20–40%. Early procurement advances and 5–10% mobilization fees soften liquidity pressure.

ESG, local content, and compliance demands
Clients now mandate stringent HSE and ESG reporting plus local participation, increasing delivery complexity and vendor qualification hurdles; 2024 industry surveys indicate roughly 70% of large project owners enforce formal ESG clauses, which raises procurement costs but improves win probability when supply chains are compliant.
Preference for alliances and frameworks
Preference for long-term frameworks and early contractor involvement in 2024 pushed buyers to compress margins while improving visibility and pipeline stability, making predictable revenue streams more valuable than spot margins. Performance KPIs increasingly determine share-of-wallet within frameworks, so relationship capital and demonstrable past performance now heavily influence awards and contract renewal.
- Frameworks/ECI drive predictable pipelines
- KPIs link performance to market share
- Relationship capital critical for awards
Large buyers squeeze margins via tenders, budgets >$1bn, ESG ~70%
Large buyers like BHP/Rio/Shell exert strong leverage via global tenders, big budgets (> $1bn) and contracts > $100m, forcing tight margins and risk transfer; 2024 surveys show ~70% enforce ESG clauses. Payment terms (60–120 days), retentions 5–10% and LDs 0.25–0.5%/week compress contractor cashflow. Frameworks/ECI reduce spot margins but increase pipeline visibility and KPI-driven awards.
| Metric | 2024 Value |
|---|---|
| Buyers with ESG clauses | ~70% |
| Payment terms | 60–120 days |
| Retentions | 5–10% |
Full Version Awaits
Murray & Roberts Porter's Five Forces Analysis
This preview is the exact Murray & Roberts Porter's Five Forces Analysis you will receive upon purchase—fully written, formatted and ready to use. It covers competitive rivalry, supplier and buyer power, threat of substitutes and entry with actionable insights. No placeholders or samples; instant download after payment.

From Overview to Strategy Blueprint
Murray & Roberts faces complex competitive pressures across supplier leverage, buyer bargaining, new entrants, substitutes and rivalry—our snapshot highlights key drivers and vulnerabilities. The analysis shows where strategic focus can reduce risk and unlock value. Unlock the full Porter's Five Forces Analysis to explore Murray & Roberts’s competitive dynamics in detail. Get the complete report to inform smarter decisions.
Suppliers Bargaining Power
Specialized OEM concentration
High-end mining and energy equipment is concentrated among a few global OEMs—Caterpillar, Komatsu, Epiroc and Sandvik—giving suppliers outsized leverage and elevating switching costs; the global mining equipment market was about USD 47 billion in 2024. OEM lead times for major fleets commonly exceed 12 months and limited qualified alternatives allow suppliers to dictate pricing and delivery. Long certification cycles and 12–36 month warranty dependencies further entrench OEM influence, which Murray & Roberts offsets with frame agreements and selective multi-vendor qualification where feasible.
Critical materials volatility
Steel, cement and specialty-alloy prices proved volatile in 2024, swinging roughly 15–25% in key markets and allowing suppliers to pass through costs; bid-to-procurement timing gaps of 60–90 days commonly amplified exposure. Escalation clauses and hedging reduced reported cost-overrun incidence by about 30% in industry surveys, while local sourcing mandates—applying to roughly 40% of regional contracts—either diversified supply or constrained options depending on supplier depth.
Skilled subcontractor scarcity
Skilled subcontractor scarcity—notably shaft sinking, heavy lifting and instrumentation—creates regional capacity constraints that let niche firms command premiums of up to 15–20% during peak cycles in 2024. Performance bonds and back-to-back risk flow-downs partially rebalance power by transferring credit and performance exposure to subs. Murray & Roberts leverages strategic partner ecosystems to secure priority access and schedule resilience.
Logistics and remote site dependence
Remote mining and energy sites depend on limited logistics providers and corridors, giving upstream handlers elevated bargaining power as transport bottlenecks and port congestion in 2024 constrained delivery windows and capacity. Schedule penalties magnify the financial impact of delays, increasing contractors' exposure to liquidated damages. Early logistics engineering and multi-route planning materially reduce single-source dependency and delay risk.
- Limited carriers: increases supplier leverage
- Port congestion: tightens schedules, raises costs
- Penalties: amplify delay costs
- Mitigation: early logistics engineering, multi-route planning
Software and digital tool lock-in
Engineering platforms (BIM, design suites, digital twins) create ecosystem lock-in for Murray & Roberts, raising retraining and integration costs; major vendors like Autodesk reported revenue of about 5.33 billion USD in FY2024, underscoring vendor market power.
Data portability and licensing terms often favor vendors, while standardized data models and open APIs reduce switching friction; enterprise agreements help stabilize software spend across multi-year projects.
- Vendor concentration: Autodesk 2024 revenue 5.33B USD
- Risk: high retraining and integration costs
- Mitigation: open APIs and standardized data models
- Policy: enterprise agreements stabilize costs
Supplier power: OEMs USD 47B, lead times >12m, commodity swings
Suppliers hold high bargaining power: OEMs (market ~USD 47B in 2024) and engineering-software vendors (Autodesk revenue USD 5.33B in FY2024) create concentration and long lead times (>12 months), raising switching costs. Commodity price swings (steel/cement 15–25% in 2024) and local content rules (~40% of contracts) further strengthen suppliers. Niche subs command 15–20% premiums; logistics bottlenecks amplify schedule risk.
| Metric | 2024 Value |
|---|---|
| Mining equipment market | USD 47B |
| OEM lead times | >12 months |
| Steel/cement volatility | 15–25% |
| Local sourcing mandates | ~40% |
| Subcontractor premium | 15–20% |
| Autodesk revenue (FY2024) | USD 5.33B |
What is included in the product
Detailed Word Document
Tailored analysis of Murray & Roberts that uncovers competitive drivers, supplier and buyer influence on pricing and profitability, barriers to entry protecting incumbents, and emerging threats or substitutes—ideal for investor materials, strategy decks, or academic use and fully editable for easy customization.
Customizable Excel Spreadsheet
A concise, one-sheet Five Forces summary tailored to Murray & Roberts—instantly highlights competitive pressures and strategic levers, ready for decks or scenario tabs; no macros, fully editable to reflect new data or regulatory shifts.
Customers Bargaining Power
Highly concentrated blue-chip clients
Mining majors, oil & gas operators and utilities such as BHP, Rio Tinto, Shell, ExxonMobil and large state utilities are few but enormous, giving them strong bargaining power over contractors.
Their procurement teams run rigorous global tenders where procurement budgets often exceed $1bn and single contracts commonly top $100m, enabling steep price pressure and demanding SLAs.
Volume potential forces contractors to accept tight margins; referenceability and TRIFR/safety records (benchmarks often <1.0) are table stakes to even qualify.
Competitive tendering and risk transfer
Clients increasingly push EPC/EPCM deals with fixed-price elements and tight LDs, commonly 0.25–0.5%/week with caps of 5–10%, shifting cost risk to contractors.
Buyer-favourable risk allocation on geotech, interfaces and escalation drives claims; targeted pre-contract value engineering is a lever to reshape risk and reduce headline price.
Rigorous bid/no-bid discipline and quantified contingencies are essential to avoid value-destroying awards and margin erosion.
Payment terms and cash flow control
Buyers often push 60–120 day payment terms and stringent milestone acceptance, extending cash conversion cycles in 2024. Retentions and performance guarantees commonly consume 5–10% of contract value, shifting working capital to contractors. Robust project controls and milestone design can cut cash gaps by 20–40%. Early procurement advances and 5–10% mobilization fees soften liquidity pressure.
ESG, local content, and compliance demands
Clients now mandate stringent HSE and ESG reporting plus local participation, increasing delivery complexity and vendor qualification hurdles; 2024 industry surveys indicate roughly 70% of large project owners enforce formal ESG clauses, which raises procurement costs but improves win probability when supply chains are compliant.
Preference for alliances and frameworks
Preference for long-term frameworks and early contractor involvement in 2024 pushed buyers to compress margins while improving visibility and pipeline stability, making predictable revenue streams more valuable than spot margins. Performance KPIs increasingly determine share-of-wallet within frameworks, so relationship capital and demonstrable past performance now heavily influence awards and contract renewal.
- Frameworks/ECI drive predictable pipelines
- KPIs link performance to market share
- Relationship capital critical for awards
Large buyers squeeze margins via tenders, budgets >$1bn, ESG ~70%
Large buyers like BHP/Rio/Shell exert strong leverage via global tenders, big budgets (> $1bn) and contracts > $100m, forcing tight margins and risk transfer; 2024 surveys show ~70% enforce ESG clauses. Payment terms (60–120 days), retentions 5–10% and LDs 0.25–0.5%/week compress contractor cashflow. Frameworks/ECI reduce spot margins but increase pipeline visibility and KPI-driven awards.
| Metric | 2024 Value |
|---|---|
| Buyers with ESG clauses | ~70% |
| Payment terms | 60–120 days |
| Retentions | 5–10% |
Full Version Awaits
Murray & Roberts Porter's Five Forces Analysis
This preview is the exact Murray & Roberts Porter's Five Forces Analysis you will receive upon purchase—fully written, formatted and ready to use. It covers competitive rivalry, supplier and buyer power, threat of substitutes and entry with actionable insights. No placeholders or samples; instant download after payment.
Description
From Overview to Strategy Blueprint
Murray & Roberts faces complex competitive pressures across supplier leverage, buyer bargaining, new entrants, substitutes and rivalry—our snapshot highlights key drivers and vulnerabilities. The analysis shows where strategic focus can reduce risk and unlock value. Unlock the full Porter's Five Forces Analysis to explore Murray & Roberts’s competitive dynamics in detail. Get the complete report to inform smarter decisions.
Suppliers Bargaining Power
Specialized OEM concentration
High-end mining and energy equipment is concentrated among a few global OEMs—Caterpillar, Komatsu, Epiroc and Sandvik—giving suppliers outsized leverage and elevating switching costs; the global mining equipment market was about USD 47 billion in 2024. OEM lead times for major fleets commonly exceed 12 months and limited qualified alternatives allow suppliers to dictate pricing and delivery. Long certification cycles and 12–36 month warranty dependencies further entrench OEM influence, which Murray & Roberts offsets with frame agreements and selective multi-vendor qualification where feasible.
Critical materials volatility
Steel, cement and specialty-alloy prices proved volatile in 2024, swinging roughly 15–25% in key markets and allowing suppliers to pass through costs; bid-to-procurement timing gaps of 60–90 days commonly amplified exposure. Escalation clauses and hedging reduced reported cost-overrun incidence by about 30% in industry surveys, while local sourcing mandates—applying to roughly 40% of regional contracts—either diversified supply or constrained options depending on supplier depth.
Skilled subcontractor scarcity
Skilled subcontractor scarcity—notably shaft sinking, heavy lifting and instrumentation—creates regional capacity constraints that let niche firms command premiums of up to 15–20% during peak cycles in 2024. Performance bonds and back-to-back risk flow-downs partially rebalance power by transferring credit and performance exposure to subs. Murray & Roberts leverages strategic partner ecosystems to secure priority access and schedule resilience.
Logistics and remote site dependence
Remote mining and energy sites depend on limited logistics providers and corridors, giving upstream handlers elevated bargaining power as transport bottlenecks and port congestion in 2024 constrained delivery windows and capacity. Schedule penalties magnify the financial impact of delays, increasing contractors' exposure to liquidated damages. Early logistics engineering and multi-route planning materially reduce single-source dependency and delay risk.
- Limited carriers: increases supplier leverage
- Port congestion: tightens schedules, raises costs
- Penalties: amplify delay costs
- Mitigation: early logistics engineering, multi-route planning
Software and digital tool lock-in
Engineering platforms (BIM, design suites, digital twins) create ecosystem lock-in for Murray & Roberts, raising retraining and integration costs; major vendors like Autodesk reported revenue of about 5.33 billion USD in FY2024, underscoring vendor market power.
Data portability and licensing terms often favor vendors, while standardized data models and open APIs reduce switching friction; enterprise agreements help stabilize software spend across multi-year projects.
- Vendor concentration: Autodesk 2024 revenue 5.33B USD
- Risk: high retraining and integration costs
- Mitigation: open APIs and standardized data models
- Policy: enterprise agreements stabilize costs
Supplier power: OEMs USD 47B, lead times >12m, commodity swings
Suppliers hold high bargaining power: OEMs (market ~USD 47B in 2024) and engineering-software vendors (Autodesk revenue USD 5.33B in FY2024) create concentration and long lead times (>12 months), raising switching costs. Commodity price swings (steel/cement 15–25% in 2024) and local content rules (~40% of contracts) further strengthen suppliers. Niche subs command 15–20% premiums; logistics bottlenecks amplify schedule risk.
| Metric | 2024 Value |
|---|---|
| Mining equipment market | USD 47B |
| OEM lead times | >12 months |
| Steel/cement volatility | 15–25% |
| Local sourcing mandates | ~40% |
| Subcontractor premium | 15–20% |
| Autodesk revenue (FY2024) | USD 5.33B |
What is included in the product
Detailed Word Document
Tailored analysis of Murray & Roberts that uncovers competitive drivers, supplier and buyer influence on pricing and profitability, barriers to entry protecting incumbents, and emerging threats or substitutes—ideal for investor materials, strategy decks, or academic use and fully editable for easy customization.
Customizable Excel Spreadsheet
A concise, one-sheet Five Forces summary tailored to Murray & Roberts—instantly highlights competitive pressures and strategic levers, ready for decks or scenario tabs; no macros, fully editable to reflect new data or regulatory shifts.
Customers Bargaining Power
Highly concentrated blue-chip clients
Mining majors, oil & gas operators and utilities such as BHP, Rio Tinto, Shell, ExxonMobil and large state utilities are few but enormous, giving them strong bargaining power over contractors.
Their procurement teams run rigorous global tenders where procurement budgets often exceed $1bn and single contracts commonly top $100m, enabling steep price pressure and demanding SLAs.
Volume potential forces contractors to accept tight margins; referenceability and TRIFR/safety records (benchmarks often <1.0) are table stakes to even qualify.
Competitive tendering and risk transfer
Clients increasingly push EPC/EPCM deals with fixed-price elements and tight LDs, commonly 0.25–0.5%/week with caps of 5–10%, shifting cost risk to contractors.
Buyer-favourable risk allocation on geotech, interfaces and escalation drives claims; targeted pre-contract value engineering is a lever to reshape risk and reduce headline price.
Rigorous bid/no-bid discipline and quantified contingencies are essential to avoid value-destroying awards and margin erosion.
Payment terms and cash flow control
Buyers often push 60–120 day payment terms and stringent milestone acceptance, extending cash conversion cycles in 2024. Retentions and performance guarantees commonly consume 5–10% of contract value, shifting working capital to contractors. Robust project controls and milestone design can cut cash gaps by 20–40%. Early procurement advances and 5–10% mobilization fees soften liquidity pressure.
ESG, local content, and compliance demands
Clients now mandate stringent HSE and ESG reporting plus local participation, increasing delivery complexity and vendor qualification hurdles; 2024 industry surveys indicate roughly 70% of large project owners enforce formal ESG clauses, which raises procurement costs but improves win probability when supply chains are compliant.
Preference for alliances and frameworks
Preference for long-term frameworks and early contractor involvement in 2024 pushed buyers to compress margins while improving visibility and pipeline stability, making predictable revenue streams more valuable than spot margins. Performance KPIs increasingly determine share-of-wallet within frameworks, so relationship capital and demonstrable past performance now heavily influence awards and contract renewal.
- Frameworks/ECI drive predictable pipelines
- KPIs link performance to market share
- Relationship capital critical for awards
Large buyers squeeze margins via tenders, budgets >$1bn, ESG ~70%
Large buyers like BHP/Rio/Shell exert strong leverage via global tenders, big budgets (> $1bn) and contracts > $100m, forcing tight margins and risk transfer; 2024 surveys show ~70% enforce ESG clauses. Payment terms (60–120 days), retentions 5–10% and LDs 0.25–0.5%/week compress contractor cashflow. Frameworks/ECI reduce spot margins but increase pipeline visibility and KPI-driven awards.
| Metric | 2024 Value |
|---|---|
| Buyers with ESG clauses | ~70% |
| Payment terms | 60–120 days |
| Retentions | 5–10% |
Full Version Awaits
Murray & Roberts Porter's Five Forces Analysis
This preview is the exact Murray & Roberts Porter's Five Forces Analysis you will receive upon purchase—fully written, formatted and ready to use. It covers competitive rivalry, supplier and buyer power, threat of substitutes and entry with actionable insights. No placeholders or samples; instant download after payment.











