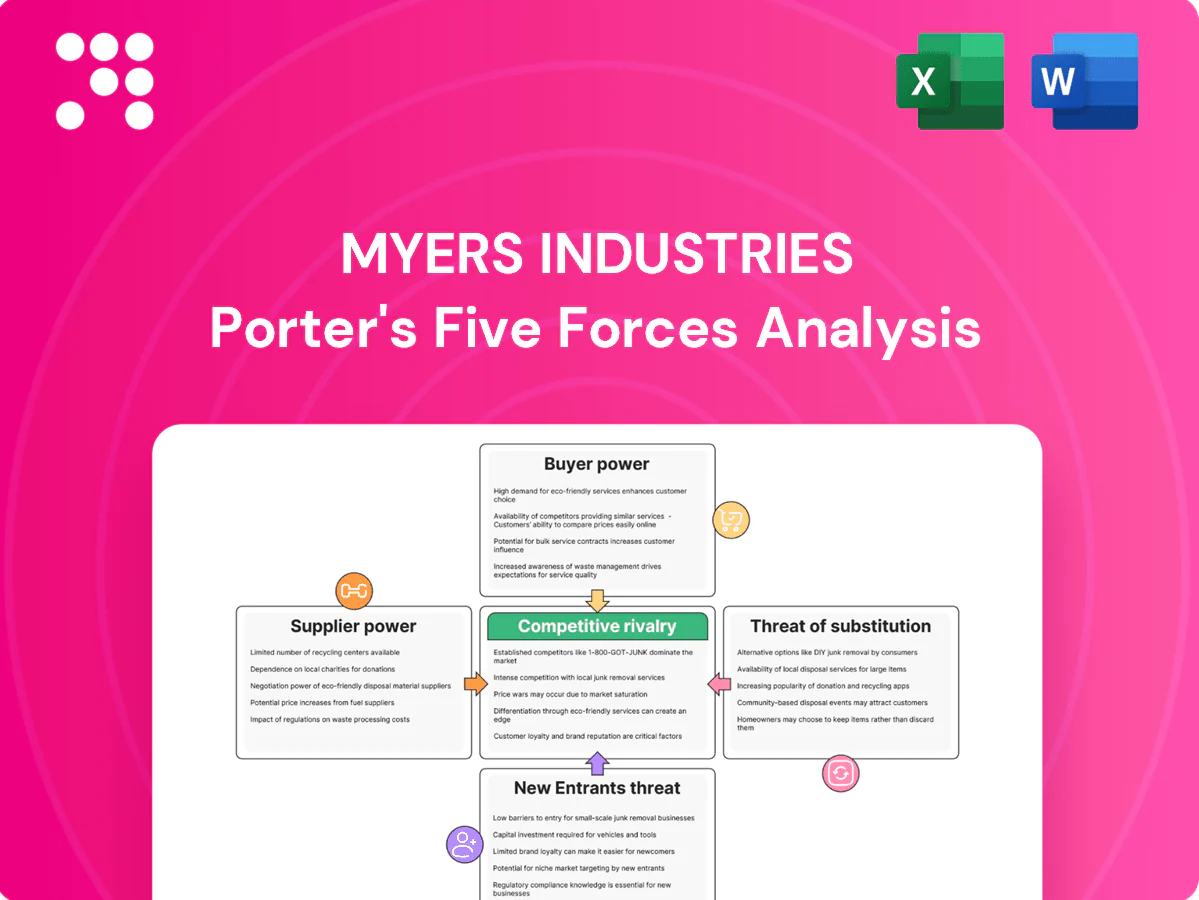
Myers Industries Porter's Five Forces Analysis

From Overview to Strategy Blueprint
Myers Industries faces moderate supplier power, steady buyer demands, and rising competitive pressure from low-cost material handlers, while substitutes and new entrants pose limited but growing threats; operational scale and distribution reach are key defenses. This brief snapshot only scratches the surface. Unlock the full Porter's Five Forces Analysis to explore Myers Industries’s competitive dynamics and strategic implications in detail.
Suppliers Bargaining Power

Concentrated resin and additives sourcing
Core inputs for Myers Industries—polyethylene, polypropylene and additives—are typically supplied by large petrochemical firms such as ExxonMobil, Saudi Aramco, LyondellBasell and BASF, concentrating supplier power. Supplier concentration and feedstock volatility elevate pricing leverage, which long-term contracts and hedging can mitigate but not eliminate. Securing multiple qualified sources reduces disruption risk and improves negotiating position.
Tooling, molds, and specialized equipment
Custom molds and capital tooling create switching frictions and lead times (typically 12–24 weeks) for Myers Industries. Suppliers with unique technical know-how can command premiums, often 5–15% above commodity pricing. Collaborative design partnerships lock in value but deepen dependence on specific vendors. Proactive tooling standardization and modular molds reduce sourcing risk and can shorten lead times and lower costs.

Energy, logistics, and freight dependencies
Polymer processing is energy- and freight-intensive, with U.S. diesel averaging about $4.02/gal in 2024 (EIA), exposing Myers to utility and carrier cost swings. Tight trucking capacity pushed spot rates roughly 10% higher in 2024 (DAT), shifting leverage to logistics providers. Regionalized plants and load optimization reduce long-haul exposure. Contracted lanes and intermodal alternatives increase resilience and price predictability.

Quality and compliance requirements
Industrial, automotive and food-contact specs in 2024 raise material qualification hurdles, narrowing compliant suppliers and increasing their bargaining power. Rigorous vendor audits and dual qualification reduce dependence on single sources. Documented PPAP and enhanced traceability programs have broadened the eligible vendor pool.
- Fewer compliant suppliers → higher supplier power
- Vendor audits + dual qualification → lower supply risk
- PPAP & traceability → larger qualified pool
Sustainability and recycled content supply
Sustainability-driven demand for recycled resins tightened availability in 2024, driving double-digit spot premiums and increasing supplier leverage; certified post-consumer/post-industrial streams remained capacity-constrained, limiting alternatives. Myers lowers exposure via long-term offtakes and in-house regrind, which stabilize supply and margins. Emerging transparency standards and chain-of-custody requirements reduce supplier opportunism and support predictable sourcing.
- 2024: double-digit spot premiums for recycled resins
- Certified streams capacity-constrained, limiting swaps
- Long-term offtake + in-house regrind = lower supplier risk
- Transparency standards constrain supplier opportunism
High supplier leverage from feedstock volatility and tooling lead times; contracts hedge
Supplier concentration among major petrochemical firms and feedstock volatility give suppliers high leverage, partially offset by long-term contracts and hedging.
Custom tooling (12–24 weeks) and technical supplier premiums (5–15%) raise switching costs, mitigated by standardization and dual qualification.
2024: recycled resin spot premiums double-digit, diesel ~$4.02/gal, trucking spot rates ~+10%—long-term offtakes and in-house regrind lower supply risk.
| Metric | 2024 value | Effect on supplier power |
|---|---|---|
| Supplier concentration | High | Increase |
| Tooling lead time | 12–24 weeks | Increase |
| Recycled resin premium | Double-digit% | Increase |
| Diesel price | $4.02/gal | Increase |
| Trucking spot rates | +10% | Increase |
What is included in the product
 Detailed Word Document
Tailored Porter’s Five Forces analysis of Myers Industries uncovers competitive rivalry, supplier and buyer power, and entry/substitute threats impacting pricing and margins. It identifies disruptive trends and strategic levers to protect market share and guide investor and management decisions.

 Customizable Excel Spreadsheet
A concise one-sheet Porter's Five Forces for Myers Industries highlighting supplier and buyer power, competitive rivalry, new-entrant risk and substitute threat—easy to customize, copy into decks, swap in your own data, and instantly guide rapid strategic decisions.
Customers Bargaining Power

Diverse but sizable industrial and retail accounts
Large OEMs, distributors and big-box retailers such as Walmart (FY2024 sales $611.3B) and Home Depot (FY2024 sales $157.4B) negotiate aggressively on price and terms, leveraging scale and alternative suppliers to strengthen bargaining power. Smaller niche buyers blunt but do not eliminate this pressure. Myers can defend margins via tiered pricing and value-added services.
Price sensitivity and total cost of ownership
Customers in storage and transport procurement remain cost-focused, with 68% of buyers in a 2024 procurement survey prioritizing total cost of ownership over unit price. Demonstrated lifecycle value and durability—often delivering up to 35% lower failure rates—shifts negotiations from upfront price to TCO. Bundled distribution services increase customer stickiness and enable premium pricing. Industry estimates place downtime costs near 300 USD per hour, supporting willingness to pay for reliability.

Standardization versus customization
Standard SKUs are highly commoditized, increasing buyer leverage as price and delivery become primary comparators. Custom-engineered products raise switching costs and reduce direct comparability, making margin capture easier. Design-in wins lock customers for tooling life cycles typically of 5–7 years. Modular platforms in 2024 increasingly balance scale efficiency with product differentiation.

Channel power in tire repair distribution
- Consolidated purchasing: dealer/fleet leverage
- Private-label pressure: lower margins
- Value-adds: training/tech reduce pure price focus
- Service reliability: fill-rates decide wins
Switching costs and qualification cycles
Automotive and regulated customers require supplier requalification—industry typical cycles span 6–12 months with testing and validation costs often ranging from $50,000 to $200,000—tempering buyer bargaining power and driving multi-year supply agreements for Myers Industries. Time-to-market and certification friction, plus Myers reported OTIF improvements versus sector averages (e.g., 98% versus ~90%), further raise perceived switching costs and customer stickiness.
- Requalification cycles: 6–12 months, $50k–$200k testing costs
- Multi-year contracts common due to friction and certification risk
- Higher OTIF (example 98% vs ~90%) increases switching costs
68% TCO focus; 98% OTIF and 6-12m requalification lock-in
Large OEMs and retailers (Walmart FY2024 sales 611.3B; Home Depot FY2024 157.4B) exert strong price leverage; Myers offsets via tiered pricing, services and design-in (5–7 yr tooling). 68% of buyers in 2024 prioritize TCO; downtime ≈300 USD/hr supports premium for reliability. Requalification 6–12 months ($50k–$200k) and OTIF ~98% lift switching costs.
| Metric | Value |
|---|---|
| Walmart FY2024 | 611.3B |
| Home Depot FY2024 | 157.4B |
| TCO focus (2024) | 68% |
| Downtime cost | ~300 USD/hr |
| Requalification | 6–12m, $50k–$200k |
| OTIF | 98% vs ~90% |
What You See Is What You Get
Myers Industries Porter's Five Forces Analysis
This Myers Industries Porter's Five Forces Analysis preview is the exact document you’ll receive after purchase—no placeholders or mockups. It’s the professionally formatted, ready-to-use file available for instant download upon payment. What you see here is the full deliverable, prepared for immediate application.

From Overview to Strategy Blueprint
Myers Industries faces moderate supplier power, steady buyer demands, and rising competitive pressure from low-cost material handlers, while substitutes and new entrants pose limited but growing threats; operational scale and distribution reach are key defenses. This brief snapshot only scratches the surface. Unlock the full Porter's Five Forces Analysis to explore Myers Industries’s competitive dynamics and strategic implications in detail.
Suppliers Bargaining Power
Concentrated resin and additives sourcing
Core inputs for Myers Industries—polyethylene, polypropylene and additives—are typically supplied by large petrochemical firms such as ExxonMobil, Saudi Aramco, LyondellBasell and BASF, concentrating supplier power. Supplier concentration and feedstock volatility elevate pricing leverage, which long-term contracts and hedging can mitigate but not eliminate. Securing multiple qualified sources reduces disruption risk and improves negotiating position.
Tooling, molds, and specialized equipment
Custom molds and capital tooling create switching frictions and lead times (typically 12–24 weeks) for Myers Industries. Suppliers with unique technical know-how can command premiums, often 5–15% above commodity pricing. Collaborative design partnerships lock in value but deepen dependence on specific vendors. Proactive tooling standardization and modular molds reduce sourcing risk and can shorten lead times and lower costs.
Energy, logistics, and freight dependencies
Polymer processing is energy- and freight-intensive, with U.S. diesel averaging about $4.02/gal in 2024 (EIA), exposing Myers to utility and carrier cost swings. Tight trucking capacity pushed spot rates roughly 10% higher in 2024 (DAT), shifting leverage to logistics providers. Regionalized plants and load optimization reduce long-haul exposure. Contracted lanes and intermodal alternatives increase resilience and price predictability.
Quality and compliance requirements
Industrial, automotive and food-contact specs in 2024 raise material qualification hurdles, narrowing compliant suppliers and increasing their bargaining power. Rigorous vendor audits and dual qualification reduce dependence on single sources. Documented PPAP and enhanced traceability programs have broadened the eligible vendor pool.
- Fewer compliant suppliers → higher supplier power
- Vendor audits + dual qualification → lower supply risk
- PPAP & traceability → larger qualified pool
Sustainability and recycled content supply
Sustainability-driven demand for recycled resins tightened availability in 2024, driving double-digit spot premiums and increasing supplier leverage; certified post-consumer/post-industrial streams remained capacity-constrained, limiting alternatives. Myers lowers exposure via long-term offtakes and in-house regrind, which stabilize supply and margins. Emerging transparency standards and chain-of-custody requirements reduce supplier opportunism and support predictable sourcing.
- 2024: double-digit spot premiums for recycled resins
- Certified streams capacity-constrained, limiting swaps
- Long-term offtake + in-house regrind = lower supplier risk
- Transparency standards constrain supplier opportunism
High supplier leverage from feedstock volatility and tooling lead times; contracts hedge
Supplier concentration among major petrochemical firms and feedstock volatility give suppliers high leverage, partially offset by long-term contracts and hedging.
Custom tooling (12–24 weeks) and technical supplier premiums (5–15%) raise switching costs, mitigated by standardization and dual qualification.
2024: recycled resin spot premiums double-digit, diesel ~$4.02/gal, trucking spot rates ~+10%—long-term offtakes and in-house regrind lower supply risk.
| Metric | 2024 value | Effect on supplier power |
|---|---|---|
| Supplier concentration | High | Increase |
| Tooling lead time | 12–24 weeks | Increase |
| Recycled resin premium | Double-digit% | Increase |
| Diesel price | $4.02/gal | Increase |
| Trucking spot rates | +10% | Increase |
What is included in the product
Detailed Word Document
Tailored Porter’s Five Forces analysis of Myers Industries uncovers competitive rivalry, supplier and buyer power, and entry/substitute threats impacting pricing and margins. It identifies disruptive trends and strategic levers to protect market share and guide investor and management decisions.
Customizable Excel Spreadsheet
A concise one-sheet Porter's Five Forces for Myers Industries highlighting supplier and buyer power, competitive rivalry, new-entrant risk and substitute threat—easy to customize, copy into decks, swap in your own data, and instantly guide rapid strategic decisions.
Customers Bargaining Power
Diverse but sizable industrial and retail accounts
Large OEMs, distributors and big-box retailers such as Walmart (FY2024 sales $611.3B) and Home Depot (FY2024 sales $157.4B) negotiate aggressively on price and terms, leveraging scale and alternative suppliers to strengthen bargaining power. Smaller niche buyers blunt but do not eliminate this pressure. Myers can defend margins via tiered pricing and value-added services.
Price sensitivity and total cost of ownership
Customers in storage and transport procurement remain cost-focused, with 68% of buyers in a 2024 procurement survey prioritizing total cost of ownership over unit price. Demonstrated lifecycle value and durability—often delivering up to 35% lower failure rates—shifts negotiations from upfront price to TCO. Bundled distribution services increase customer stickiness and enable premium pricing. Industry estimates place downtime costs near 300 USD per hour, supporting willingness to pay for reliability.
Standardization versus customization
Standard SKUs are highly commoditized, increasing buyer leverage as price and delivery become primary comparators. Custom-engineered products raise switching costs and reduce direct comparability, making margin capture easier. Design-in wins lock customers for tooling life cycles typically of 5–7 years. Modular platforms in 2024 increasingly balance scale efficiency with product differentiation.
Channel power in tire repair distribution
- Consolidated purchasing: dealer/fleet leverage
- Private-label pressure: lower margins
- Value-adds: training/tech reduce pure price focus
- Service reliability: fill-rates decide wins
Switching costs and qualification cycles
Automotive and regulated customers require supplier requalification—industry typical cycles span 6–12 months with testing and validation costs often ranging from $50,000 to $200,000—tempering buyer bargaining power and driving multi-year supply agreements for Myers Industries. Time-to-market and certification friction, plus Myers reported OTIF improvements versus sector averages (e.g., 98% versus ~90%), further raise perceived switching costs and customer stickiness.
- Requalification cycles: 6–12 months, $50k–$200k testing costs
- Multi-year contracts common due to friction and certification risk
- Higher OTIF (example 98% vs ~90%) increases switching costs
68% TCO focus; 98% OTIF and 6-12m requalification lock-in
Large OEMs and retailers (Walmart FY2024 sales 611.3B; Home Depot FY2024 157.4B) exert strong price leverage; Myers offsets via tiered pricing, services and design-in (5–7 yr tooling). 68% of buyers in 2024 prioritize TCO; downtime ≈300 USD/hr supports premium for reliability. Requalification 6–12 months ($50k–$200k) and OTIF ~98% lift switching costs.
| Metric | Value |
|---|---|
| Walmart FY2024 | 611.3B |
| Home Depot FY2024 | 157.4B |
| TCO focus (2024) | 68% |
| Downtime cost | ~300 USD/hr |
| Requalification | 6–12m, $50k–$200k |
| OTIF | 98% vs ~90% |
What You See Is What You Get
Myers Industries Porter's Five Forces Analysis
This Myers Industries Porter's Five Forces Analysis preview is the exact document you’ll receive after purchase—no placeholders or mockups. It’s the professionally formatted, ready-to-use file available for instant download upon payment. What you see here is the full deliverable, prepared for immediate application.
Original: $10.00
-65%$10.00
$3.50Description
From Overview to Strategy Blueprint
Myers Industries faces moderate supplier power, steady buyer demands, and rising competitive pressure from low-cost material handlers, while substitutes and new entrants pose limited but growing threats; operational scale and distribution reach are key defenses. This brief snapshot only scratches the surface. Unlock the full Porter's Five Forces Analysis to explore Myers Industries’s competitive dynamics and strategic implications in detail.
Suppliers Bargaining Power
Concentrated resin and additives sourcing
Core inputs for Myers Industries—polyethylene, polypropylene and additives—are typically supplied by large petrochemical firms such as ExxonMobil, Saudi Aramco, LyondellBasell and BASF, concentrating supplier power. Supplier concentration and feedstock volatility elevate pricing leverage, which long-term contracts and hedging can mitigate but not eliminate. Securing multiple qualified sources reduces disruption risk and improves negotiating position.
Tooling, molds, and specialized equipment
Custom molds and capital tooling create switching frictions and lead times (typically 12–24 weeks) for Myers Industries. Suppliers with unique technical know-how can command premiums, often 5–15% above commodity pricing. Collaborative design partnerships lock in value but deepen dependence on specific vendors. Proactive tooling standardization and modular molds reduce sourcing risk and can shorten lead times and lower costs.
Energy, logistics, and freight dependencies
Polymer processing is energy- and freight-intensive, with U.S. diesel averaging about $4.02/gal in 2024 (EIA), exposing Myers to utility and carrier cost swings. Tight trucking capacity pushed spot rates roughly 10% higher in 2024 (DAT), shifting leverage to logistics providers. Regionalized plants and load optimization reduce long-haul exposure. Contracted lanes and intermodal alternatives increase resilience and price predictability.
Quality and compliance requirements
Industrial, automotive and food-contact specs in 2024 raise material qualification hurdles, narrowing compliant suppliers and increasing their bargaining power. Rigorous vendor audits and dual qualification reduce dependence on single sources. Documented PPAP and enhanced traceability programs have broadened the eligible vendor pool.
- Fewer compliant suppliers → higher supplier power
- Vendor audits + dual qualification → lower supply risk
- PPAP & traceability → larger qualified pool
Sustainability and recycled content supply
Sustainability-driven demand for recycled resins tightened availability in 2024, driving double-digit spot premiums and increasing supplier leverage; certified post-consumer/post-industrial streams remained capacity-constrained, limiting alternatives. Myers lowers exposure via long-term offtakes and in-house regrind, which stabilize supply and margins. Emerging transparency standards and chain-of-custody requirements reduce supplier opportunism and support predictable sourcing.
- 2024: double-digit spot premiums for recycled resins
- Certified streams capacity-constrained, limiting swaps
- Long-term offtake + in-house regrind = lower supplier risk
- Transparency standards constrain supplier opportunism
High supplier leverage from feedstock volatility and tooling lead times; contracts hedge
Supplier concentration among major petrochemical firms and feedstock volatility give suppliers high leverage, partially offset by long-term contracts and hedging.
Custom tooling (12–24 weeks) and technical supplier premiums (5–15%) raise switching costs, mitigated by standardization and dual qualification.
2024: recycled resin spot premiums double-digit, diesel ~$4.02/gal, trucking spot rates ~+10%—long-term offtakes and in-house regrind lower supply risk.
| Metric | 2024 value | Effect on supplier power |
|---|---|---|
| Supplier concentration | High | Increase |
| Tooling lead time | 12–24 weeks | Increase |
| Recycled resin premium | Double-digit% | Increase |
| Diesel price | $4.02/gal | Increase |
| Trucking spot rates | +10% | Increase |
What is included in the product
Detailed Word Document
Tailored Porter’s Five Forces analysis of Myers Industries uncovers competitive rivalry, supplier and buyer power, and entry/substitute threats impacting pricing and margins. It identifies disruptive trends and strategic levers to protect market share and guide investor and management decisions.
Customizable Excel Spreadsheet
A concise one-sheet Porter's Five Forces for Myers Industries highlighting supplier and buyer power, competitive rivalry, new-entrant risk and substitute threat—easy to customize, copy into decks, swap in your own data, and instantly guide rapid strategic decisions.
Customers Bargaining Power
Diverse but sizable industrial and retail accounts
Large OEMs, distributors and big-box retailers such as Walmart (FY2024 sales $611.3B) and Home Depot (FY2024 sales $157.4B) negotiate aggressively on price and terms, leveraging scale and alternative suppliers to strengthen bargaining power. Smaller niche buyers blunt but do not eliminate this pressure. Myers can defend margins via tiered pricing and value-added services.
Price sensitivity and total cost of ownership
Customers in storage and transport procurement remain cost-focused, with 68% of buyers in a 2024 procurement survey prioritizing total cost of ownership over unit price. Demonstrated lifecycle value and durability—often delivering up to 35% lower failure rates—shifts negotiations from upfront price to TCO. Bundled distribution services increase customer stickiness and enable premium pricing. Industry estimates place downtime costs near 300 USD per hour, supporting willingness to pay for reliability.
Standardization versus customization
Standard SKUs are highly commoditized, increasing buyer leverage as price and delivery become primary comparators. Custom-engineered products raise switching costs and reduce direct comparability, making margin capture easier. Design-in wins lock customers for tooling life cycles typically of 5–7 years. Modular platforms in 2024 increasingly balance scale efficiency with product differentiation.
Channel power in tire repair distribution
- Consolidated purchasing: dealer/fleet leverage
- Private-label pressure: lower margins
- Value-adds: training/tech reduce pure price focus
- Service reliability: fill-rates decide wins
Switching costs and qualification cycles
Automotive and regulated customers require supplier requalification—industry typical cycles span 6–12 months with testing and validation costs often ranging from $50,000 to $200,000—tempering buyer bargaining power and driving multi-year supply agreements for Myers Industries. Time-to-market and certification friction, plus Myers reported OTIF improvements versus sector averages (e.g., 98% versus ~90%), further raise perceived switching costs and customer stickiness.
- Requalification cycles: 6–12 months, $50k–$200k testing costs
- Multi-year contracts common due to friction and certification risk
- Higher OTIF (example 98% vs ~90%) increases switching costs
68% TCO focus; 98% OTIF and 6-12m requalification lock-in
Large OEMs and retailers (Walmart FY2024 sales 611.3B; Home Depot FY2024 157.4B) exert strong price leverage; Myers offsets via tiered pricing, services and design-in (5–7 yr tooling). 68% of buyers in 2024 prioritize TCO; downtime ≈300 USD/hr supports premium for reliability. Requalification 6–12 months ($50k–$200k) and OTIF ~98% lift switching costs.
| Metric | Value |
|---|---|
| Walmart FY2024 | 611.3B |
| Home Depot FY2024 | 157.4B |
| TCO focus (2024) | 68% |
| Downtime cost | ~300 USD/hr |
| Requalification | 6–12m, $50k–$200k |
| OTIF | 98% vs ~90% |
What You See Is What You Get
Myers Industries Porter's Five Forces Analysis
This Myers Industries Porter's Five Forces Analysis preview is the exact document you’ll receive after purchase—no placeholders or mockups. It’s the professionally formatted, ready-to-use file available for instant download upon payment. What you see here is the full deliverable, prepared for immediate application.











