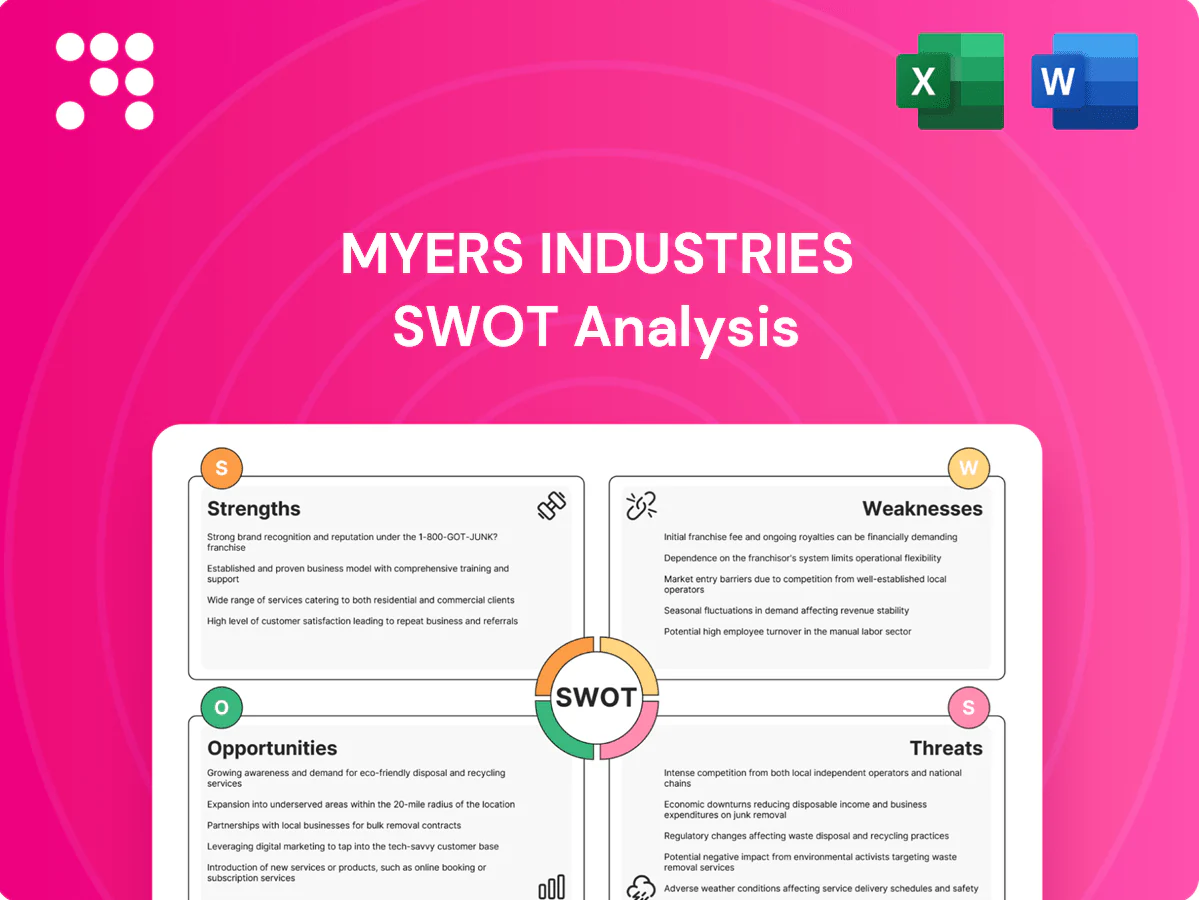
Myers Industries SWOT Analysis

Make Insightful Decisions Backed by Expert Research
Myers Industries shows strength in diversified industrial polymer products and a broad distribution network, but faces margin pressure and exposure to commodity costs. Opportunities include aftermarket expansion and sustainability-driven demand, while competition and cyclical end markets are key threats. Want deeper, actionable insights? Purchase the full SWOT analysis for a detailed, editable report and Excel model.
Strengths

Diverse end-market reach
Serving industrial, agricultural, automotive, commercial and consumer sectors smooths cyclical swings by spreading demand across five end markets and lowering exposure to any single vertical. Broad exposure enables cross-selling of storage, organization and transport solutions across channels, boosting average order depth. Diversification supports scale economies in polymer production and reduces reliance on any single customer.
Polymer manufacturing expertise
Deep know-how in polymer design and molding drives product performance and cost control, supporting Myers Industries’ FY2024 revenue of $518 million and adjusted gross margins that remained resilient amid input inflation. In-house tooling and molding speed prototyping and customization, cutting lead times and lowering unit costs. Process efficiencies underpin margin resilience and create a technical moat that raises customer switching costs.

Complementary distribution network
Myers Industries’ complementary distribution network, including its tire repair and retread channels, delivers steady service-led revenue and recurring customer engagement in 2024. The network broadens customer touchpoints and aftermarket reach, supporting faster product iterations through direct channel feedback. Integrated cross-channel logistics boost fulfillment efficiency and improve inventory turns. This structure strengthens resilience against OEM demand swings.

Portfolio of storage and transport solutions
Myers Industries standardized bins, totes and containers address scalable, recurring needs—repeat purchases and replacement cycles underpin steady demand; FY2024 net sales were about $523 million, with durable goods and industrial segments supporting volumes. Modular designs let customers mix-and-match solutions across sectors, enabling bundled offerings that expand share of wallet.
- Standardized SKUs drive repeat orders
- Replacement cycles = recurring revenue
- Modular mix-and-match boosts cross-sell
- Bundle capability increases share of wallet
Innovation focus and customization
Myers Industries leverages innovative materials and modular design to meet evolving customer needs, enabling customized offerings that command premium pricing and reduce exposure to commodity cycles. Rapid engineering response shortens lead times and differentiates against lower-margin competitors, facilitating entry into niche, higher-margin applications.
- Innovation-driven premium pricing
- Custom solutions = pricing power
- Fast engineering = competitive differentiation
- Access to niche, higher-margin markets
Diversified polymer eased cycles, delivering $518M FY2024 revenue and recurring sales
Serving five end markets smooths cycles and supported FY2024 revenue of $518 million. Deep polymer design and in-house molding upheld resilient adjusted gross margins amid input inflation. Complementary distribution and aftermarket channels sustained recurring service revenue; FY2024 net sales were about $523 million. Standardized, modular SKUs enable cross-sell and premium pricing.
| Metric | Value |
|---|---|
| FY2024 Revenue | $518 million |
| FY2024 Net Sales | $523 million |
| End Markets | 5 |
What is included in the product
 Detailed Word Document
Provides a concise SWOT overview of Myers Industries, highlighting internal strengths and weaknesses and external opportunities and threats shaping its competitive position.

 Customizable Excel Spreadsheet
Provides a concise, visual SWOT matrix tailored to Myers Industries for rapid strategic alignment and stakeholder-ready summaries. Editable format lets teams update strengths, weaknesses, opportunities, and threats quickly to reflect market shifts.
Weaknesses

Exposure to resin price volatility
Polymer inputs link Myers Industries costs directly to oil and petrochemical markets, with resin often representing roughly 20-40% of raw-material expense; Brent crude swung more than 50% between 2020–2024, transmitting volatility to resin pricing. Sudden resin spikes can compress margins before price pass-through; hedging has proven imperfect in tight supply cycles. Customers may resist frequent surcharges, slowing recovery of input-driven margin erosion.
Capital intensity and tooling
Molding operations require ongoing capex—Myers Industries recorded roughly $15 million in capital expenditures in FY2024—primarily for machines and specialized tooling. Changeovers and customized molds add complexity and costs, with tooling lead times commonly 8–16 weeks, slowing new product ramps. Heavy fixed costs make underutilization during downturns press returns and margins.

Distribution-mix margin dilution
Aftermarket distribution often carries lower gross margins than manufactured goods, diluting Myers Industries overall margin profile. A shift in sales mix toward distribution can compress company-level profitability and reduce gross-margin percentage. Increased service complexity in distribution raises operating expenses through logistics, inventory and customer support. It can blur strategic focus between manufacturing and distribution, complicating capital allocation and pricing discipline.

Cyclicality in industrial and auto
Myers Industries faces pronounced cyclicality: industrial production and automotive demand are highly macro-sensitive, so OEM order pushouts quickly ripple through Myers operations, straining inventory and working capital and complicating short-term cash flow management. Agricultural exposure adds weather and commodity-driven volatility, making capacity utilization and production planning more difficult.
- Macro sensitivity
- Order pushouts → inventory/working capital pressure
- Agricultural weather/commodity risk
- Planning & capacity utilization volatility
Brand fragmentation across niches
Myers Industries (NYSE: MYE) serves diverse niches—agriculture, material handling and industrial—which disperses marketing spend and weakens a unified brand presence.
Customers may see SKUs as interchangeable, limiting pricing power in commoditized lines and pressuring margins.
Fragmentation raises sales enablement costs across channels, increasing per-SKU go-to-market expense.
- Segments: agriculture, material handling, industrial
- Risk: diluted brand equity → lower pricing power
- Impact: higher per-SKU sales enablement costs
Polymers tether margins to oil volatility; >50% Brent swings compress profits, tooling capex burden
Polymer inputs link costs to oil/petrochemical markets; resin often 20–40% of raw‑material spend and Brent swung >50% (2020–2024), transmitting volatility and compressing margins.
FY2024 capex ~15 million for molding/tooling; tooling lead times 8–16 weeks raise changeover costs and underutilization risk.
Aftermarket distribution’s lower margins and fragmented segments dilute pricing power and raise per‑SKU go‑to‑market costs.
| Metric | Value |
|---|---|
| Resin share of inputs | 20–40% |
| Brent crude swing (2020–2024) | >50% |
| FY2024 capex | ~$15M |
| Tooling lead time | 8–16 weeks |
Preview the Actual Deliverable
Myers Industries SWOT Analysis
This is the actual SWOT analysis document you’ll receive upon purchase—no surprises, just professional quality. The preview below is taken directly from the full report on Myers Industries, covering strengths, weaknesses, opportunities, and threats. Buy to unlock the complete, editable file.

Make Insightful Decisions Backed by Expert Research
Myers Industries shows strength in diversified industrial polymer products and a broad distribution network, but faces margin pressure and exposure to commodity costs. Opportunities include aftermarket expansion and sustainability-driven demand, while competition and cyclical end markets are key threats. Want deeper, actionable insights? Purchase the full SWOT analysis for a detailed, editable report and Excel model.
Strengths
Diverse end-market reach
Serving industrial, agricultural, automotive, commercial and consumer sectors smooths cyclical swings by spreading demand across five end markets and lowering exposure to any single vertical. Broad exposure enables cross-selling of storage, organization and transport solutions across channels, boosting average order depth. Diversification supports scale economies in polymer production and reduces reliance on any single customer.
Polymer manufacturing expertise
Deep know-how in polymer design and molding drives product performance and cost control, supporting Myers Industries’ FY2024 revenue of $518 million and adjusted gross margins that remained resilient amid input inflation. In-house tooling and molding speed prototyping and customization, cutting lead times and lowering unit costs. Process efficiencies underpin margin resilience and create a technical moat that raises customer switching costs.
Complementary distribution network
Myers Industries’ complementary distribution network, including its tire repair and retread channels, delivers steady service-led revenue and recurring customer engagement in 2024. The network broadens customer touchpoints and aftermarket reach, supporting faster product iterations through direct channel feedback. Integrated cross-channel logistics boost fulfillment efficiency and improve inventory turns. This structure strengthens resilience against OEM demand swings.
Portfolio of storage and transport solutions
Myers Industries standardized bins, totes and containers address scalable, recurring needs—repeat purchases and replacement cycles underpin steady demand; FY2024 net sales were about $523 million, with durable goods and industrial segments supporting volumes. Modular designs let customers mix-and-match solutions across sectors, enabling bundled offerings that expand share of wallet.
- Standardized SKUs drive repeat orders
- Replacement cycles = recurring revenue
- Modular mix-and-match boosts cross-sell
- Bundle capability increases share of wallet
Innovation focus and customization
Myers Industries leverages innovative materials and modular design to meet evolving customer needs, enabling customized offerings that command premium pricing and reduce exposure to commodity cycles. Rapid engineering response shortens lead times and differentiates against lower-margin competitors, facilitating entry into niche, higher-margin applications.
- Innovation-driven premium pricing
- Custom solutions = pricing power
- Fast engineering = competitive differentiation
- Access to niche, higher-margin markets
Diversified polymer eased cycles, delivering $518M FY2024 revenue and recurring sales
Serving five end markets smooths cycles and supported FY2024 revenue of $518 million. Deep polymer design and in-house molding upheld resilient adjusted gross margins amid input inflation. Complementary distribution and aftermarket channels sustained recurring service revenue; FY2024 net sales were about $523 million. Standardized, modular SKUs enable cross-sell and premium pricing.
| Metric | Value |
|---|---|
| FY2024 Revenue | $518 million |
| FY2024 Net Sales | $523 million |
| End Markets | 5 |
What is included in the product
Detailed Word Document
Provides a concise SWOT overview of Myers Industries, highlighting internal strengths and weaknesses and external opportunities and threats shaping its competitive position.
Customizable Excel Spreadsheet
Provides a concise, visual SWOT matrix tailored to Myers Industries for rapid strategic alignment and stakeholder-ready summaries. Editable format lets teams update strengths, weaknesses, opportunities, and threats quickly to reflect market shifts.
Weaknesses
Exposure to resin price volatility
Polymer inputs link Myers Industries costs directly to oil and petrochemical markets, with resin often representing roughly 20-40% of raw-material expense; Brent crude swung more than 50% between 2020–2024, transmitting volatility to resin pricing. Sudden resin spikes can compress margins before price pass-through; hedging has proven imperfect in tight supply cycles. Customers may resist frequent surcharges, slowing recovery of input-driven margin erosion.
Capital intensity and tooling
Molding operations require ongoing capex—Myers Industries recorded roughly $15 million in capital expenditures in FY2024—primarily for machines and specialized tooling. Changeovers and customized molds add complexity and costs, with tooling lead times commonly 8–16 weeks, slowing new product ramps. Heavy fixed costs make underutilization during downturns press returns and margins.
Distribution-mix margin dilution
Aftermarket distribution often carries lower gross margins than manufactured goods, diluting Myers Industries overall margin profile. A shift in sales mix toward distribution can compress company-level profitability and reduce gross-margin percentage. Increased service complexity in distribution raises operating expenses through logistics, inventory and customer support. It can blur strategic focus between manufacturing and distribution, complicating capital allocation and pricing discipline.
Cyclicality in industrial and auto
Myers Industries faces pronounced cyclicality: industrial production and automotive demand are highly macro-sensitive, so OEM order pushouts quickly ripple through Myers operations, straining inventory and working capital and complicating short-term cash flow management. Agricultural exposure adds weather and commodity-driven volatility, making capacity utilization and production planning more difficult.
- Macro sensitivity
- Order pushouts → inventory/working capital pressure
- Agricultural weather/commodity risk
- Planning & capacity utilization volatility
Brand fragmentation across niches
Myers Industries (NYSE: MYE) serves diverse niches—agriculture, material handling and industrial—which disperses marketing spend and weakens a unified brand presence.
Customers may see SKUs as interchangeable, limiting pricing power in commoditized lines and pressuring margins.
Fragmentation raises sales enablement costs across channels, increasing per-SKU go-to-market expense.
- Segments: agriculture, material handling, industrial
- Risk: diluted brand equity → lower pricing power
- Impact: higher per-SKU sales enablement costs
Polymers tether margins to oil volatility; >50% Brent swings compress profits, tooling capex burden
Polymer inputs link costs to oil/petrochemical markets; resin often 20–40% of raw‑material spend and Brent swung >50% (2020–2024), transmitting volatility and compressing margins.
FY2024 capex ~15 million for molding/tooling; tooling lead times 8–16 weeks raise changeover costs and underutilization risk.
Aftermarket distribution’s lower margins and fragmented segments dilute pricing power and raise per‑SKU go‑to‑market costs.
| Metric | Value |
|---|---|
| Resin share of inputs | 20–40% |
| Brent crude swing (2020–2024) | >50% |
| FY2024 capex | ~$15M |
| Tooling lead time | 8–16 weeks |
Preview the Actual Deliverable
Myers Industries SWOT Analysis
This is the actual SWOT analysis document you’ll receive upon purchase—no surprises, just professional quality. The preview below is taken directly from the full report on Myers Industries, covering strengths, weaknesses, opportunities, and threats. Buy to unlock the complete, editable file.
Original: $10.00
-65%$10.00
$3.50Description
Make Insightful Decisions Backed by Expert Research
Myers Industries shows strength in diversified industrial polymer products and a broad distribution network, but faces margin pressure and exposure to commodity costs. Opportunities include aftermarket expansion and sustainability-driven demand, while competition and cyclical end markets are key threats. Want deeper, actionable insights? Purchase the full SWOT analysis for a detailed, editable report and Excel model.
Strengths
Diverse end-market reach
Serving industrial, agricultural, automotive, commercial and consumer sectors smooths cyclical swings by spreading demand across five end markets and lowering exposure to any single vertical. Broad exposure enables cross-selling of storage, organization and transport solutions across channels, boosting average order depth. Diversification supports scale economies in polymer production and reduces reliance on any single customer.
Polymer manufacturing expertise
Deep know-how in polymer design and molding drives product performance and cost control, supporting Myers Industries’ FY2024 revenue of $518 million and adjusted gross margins that remained resilient amid input inflation. In-house tooling and molding speed prototyping and customization, cutting lead times and lowering unit costs. Process efficiencies underpin margin resilience and create a technical moat that raises customer switching costs.
Complementary distribution network
Myers Industries’ complementary distribution network, including its tire repair and retread channels, delivers steady service-led revenue and recurring customer engagement in 2024. The network broadens customer touchpoints and aftermarket reach, supporting faster product iterations through direct channel feedback. Integrated cross-channel logistics boost fulfillment efficiency and improve inventory turns. This structure strengthens resilience against OEM demand swings.
Portfolio of storage and transport solutions
Myers Industries standardized bins, totes and containers address scalable, recurring needs—repeat purchases and replacement cycles underpin steady demand; FY2024 net sales were about $523 million, with durable goods and industrial segments supporting volumes. Modular designs let customers mix-and-match solutions across sectors, enabling bundled offerings that expand share of wallet.
- Standardized SKUs drive repeat orders
- Replacement cycles = recurring revenue
- Modular mix-and-match boosts cross-sell
- Bundle capability increases share of wallet
Innovation focus and customization
Myers Industries leverages innovative materials and modular design to meet evolving customer needs, enabling customized offerings that command premium pricing and reduce exposure to commodity cycles. Rapid engineering response shortens lead times and differentiates against lower-margin competitors, facilitating entry into niche, higher-margin applications.
- Innovation-driven premium pricing
- Custom solutions = pricing power
- Fast engineering = competitive differentiation
- Access to niche, higher-margin markets
Diversified polymer eased cycles, delivering $518M FY2024 revenue and recurring sales
Serving five end markets smooths cycles and supported FY2024 revenue of $518 million. Deep polymer design and in-house molding upheld resilient adjusted gross margins amid input inflation. Complementary distribution and aftermarket channels sustained recurring service revenue; FY2024 net sales were about $523 million. Standardized, modular SKUs enable cross-sell and premium pricing.
| Metric | Value |
|---|---|
| FY2024 Revenue | $518 million |
| FY2024 Net Sales | $523 million |
| End Markets | 5 |
What is included in the product
Detailed Word Document
Provides a concise SWOT overview of Myers Industries, highlighting internal strengths and weaknesses and external opportunities and threats shaping its competitive position.
Customizable Excel Spreadsheet
Provides a concise, visual SWOT matrix tailored to Myers Industries for rapid strategic alignment and stakeholder-ready summaries. Editable format lets teams update strengths, weaknesses, opportunities, and threats quickly to reflect market shifts.
Weaknesses
Exposure to resin price volatility
Polymer inputs link Myers Industries costs directly to oil and petrochemical markets, with resin often representing roughly 20-40% of raw-material expense; Brent crude swung more than 50% between 2020–2024, transmitting volatility to resin pricing. Sudden resin spikes can compress margins before price pass-through; hedging has proven imperfect in tight supply cycles. Customers may resist frequent surcharges, slowing recovery of input-driven margin erosion.
Capital intensity and tooling
Molding operations require ongoing capex—Myers Industries recorded roughly $15 million in capital expenditures in FY2024—primarily for machines and specialized tooling. Changeovers and customized molds add complexity and costs, with tooling lead times commonly 8–16 weeks, slowing new product ramps. Heavy fixed costs make underutilization during downturns press returns and margins.
Distribution-mix margin dilution
Aftermarket distribution often carries lower gross margins than manufactured goods, diluting Myers Industries overall margin profile. A shift in sales mix toward distribution can compress company-level profitability and reduce gross-margin percentage. Increased service complexity in distribution raises operating expenses through logistics, inventory and customer support. It can blur strategic focus between manufacturing and distribution, complicating capital allocation and pricing discipline.
Cyclicality in industrial and auto
Myers Industries faces pronounced cyclicality: industrial production and automotive demand are highly macro-sensitive, so OEM order pushouts quickly ripple through Myers operations, straining inventory and working capital and complicating short-term cash flow management. Agricultural exposure adds weather and commodity-driven volatility, making capacity utilization and production planning more difficult.
- Macro sensitivity
- Order pushouts → inventory/working capital pressure
- Agricultural weather/commodity risk
- Planning & capacity utilization volatility
Brand fragmentation across niches
Myers Industries (NYSE: MYE) serves diverse niches—agriculture, material handling and industrial—which disperses marketing spend and weakens a unified brand presence.
Customers may see SKUs as interchangeable, limiting pricing power in commoditized lines and pressuring margins.
Fragmentation raises sales enablement costs across channels, increasing per-SKU go-to-market expense.
- Segments: agriculture, material handling, industrial
- Risk: diluted brand equity → lower pricing power
- Impact: higher per-SKU sales enablement costs
Polymers tether margins to oil volatility; >50% Brent swings compress profits, tooling capex burden
Polymer inputs link costs to oil/petrochemical markets; resin often 20–40% of raw‑material spend and Brent swung >50% (2020–2024), transmitting volatility and compressing margins.
FY2024 capex ~15 million for molding/tooling; tooling lead times 8–16 weeks raise changeover costs and underutilization risk.
Aftermarket distribution’s lower margins and fragmented segments dilute pricing power and raise per‑SKU go‑to‑market costs.
| Metric | Value |
|---|---|
| Resin share of inputs | 20–40% |
| Brent crude swing (2020–2024) | >50% |
| FY2024 capex | ~$15M |
| Tooling lead time | 8–16 weeks |
Preview the Actual Deliverable
Myers Industries SWOT Analysis
This is the actual SWOT analysis document you’ll receive upon purchase—no surprises, just professional quality. The preview below is taken directly from the full report on Myers Industries, covering strengths, weaknesses, opportunities, and threats. Buy to unlock the complete, editable file.











