NAPEC Porter's Five Forces Analysis

Go Beyond the Preview—Access the Full Strategic Report
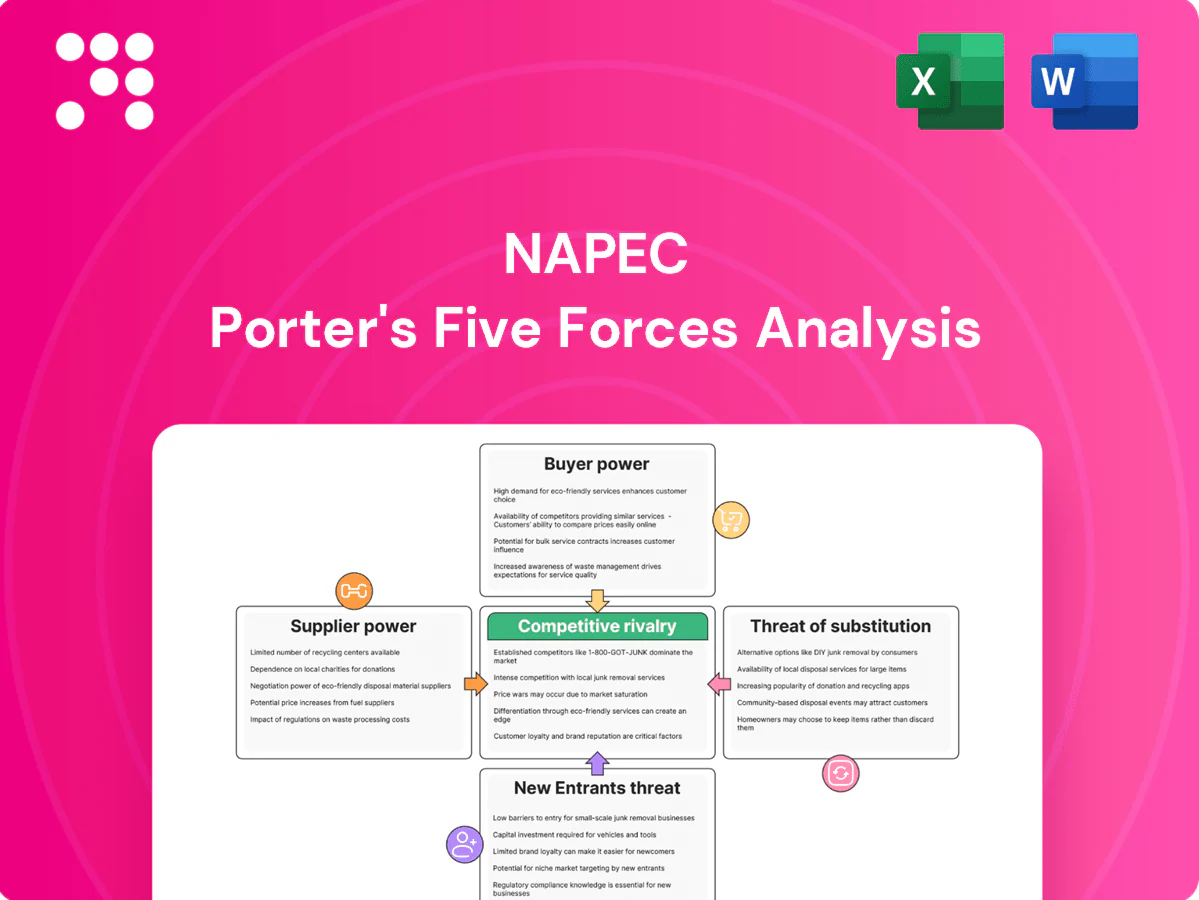
NAPEC’s Porter’s Five Forces snapshot highlights supplier leverage, buyer pressure, competitive rivalry, threat of entrants, and substitute risks shaping its market position. The full Porter's Five Forces Analysis reveals the real forces—from supplier influence to threat of new entrants—and offers force-by-force ratings, visuals, and actionable implications. Ready to move beyond the basics? Unlock the complete report to inform strategy and investment decisions.
Suppliers Bargaining Power

Specialized equipment OEM concentration
Line construction depends on a concentrated set of OEMs (Altec, Terex, Versalift, Elliott), giving suppliers leverage as these vendors supply bucket trucks, cranes and live-line tools. Lead times spiked to as much as 9–12 months in 2024, and required customization raises switching costs during peak build cycles. Supplier delays routinely cascade into project penalties and schedule risk. Framework agreements and fleet standardization reduce but do not eliminate this supplier power.
Skilled union labor and certifications
Qualified linemen, electricians, and high-voltage technicians remain scarce and often unionized, driving wage pressure for NAPEC; apprenticeship programs typically require 3–5 years and many jurisdictions mandate utility certifications in 2024 that constrain alternative labor pools. Overtime premiums during storm response commonly range from 1.5x to 2x base pay, materially magnifying costs. Long-term training pipelines help but do not fully offset persistent scarcity.

Critical materials volatility
Steel, copper, conductors, transformers and poles face recurring commodity and supply-chain shocks that drive project cost uncertainty; transformer lead times have stretched up to 24 months, stalling substation rollouts. Price pass-through clauses exist in many contracts but are not universal across municipal and utility agreements, leaving owners exposed. Strategic sourcing and inventory buffers mitigate risk but do not eliminate exposure to material volatility. Recent market disruptions continue to push procurement risk premia higher.

Digital systems and tooling dependencies
- Concentration: ESRI ~40% (GIS), top 5 SCADA vendors >60%
- Market size: SCADA ~USD 9.3B (2024)
- Cyber cost: avg breach USD 4.45M (2024)
- Switching costs: high due to integration/data lock-in
Logistics and niche subcontractors
NAPEC faces high supplier power where heavy-haul, helicopter stringing, directional drilling and environmental crews are regionally concentrated and scarce; surge demand commonly pushes mobilization and daily rates up 20–50% in 2024 peak windows.
Weather-constrained windows further compress capacity, while preferred-partner networks reduce lead times but maintain supplier leverage through exclusive access and long-term rate uplifts.
- Regional specialization: limited suppliers
- Surge pricing: +20–50% (2024 peak)
- Weather windows: tighter utilization
- Preferred partners: mitigate delays, preserve bargaining power
Supplier power squeezes projects: long lead times, scarce skilled labor, rising cyber and cost risks
Supplier power is high: OEMs (bucket trucks) show 9–12 month lead times and transformers 24 months, skilled labor scarce (apprenticeship 3–5 yrs) and surge rates +20–50% in 2024; GIS/ESRI ~40% share, SCADA market ~USD 9.3B and top5 >60%, cyber breach cost ~USD 4.45M, raising switching costs and project risk despite framework agreements.
| Metric | 2024 Value |
|---|---|
| ESRI (GIS) | ~40% |
| SCADA market | USD 9.3B |
| Avg breach cost | USD 4.45M |
| Transformer lead time | 24 months |
What is included in the product
 Detailed Word Document
Comprehensive Porter's Five Forces analysis for NAPEC, uncovering competitive rivalries, buyer and supplier power, entry barriers, substitutes and disruptive threats, with industry data and strategic commentary to inform pricing, profitability, and defensive or growth strategies.

 Customizable Excel Spreadsheet
NAPEC Porter's Five Forces gives a one-sheet, customizable view of competitive pressure—perfect for quick decisions—and includes an instant spider/radar chart to visualize strategic risk. No macros or complex code, so teams can swap in data, duplicate scenarios, and drop the clean layout straight into decks or reports.
Customers Bargaining Power

Concentrated utility and municipal clients
Investor-owned utilities, cooperatives and municipal utilities account for roughly 70%, 12% and 16% of US electric customers respectively (EIA), concentrating procurement and yielding strong buyer power. They run competitive RFPs with strict technical specs and certification requirements. Large volumes and multi-year frameworks allow them to extract tighter pricing and contract terms. Depth of relationship and past performance heavily influence award decisions.
Rigorous safety and compliance mandates
Buyers enforce stringent safety metrics (TRIR targets often <0.5) and ESG and reliability KPIs (uptime commonly 99–99.9%), with non-compliance risking contract disqualification or multi-million-dollar penalties and suspension. These mandates raise delivery costs and limit contractor flexibility through added compliance systems and audits. Conversely, superior safety records can command a measurable price premium in tender scoring and win rates.

Bid-driven price sensitivity
Most NAPEC work is competitively tendered, forcing mid-single-digit EPC margins (typically 3–6% in 2024) as buyers leverage bids to compress price. Procurement teams compare total cost, delivery schedule, and risk-sharing clauses across multiple EPC firms, with unit-price contracts shifting variability and some cost risk to contractors. Competitive differentiation therefore rests on documented execution history and measurable value-engineering savings.

Moderate switching costs
Utilities can reassign task orders between vendors, yet they favor proven crews to preserve continuity, making switching costs moderate rather than low.
Asset knowledge and as-built data create mild lock-in because retaining institutional memory reduces risk and downtime when crews remain consistent.
Poor performance accelerates switching, while strong service-level delivery and on-time restoration materially reduce churn and protect margins.
- Proven crews preserve continuity
- As-built data causes mild lock-in
- Poor performance triggers faster switches
- High SLAs lower churn
Storm response leverage
Mutual aid and emergency call-outs give buyers strong leverage during urgent mobilizations, forcing suppliers to prioritize rapid deployment and accept tight oversight. Time-and-materials rates are typically pre-negotiated but are intensively scrutinized after events, with post-event audits shaping future contracting. Performance during outages directly influences repeat awards, making proven rapid mobilization a decisive competitive edge.
- Mutual aid: rapid reprioritization leverage
- Pre-negotiated T&M: subject to post-event audit
- Outage performance: driver of future contracts
- Mobilization speed: key differentiator
Utilities consolidate procurement: RFPs, 3–6% EPC margins, uptime 99–99.9%
Large utilities (70% investor-owned; 12% co-ops; 16% municipal) concentrate procurement, driving strong buyer power, RFPs and mid-single-digit EPC margins (3–6% in 2024). Stringent KPIs (TRIR <0.5; uptime 99–99.9%) raise compliance costs and sharpen award criteria. Outage performance and rapid mobilization determine repeat business and penalties.
| Metric | 2024 |
|---|---|
| EPC margins | 3–6% |
| Utility mix | 70/12/16% |
| TRIR | <0.5 |
Same Document Delivered
NAPEC Porter's Five Forces Analysis
This preview shows the exact NAPEC Porter’s Five Forces analysis you’ll receive—fully written, formatted, and ready for immediate download after purchase. It delivers the complete competitive assessment, supplier and buyer dynamics, threat analyses, and practical strategic implications. No mockups or placeholders; this is the final, ready-to-use deliverable.

Go Beyond the Preview—Access the Full Strategic Report
NAPEC’s Porter’s Five Forces snapshot highlights supplier leverage, buyer pressure, competitive rivalry, threat of entrants, and substitute risks shaping its market position. The full Porter's Five Forces Analysis reveals the real forces—from supplier influence to threat of new entrants—and offers force-by-force ratings, visuals, and actionable implications. Ready to move beyond the basics? Unlock the complete report to inform strategy and investment decisions.
Suppliers Bargaining Power
Specialized equipment OEM concentration
Line construction depends on a concentrated set of OEMs (Altec, Terex, Versalift, Elliott), giving suppliers leverage as these vendors supply bucket trucks, cranes and live-line tools. Lead times spiked to as much as 9–12 months in 2024, and required customization raises switching costs during peak build cycles. Supplier delays routinely cascade into project penalties and schedule risk. Framework agreements and fleet standardization reduce but do not eliminate this supplier power.
Skilled union labor and certifications
Qualified linemen, electricians, and high-voltage technicians remain scarce and often unionized, driving wage pressure for NAPEC; apprenticeship programs typically require 3–5 years and many jurisdictions mandate utility certifications in 2024 that constrain alternative labor pools. Overtime premiums during storm response commonly range from 1.5x to 2x base pay, materially magnifying costs. Long-term training pipelines help but do not fully offset persistent scarcity.
Critical materials volatility
Steel, copper, conductors, transformers and poles face recurring commodity and supply-chain shocks that drive project cost uncertainty; transformer lead times have stretched up to 24 months, stalling substation rollouts. Price pass-through clauses exist in many contracts but are not universal across municipal and utility agreements, leaving owners exposed. Strategic sourcing and inventory buffers mitigate risk but do not eliminate exposure to material volatility. Recent market disruptions continue to push procurement risk premia higher.
Digital systems and tooling dependencies
- Concentration: ESRI ~40% (GIS), top 5 SCADA vendors >60%
- Market size: SCADA ~USD 9.3B (2024)
- Cyber cost: avg breach USD 4.45M (2024)
- Switching costs: high due to integration/data lock-in
Logistics and niche subcontractors
NAPEC faces high supplier power where heavy-haul, helicopter stringing, directional drilling and environmental crews are regionally concentrated and scarce; surge demand commonly pushes mobilization and daily rates up 20–50% in 2024 peak windows.
Weather-constrained windows further compress capacity, while preferred-partner networks reduce lead times but maintain supplier leverage through exclusive access and long-term rate uplifts.
- Regional specialization: limited suppliers
- Surge pricing: +20–50% (2024 peak)
- Weather windows: tighter utilization
- Preferred partners: mitigate delays, preserve bargaining power
Supplier power squeezes projects: long lead times, scarce skilled labor, rising cyber and cost risks
Supplier power is high: OEMs (bucket trucks) show 9–12 month lead times and transformers 24 months, skilled labor scarce (apprenticeship 3–5 yrs) and surge rates +20–50% in 2024; GIS/ESRI ~40% share, SCADA market ~USD 9.3B and top5 >60%, cyber breach cost ~USD 4.45M, raising switching costs and project risk despite framework agreements.
| Metric | 2024 Value |
|---|---|
| ESRI (GIS) | ~40% |
| SCADA market | USD 9.3B |
| Avg breach cost | USD 4.45M |
| Transformer lead time | 24 months |
What is included in the product
Detailed Word Document
Comprehensive Porter's Five Forces analysis for NAPEC, uncovering competitive rivalries, buyer and supplier power, entry barriers, substitutes and disruptive threats, with industry data and strategic commentary to inform pricing, profitability, and defensive or growth strategies.
Customizable Excel Spreadsheet
NAPEC Porter's Five Forces gives a one-sheet, customizable view of competitive pressure—perfect for quick decisions—and includes an instant spider/radar chart to visualize strategic risk. No macros or complex code, so teams can swap in data, duplicate scenarios, and drop the clean layout straight into decks or reports.
Customers Bargaining Power
Concentrated utility and municipal clients
Investor-owned utilities, cooperatives and municipal utilities account for roughly 70%, 12% and 16% of US electric customers respectively (EIA), concentrating procurement and yielding strong buyer power. They run competitive RFPs with strict technical specs and certification requirements. Large volumes and multi-year frameworks allow them to extract tighter pricing and contract terms. Depth of relationship and past performance heavily influence award decisions.
Rigorous safety and compliance mandates
Buyers enforce stringent safety metrics (TRIR targets often <0.5) and ESG and reliability KPIs (uptime commonly 99–99.9%), with non-compliance risking contract disqualification or multi-million-dollar penalties and suspension. These mandates raise delivery costs and limit contractor flexibility through added compliance systems and audits. Conversely, superior safety records can command a measurable price premium in tender scoring and win rates.
Bid-driven price sensitivity
Most NAPEC work is competitively tendered, forcing mid-single-digit EPC margins (typically 3–6% in 2024) as buyers leverage bids to compress price. Procurement teams compare total cost, delivery schedule, and risk-sharing clauses across multiple EPC firms, with unit-price contracts shifting variability and some cost risk to contractors. Competitive differentiation therefore rests on documented execution history and measurable value-engineering savings.
Moderate switching costs
Utilities can reassign task orders between vendors, yet they favor proven crews to preserve continuity, making switching costs moderate rather than low.
Asset knowledge and as-built data create mild lock-in because retaining institutional memory reduces risk and downtime when crews remain consistent.
Poor performance accelerates switching, while strong service-level delivery and on-time restoration materially reduce churn and protect margins.
- Proven crews preserve continuity
- As-built data causes mild lock-in
- Poor performance triggers faster switches
- High SLAs lower churn
Storm response leverage
Mutual aid and emergency call-outs give buyers strong leverage during urgent mobilizations, forcing suppliers to prioritize rapid deployment and accept tight oversight. Time-and-materials rates are typically pre-negotiated but are intensively scrutinized after events, with post-event audits shaping future contracting. Performance during outages directly influences repeat awards, making proven rapid mobilization a decisive competitive edge.
- Mutual aid: rapid reprioritization leverage
- Pre-negotiated T&M: subject to post-event audit
- Outage performance: driver of future contracts
- Mobilization speed: key differentiator
Utilities consolidate procurement: RFPs, 3–6% EPC margins, uptime 99–99.9%
Large utilities (70% investor-owned; 12% co-ops; 16% municipal) concentrate procurement, driving strong buyer power, RFPs and mid-single-digit EPC margins (3–6% in 2024). Stringent KPIs (TRIR <0.5; uptime 99–99.9%) raise compliance costs and sharpen award criteria. Outage performance and rapid mobilization determine repeat business and penalties.
| Metric | 2024 |
|---|---|
| EPC margins | 3–6% |
| Utility mix | 70/12/16% |
| TRIR | <0.5 |
Same Document Delivered
NAPEC Porter's Five Forces Analysis
This preview shows the exact NAPEC Porter’s Five Forces analysis you’ll receive—fully written, formatted, and ready for immediate download after purchase. It delivers the complete competitive assessment, supplier and buyer dynamics, threat analyses, and practical strategic implications. No mockups or placeholders; this is the final, ready-to-use deliverable.
Original: $10.00
-65%$10.00
$3.50Description
Go Beyond the Preview—Access the Full Strategic Report
NAPEC’s Porter’s Five Forces snapshot highlights supplier leverage, buyer pressure, competitive rivalry, threat of entrants, and substitute risks shaping its market position. The full Porter's Five Forces Analysis reveals the real forces—from supplier influence to threat of new entrants—and offers force-by-force ratings, visuals, and actionable implications. Ready to move beyond the basics? Unlock the complete report to inform strategy and investment decisions.
Suppliers Bargaining Power
Specialized equipment OEM concentration
Line construction depends on a concentrated set of OEMs (Altec, Terex, Versalift, Elliott), giving suppliers leverage as these vendors supply bucket trucks, cranes and live-line tools. Lead times spiked to as much as 9–12 months in 2024, and required customization raises switching costs during peak build cycles. Supplier delays routinely cascade into project penalties and schedule risk. Framework agreements and fleet standardization reduce but do not eliminate this supplier power.
Skilled union labor and certifications
Qualified linemen, electricians, and high-voltage technicians remain scarce and often unionized, driving wage pressure for NAPEC; apprenticeship programs typically require 3–5 years and many jurisdictions mandate utility certifications in 2024 that constrain alternative labor pools. Overtime premiums during storm response commonly range from 1.5x to 2x base pay, materially magnifying costs. Long-term training pipelines help but do not fully offset persistent scarcity.
Critical materials volatility
Steel, copper, conductors, transformers and poles face recurring commodity and supply-chain shocks that drive project cost uncertainty; transformer lead times have stretched up to 24 months, stalling substation rollouts. Price pass-through clauses exist in many contracts but are not universal across municipal and utility agreements, leaving owners exposed. Strategic sourcing and inventory buffers mitigate risk but do not eliminate exposure to material volatility. Recent market disruptions continue to push procurement risk premia higher.
Digital systems and tooling dependencies
- Concentration: ESRI ~40% (GIS), top 5 SCADA vendors >60%
- Market size: SCADA ~USD 9.3B (2024)
- Cyber cost: avg breach USD 4.45M (2024)
- Switching costs: high due to integration/data lock-in
Logistics and niche subcontractors
NAPEC faces high supplier power where heavy-haul, helicopter stringing, directional drilling and environmental crews are regionally concentrated and scarce; surge demand commonly pushes mobilization and daily rates up 20–50% in 2024 peak windows.
Weather-constrained windows further compress capacity, while preferred-partner networks reduce lead times but maintain supplier leverage through exclusive access and long-term rate uplifts.
- Regional specialization: limited suppliers
- Surge pricing: +20–50% (2024 peak)
- Weather windows: tighter utilization
- Preferred partners: mitigate delays, preserve bargaining power
Supplier power squeezes projects: long lead times, scarce skilled labor, rising cyber and cost risks
Supplier power is high: OEMs (bucket trucks) show 9–12 month lead times and transformers 24 months, skilled labor scarce (apprenticeship 3–5 yrs) and surge rates +20–50% in 2024; GIS/ESRI ~40% share, SCADA market ~USD 9.3B and top5 >60%, cyber breach cost ~USD 4.45M, raising switching costs and project risk despite framework agreements.
| Metric | 2024 Value |
|---|---|
| ESRI (GIS) | ~40% |
| SCADA market | USD 9.3B |
| Avg breach cost | USD 4.45M |
| Transformer lead time | 24 months |
What is included in the product
Detailed Word Document
Comprehensive Porter's Five Forces analysis for NAPEC, uncovering competitive rivalries, buyer and supplier power, entry barriers, substitutes and disruptive threats, with industry data and strategic commentary to inform pricing, profitability, and defensive or growth strategies.
Customizable Excel Spreadsheet
NAPEC Porter's Five Forces gives a one-sheet, customizable view of competitive pressure—perfect for quick decisions—and includes an instant spider/radar chart to visualize strategic risk. No macros or complex code, so teams can swap in data, duplicate scenarios, and drop the clean layout straight into decks or reports.
Customers Bargaining Power
Concentrated utility and municipal clients
Investor-owned utilities, cooperatives and municipal utilities account for roughly 70%, 12% and 16% of US electric customers respectively (EIA), concentrating procurement and yielding strong buyer power. They run competitive RFPs with strict technical specs and certification requirements. Large volumes and multi-year frameworks allow them to extract tighter pricing and contract terms. Depth of relationship and past performance heavily influence award decisions.
Rigorous safety and compliance mandates
Buyers enforce stringent safety metrics (TRIR targets often <0.5) and ESG and reliability KPIs (uptime commonly 99–99.9%), with non-compliance risking contract disqualification or multi-million-dollar penalties and suspension. These mandates raise delivery costs and limit contractor flexibility through added compliance systems and audits. Conversely, superior safety records can command a measurable price premium in tender scoring and win rates.
Bid-driven price sensitivity
Most NAPEC work is competitively tendered, forcing mid-single-digit EPC margins (typically 3–6% in 2024) as buyers leverage bids to compress price. Procurement teams compare total cost, delivery schedule, and risk-sharing clauses across multiple EPC firms, with unit-price contracts shifting variability and some cost risk to contractors. Competitive differentiation therefore rests on documented execution history and measurable value-engineering savings.
Moderate switching costs
Utilities can reassign task orders between vendors, yet they favor proven crews to preserve continuity, making switching costs moderate rather than low.
Asset knowledge and as-built data create mild lock-in because retaining institutional memory reduces risk and downtime when crews remain consistent.
Poor performance accelerates switching, while strong service-level delivery and on-time restoration materially reduce churn and protect margins.
- Proven crews preserve continuity
- As-built data causes mild lock-in
- Poor performance triggers faster switches
- High SLAs lower churn
Storm response leverage
Mutual aid and emergency call-outs give buyers strong leverage during urgent mobilizations, forcing suppliers to prioritize rapid deployment and accept tight oversight. Time-and-materials rates are typically pre-negotiated but are intensively scrutinized after events, with post-event audits shaping future contracting. Performance during outages directly influences repeat awards, making proven rapid mobilization a decisive competitive edge.
- Mutual aid: rapid reprioritization leverage
- Pre-negotiated T&M: subject to post-event audit
- Outage performance: driver of future contracts
- Mobilization speed: key differentiator
Utilities consolidate procurement: RFPs, 3–6% EPC margins, uptime 99–99.9%
Large utilities (70% investor-owned; 12% co-ops; 16% municipal) concentrate procurement, driving strong buyer power, RFPs and mid-single-digit EPC margins (3–6% in 2024). Stringent KPIs (TRIR <0.5; uptime 99–99.9%) raise compliance costs and sharpen award criteria. Outage performance and rapid mobilization determine repeat business and penalties.
| Metric | 2024 |
|---|---|
| EPC margins | 3–6% |
| Utility mix | 70/12/16% |
| TRIR | <0.5 |
Same Document Delivered
NAPEC Porter's Five Forces Analysis
This preview shows the exact NAPEC Porter’s Five Forces analysis you’ll receive—fully written, formatted, and ready for immediate download after purchase. It delivers the complete competitive assessment, supplier and buyer dynamics, threat analyses, and practical strategic implications. No mockups or placeholders; this is the final, ready-to-use deliverable.











