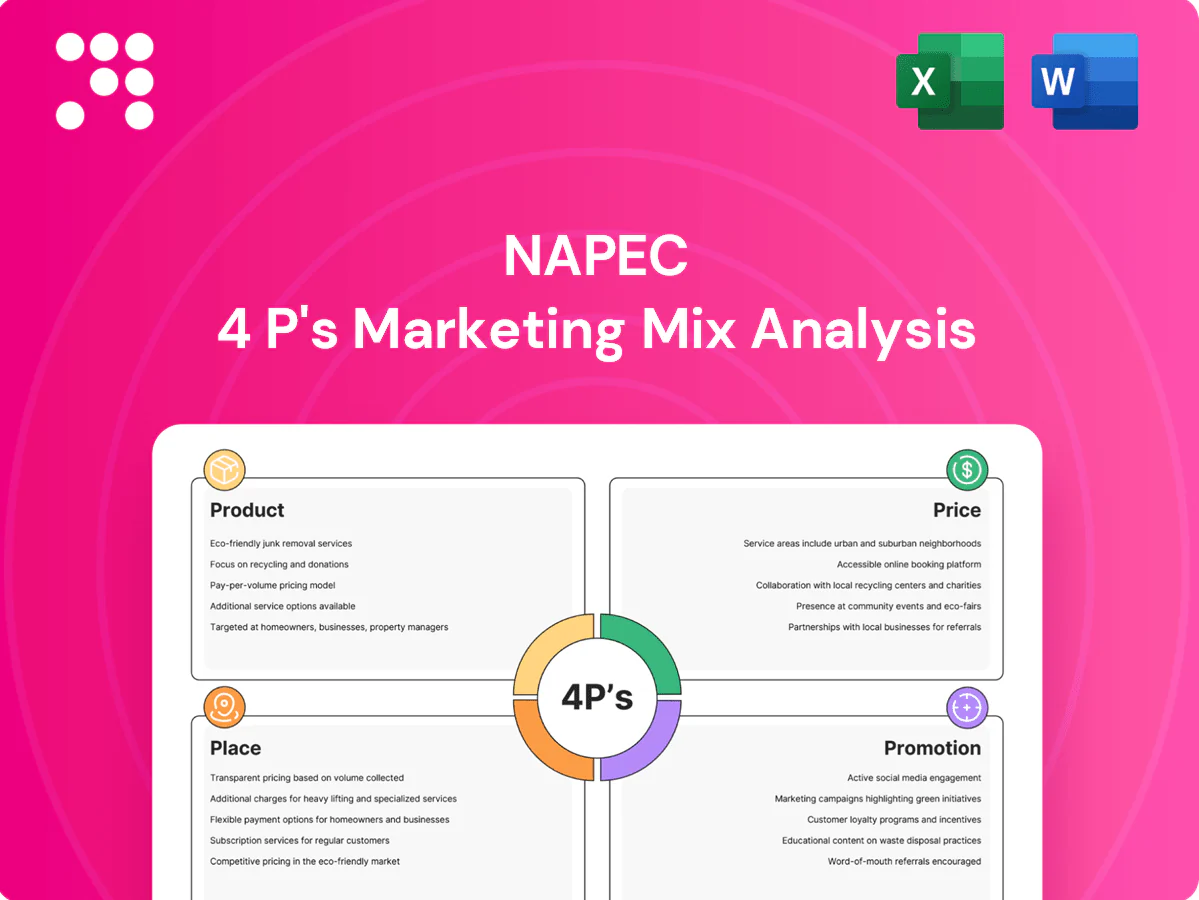
NAPEC Marketing Mix

Your Shortcut to a Strategic 4Ps Breakdown
Discover how NAPEC’s Product, Price, Place and Promotion choices create market advantage—this concise preview only scratches the surface; purchase the full, editable 4Ps Marketing Mix Analysis to access data-driven insights, templates, and ready-to-use slides for strategy, benchmarking, or coursework.
Product

Grid construction & maintenance
NAPEC delivers end-to-end EPC and O&M for transmission and distribution from LV up to 765 kV, covering line design, pole/tower erection, stringing, reconductoring and preventive maintenance. Tailored programs cut outages 20–30% and lifecycle costs 10–20%, while driving SAIDI improvements and meeting safety and regulatory standards (2024 industry benchmarks).
Substations & protection
Design-build and retrofit services for substations, switchyards and protection and control systems deliver turnkey upgrades and NAPEC positioning for 2024 project pipelines. Integration of SCADA, digital relays and automation enhances grid resilience and situational awareness while complying with North American Electric Reliability Corporation (NERC) reliability and CIP frameworks. Comprehensive testing, commissioning and targeted asset refresh programs extend useful life and optimize total cost of ownership.

Public lighting solutions
NAPEC installs, converts and maintains roadway, municipal and area lighting with audits, photometrics and turnkey program delivery. LED upgrades with smart controls cut energy use 50–70% per US DOE and typically reduce O&M 30–50%, yielding paybacks commonly of 2–7 years. Services prioritize uptime above 99%, measurable safety improvements and transparent financial reporting for lifecycle cost reduction.

Traffic systems services
Traffic systems services cover deployment and upkeep of traffic signals, ITS cabinets and communications, coordinated with DOTs for timing plans and safety compliance; adaptive timing can cut urban travel delays up to 25% and incident response times up to 30% (2020–24 studies). Services include emergency call-outs and 24/7 support to minimize congestion and recovery costs.
- DOT coordination
- Adaptive timing: ≤25% delay reduction
- Incident clearance: ≤30% faster
- 24/7 emergency call-outs
Storm response & emergency
Storm response & emergency teams mobilize within 2–6 hours after severe weather; EEI and industry mutual-aid data (2023–24) show mutual assistance can reduce MTTR by up to 50%. Prioritized restoration plans with utilities and municipalities drive customer satisfaction gains of up to 20 points in reported CSAT surveys. Crews deploy specialized equipment and strict safety protocols for wildfire and storm restoration.
- Rapid mobilization: 2–6 hour deployment
- Mutual-aid impact: MTTR down up to 50% (EEI 2023–24)
- Prioritized plans: CSAT + up to 20 points
- Specialized crews: wildfire/storm safety protocols
End-to-end T&D: outages down 20-30%, LED cuts energy 50-70%
NAPEC delivers end-to-end EPC/O&M for T&D (LV–765 kV), substations, lighting, traffic systems and storm response, driving outages down 20–30%, lifecycle costs down 10–20% and SAIDI gains (2024 benchmarks). LED conversions cut energy 50–70% with 2–7 year paybacks; mobilization in 2–6 hours; mutual aid can halve MTTR (EEI 2023–24).
| Service | Key metric | 2024/25 benchmark |
|---|---|---|
| T&D EPC/O&M | Outages ↓ / Lifecycle ↓ | 20–30% / 10–20% |
| Substations | Grid resilience, SCADA | NERC/CIP compliant |
| Lighting | Energy ↓ / Payback | 50–70% / 2–7 yrs |
| Storm response | Mobilization / MTTR | 2–6 hrs / −50% |
What is included in the product
 Detailed Word Document
Delivers a concise, company-specific deep dive into NAPEC’s Product, Price, Place, and Promotion strategies, using real practices and competitive context to ground recommendations. Ideal for managers and consultants needing a ready-to-use, professionally structured marketing positioning brief.

 Customizable Excel Spreadsheet
Condenses NAPEC's 4P marketing analysis into a concise, plug-and-play one-pager that removes decision paralysis by highlighting actionable product, price, place and promotion priorities. Ideal for leadership briefs, cross-functional alignment, and rapid comparison across brands or scenarios.
Place

North America footprint
Operations concentrated in Canada and the United States with regional hubs enable coverage across the continent, aligning with North America’s ~4,500 TWh annual electricity demand (US ~3,900 TWh, Canada ~600 TWh). Proximity to utility territories accelerates dispatch and cuts travel time for crews, lowering operating costs and improving response for peak events. Local permitting and right-of-way expertise shortens project timelines versus nonlocal entrants. Cross-border reach supports multi-state and provincial incentive programs and large-scale fleet coordination.
Direct-to-utility channels
Direct-to-utility channels rely primarily on utility master service agreements and long-term frameworks, commonly 3–5 years, as the primary contracting vehicle. Direct engagement with IOUs, which serve roughly 70% of U.S. electricity customers, plus munis and co-ops, enables a broad operational footprint. Streamlined onboarding and safety qualification shorten project starts from months to weeks. Account teams align schedules with grid operations to minimize outages.

Public sector procurement
NAPEC responds to RFPs and standing offers for municipalities and DOTs funded partly by the $1.2 trillion IIJA, bidding on 1–5 year term contracts; bonding standards (typical bid bonds 5–10%) and OSHA/EPA EHS rules are met; transparent pricing and detailed reporting satisfy municipal and federal audit requirements, enabling multi-year task orders for predictable delivery.

All-weather field deployment
All-weather field deployment positions mobile crews, 12 regional yards and a 48-unit fleet for rapid coverage, achieving median outage response of 4.5 hours in 2024. Mutual-aid networks provide seasonal and emergency surge capacity—up to 150% additional workforce during major storms—while logistics teams coordinate materials, permits and planned outages to cut downtime by ~22%. Digital scheduling raised crew utilization 18% year-over-year.
- yards: 12
- fleet: 48 units
- median restoration: 4.5 hrs (2024)
- surge capacity: +150%
- downtime reduction: ~22%
- utilization gain: +18%
Supplier and OEM partnerships
Aligned partnerships with pole, conductor, transformer, and controls OEMs enable early procurement that secures critical-component lead times of 12–20 weeks, cuts procurement costs by ~8% through volume deals, and uses vendor-managed inventory to reduce site delays by as much as 40% in recent grid projects. Standardized BOMs produce consistent quality, lowering rework rates and warranty claims across installs.
- Aligned OEMs: poles, conductors, transformers, controls
- Lead-time secured: 12–20 weeks
- Cost savings: ~8% via volume procurement
- VMI impact: up to 40% fewer site delays
- Standardized BOMs: lower rework/warranty claims
Regional hubs align to 4,500 TWh with 12 yards, 48-unit fleet
Regional hubs across US/Canada align with North America’s ~4,500 TWh demand (US ~3,900; Canada ~600), enabling faster dispatch, local permitting advantage and multi-jurisdiction incentives. Operations: 12 yards, 48-unit fleet; 2024 median restoration 4.5 hrs, surge +150%, utilization +18%; procurement lead-times 12–20 wks, ~8% cost saving.
| Metric | Value |
|---|---|
| Yards | 12 |
| Fleet | 48 units |
| Median restoration (2024) | 4.5 hrs |
| Surge capacity | +150% |
| Utilization gain | +18% |
| Lead times | 12–20 wks |
| Procurement saving | ~8% |
Preview the Actual Deliverable
NAPEC 4P's Marketing Mix Analysis
You’re viewing the NAPEC 4P's Marketing Mix Analysis — a detailed, actionable breakdown of Product, Price, Place and Promotion tailored for strategic use. The preview shown here is the exact, fully finished document you’ll receive instantly after purchase—no mockups or samples. Downloadable, editable, and ready to implement in presentations or planning.

Your Shortcut to a Strategic 4Ps Breakdown
Discover how NAPEC’s Product, Price, Place and Promotion choices create market advantage—this concise preview only scratches the surface; purchase the full, editable 4Ps Marketing Mix Analysis to access data-driven insights, templates, and ready-to-use slides for strategy, benchmarking, or coursework.
Product
Grid construction & maintenance
NAPEC delivers end-to-end EPC and O&M for transmission and distribution from LV up to 765 kV, covering line design, pole/tower erection, stringing, reconductoring and preventive maintenance. Tailored programs cut outages 20–30% and lifecycle costs 10–20%, while driving SAIDI improvements and meeting safety and regulatory standards (2024 industry benchmarks).
Substations & protection
Design-build and retrofit services for substations, switchyards and protection and control systems deliver turnkey upgrades and NAPEC positioning for 2024 project pipelines. Integration of SCADA, digital relays and automation enhances grid resilience and situational awareness while complying with North American Electric Reliability Corporation (NERC) reliability and CIP frameworks. Comprehensive testing, commissioning and targeted asset refresh programs extend useful life and optimize total cost of ownership.
Public lighting solutions
NAPEC installs, converts and maintains roadway, municipal and area lighting with audits, photometrics and turnkey program delivery. LED upgrades with smart controls cut energy use 50–70% per US DOE and typically reduce O&M 30–50%, yielding paybacks commonly of 2–7 years. Services prioritize uptime above 99%, measurable safety improvements and transparent financial reporting for lifecycle cost reduction.
Traffic systems services
Traffic systems services cover deployment and upkeep of traffic signals, ITS cabinets and communications, coordinated with DOTs for timing plans and safety compliance; adaptive timing can cut urban travel delays up to 25% and incident response times up to 30% (2020–24 studies). Services include emergency call-outs and 24/7 support to minimize congestion and recovery costs.
- DOT coordination
- Adaptive timing: ≤25% delay reduction
- Incident clearance: ≤30% faster
- 24/7 emergency call-outs
Storm response & emergency
Storm response & emergency teams mobilize within 2–6 hours after severe weather; EEI and industry mutual-aid data (2023–24) show mutual assistance can reduce MTTR by up to 50%. Prioritized restoration plans with utilities and municipalities drive customer satisfaction gains of up to 20 points in reported CSAT surveys. Crews deploy specialized equipment and strict safety protocols for wildfire and storm restoration.
- Rapid mobilization: 2–6 hour deployment
- Mutual-aid impact: MTTR down up to 50% (EEI 2023–24)
- Prioritized plans: CSAT + up to 20 points
- Specialized crews: wildfire/storm safety protocols
End-to-end T&D: outages down 20-30%, LED cuts energy 50-70%
NAPEC delivers end-to-end EPC/O&M for T&D (LV–765 kV), substations, lighting, traffic systems and storm response, driving outages down 20–30%, lifecycle costs down 10–20% and SAIDI gains (2024 benchmarks). LED conversions cut energy 50–70% with 2–7 year paybacks; mobilization in 2–6 hours; mutual aid can halve MTTR (EEI 2023–24).
| Service | Key metric | 2024/25 benchmark |
|---|---|---|
| T&D EPC/O&M | Outages ↓ / Lifecycle ↓ | 20–30% / 10–20% |
| Substations | Grid resilience, SCADA | NERC/CIP compliant |
| Lighting | Energy ↓ / Payback | 50–70% / 2–7 yrs |
| Storm response | Mobilization / MTTR | 2–6 hrs / −50% |
What is included in the product
Detailed Word Document
Delivers a concise, company-specific deep dive into NAPEC’s Product, Price, Place, and Promotion strategies, using real practices and competitive context to ground recommendations. Ideal for managers and consultants needing a ready-to-use, professionally structured marketing positioning brief.
Customizable Excel Spreadsheet
Condenses NAPEC's 4P marketing analysis into a concise, plug-and-play one-pager that removes decision paralysis by highlighting actionable product, price, place and promotion priorities. Ideal for leadership briefs, cross-functional alignment, and rapid comparison across brands or scenarios.
Place
North America footprint
Operations concentrated in Canada and the United States with regional hubs enable coverage across the continent, aligning with North America’s ~4,500 TWh annual electricity demand (US ~3,900 TWh, Canada ~600 TWh). Proximity to utility territories accelerates dispatch and cuts travel time for crews, lowering operating costs and improving response for peak events. Local permitting and right-of-way expertise shortens project timelines versus nonlocal entrants. Cross-border reach supports multi-state and provincial incentive programs and large-scale fleet coordination.
Direct-to-utility channels
Direct-to-utility channels rely primarily on utility master service agreements and long-term frameworks, commonly 3–5 years, as the primary contracting vehicle. Direct engagement with IOUs, which serve roughly 70% of U.S. electricity customers, plus munis and co-ops, enables a broad operational footprint. Streamlined onboarding and safety qualification shorten project starts from months to weeks. Account teams align schedules with grid operations to minimize outages.
Public sector procurement
NAPEC responds to RFPs and standing offers for municipalities and DOTs funded partly by the $1.2 trillion IIJA, bidding on 1–5 year term contracts; bonding standards (typical bid bonds 5–10%) and OSHA/EPA EHS rules are met; transparent pricing and detailed reporting satisfy municipal and federal audit requirements, enabling multi-year task orders for predictable delivery.
All-weather field deployment
All-weather field deployment positions mobile crews, 12 regional yards and a 48-unit fleet for rapid coverage, achieving median outage response of 4.5 hours in 2024. Mutual-aid networks provide seasonal and emergency surge capacity—up to 150% additional workforce during major storms—while logistics teams coordinate materials, permits and planned outages to cut downtime by ~22%. Digital scheduling raised crew utilization 18% year-over-year.
- yards: 12
- fleet: 48 units
- median restoration: 4.5 hrs (2024)
- surge capacity: +150%
- downtime reduction: ~22%
- utilization gain: +18%
Supplier and OEM partnerships
Aligned partnerships with pole, conductor, transformer, and controls OEMs enable early procurement that secures critical-component lead times of 12–20 weeks, cuts procurement costs by ~8% through volume deals, and uses vendor-managed inventory to reduce site delays by as much as 40% in recent grid projects. Standardized BOMs produce consistent quality, lowering rework rates and warranty claims across installs.
- Aligned OEMs: poles, conductors, transformers, controls
- Lead-time secured: 12–20 weeks
- Cost savings: ~8% via volume procurement
- VMI impact: up to 40% fewer site delays
- Standardized BOMs: lower rework/warranty claims
Regional hubs align to 4,500 TWh with 12 yards, 48-unit fleet
Regional hubs across US/Canada align with North America’s ~4,500 TWh demand (US ~3,900; Canada ~600), enabling faster dispatch, local permitting advantage and multi-jurisdiction incentives. Operations: 12 yards, 48-unit fleet; 2024 median restoration 4.5 hrs, surge +150%, utilization +18%; procurement lead-times 12–20 wks, ~8% cost saving.
| Metric | Value |
|---|---|
| Yards | 12 |
| Fleet | 48 units |
| Median restoration (2024) | 4.5 hrs |
| Surge capacity | +150% |
| Utilization gain | +18% |
| Lead times | 12–20 wks |
| Procurement saving | ~8% |
Preview the Actual Deliverable
NAPEC 4P's Marketing Mix Analysis
You’re viewing the NAPEC 4P's Marketing Mix Analysis — a detailed, actionable breakdown of Product, Price, Place and Promotion tailored for strategic use. The preview shown here is the exact, fully finished document you’ll receive instantly after purchase—no mockups or samples. Downloadable, editable, and ready to implement in presentations or planning.
Original: $10.00
-65%$10.00
$3.50Description
Your Shortcut to a Strategic 4Ps Breakdown
Discover how NAPEC’s Product, Price, Place and Promotion choices create market advantage—this concise preview only scratches the surface; purchase the full, editable 4Ps Marketing Mix Analysis to access data-driven insights, templates, and ready-to-use slides for strategy, benchmarking, or coursework.
Product
Grid construction & maintenance
NAPEC delivers end-to-end EPC and O&M for transmission and distribution from LV up to 765 kV, covering line design, pole/tower erection, stringing, reconductoring and preventive maintenance. Tailored programs cut outages 20–30% and lifecycle costs 10–20%, while driving SAIDI improvements and meeting safety and regulatory standards (2024 industry benchmarks).
Substations & protection
Design-build and retrofit services for substations, switchyards and protection and control systems deliver turnkey upgrades and NAPEC positioning for 2024 project pipelines. Integration of SCADA, digital relays and automation enhances grid resilience and situational awareness while complying with North American Electric Reliability Corporation (NERC) reliability and CIP frameworks. Comprehensive testing, commissioning and targeted asset refresh programs extend useful life and optimize total cost of ownership.
Public lighting solutions
NAPEC installs, converts and maintains roadway, municipal and area lighting with audits, photometrics and turnkey program delivery. LED upgrades with smart controls cut energy use 50–70% per US DOE and typically reduce O&M 30–50%, yielding paybacks commonly of 2–7 years. Services prioritize uptime above 99%, measurable safety improvements and transparent financial reporting for lifecycle cost reduction.
Traffic systems services
Traffic systems services cover deployment and upkeep of traffic signals, ITS cabinets and communications, coordinated with DOTs for timing plans and safety compliance; adaptive timing can cut urban travel delays up to 25% and incident response times up to 30% (2020–24 studies). Services include emergency call-outs and 24/7 support to minimize congestion and recovery costs.
- DOT coordination
- Adaptive timing: ≤25% delay reduction
- Incident clearance: ≤30% faster
- 24/7 emergency call-outs
Storm response & emergency
Storm response & emergency teams mobilize within 2–6 hours after severe weather; EEI and industry mutual-aid data (2023–24) show mutual assistance can reduce MTTR by up to 50%. Prioritized restoration plans with utilities and municipalities drive customer satisfaction gains of up to 20 points in reported CSAT surveys. Crews deploy specialized equipment and strict safety protocols for wildfire and storm restoration.
- Rapid mobilization: 2–6 hour deployment
- Mutual-aid impact: MTTR down up to 50% (EEI 2023–24)
- Prioritized plans: CSAT + up to 20 points
- Specialized crews: wildfire/storm safety protocols
End-to-end T&D: outages down 20-30%, LED cuts energy 50-70%
NAPEC delivers end-to-end EPC/O&M for T&D (LV–765 kV), substations, lighting, traffic systems and storm response, driving outages down 20–30%, lifecycle costs down 10–20% and SAIDI gains (2024 benchmarks). LED conversions cut energy 50–70% with 2–7 year paybacks; mobilization in 2–6 hours; mutual aid can halve MTTR (EEI 2023–24).
| Service | Key metric | 2024/25 benchmark |
|---|---|---|
| T&D EPC/O&M | Outages ↓ / Lifecycle ↓ | 20–30% / 10–20% |
| Substations | Grid resilience, SCADA | NERC/CIP compliant |
| Lighting | Energy ↓ / Payback | 50–70% / 2–7 yrs |
| Storm response | Mobilization / MTTR | 2–6 hrs / −50% |
What is included in the product
Detailed Word Document
Delivers a concise, company-specific deep dive into NAPEC’s Product, Price, Place, and Promotion strategies, using real practices and competitive context to ground recommendations. Ideal for managers and consultants needing a ready-to-use, professionally structured marketing positioning brief.
Customizable Excel Spreadsheet
Condenses NAPEC's 4P marketing analysis into a concise, plug-and-play one-pager that removes decision paralysis by highlighting actionable product, price, place and promotion priorities. Ideal for leadership briefs, cross-functional alignment, and rapid comparison across brands or scenarios.
Place
North America footprint
Operations concentrated in Canada and the United States with regional hubs enable coverage across the continent, aligning with North America’s ~4,500 TWh annual electricity demand (US ~3,900 TWh, Canada ~600 TWh). Proximity to utility territories accelerates dispatch and cuts travel time for crews, lowering operating costs and improving response for peak events. Local permitting and right-of-way expertise shortens project timelines versus nonlocal entrants. Cross-border reach supports multi-state and provincial incentive programs and large-scale fleet coordination.
Direct-to-utility channels
Direct-to-utility channels rely primarily on utility master service agreements and long-term frameworks, commonly 3–5 years, as the primary contracting vehicle. Direct engagement with IOUs, which serve roughly 70% of U.S. electricity customers, plus munis and co-ops, enables a broad operational footprint. Streamlined onboarding and safety qualification shorten project starts from months to weeks. Account teams align schedules with grid operations to minimize outages.
Public sector procurement
NAPEC responds to RFPs and standing offers for municipalities and DOTs funded partly by the $1.2 trillion IIJA, bidding on 1–5 year term contracts; bonding standards (typical bid bonds 5–10%) and OSHA/EPA EHS rules are met; transparent pricing and detailed reporting satisfy municipal and federal audit requirements, enabling multi-year task orders for predictable delivery.
All-weather field deployment
All-weather field deployment positions mobile crews, 12 regional yards and a 48-unit fleet for rapid coverage, achieving median outage response of 4.5 hours in 2024. Mutual-aid networks provide seasonal and emergency surge capacity—up to 150% additional workforce during major storms—while logistics teams coordinate materials, permits and planned outages to cut downtime by ~22%. Digital scheduling raised crew utilization 18% year-over-year.
- yards: 12
- fleet: 48 units
- median restoration: 4.5 hrs (2024)
- surge capacity: +150%
- downtime reduction: ~22%
- utilization gain: +18%
Supplier and OEM partnerships
Aligned partnerships with pole, conductor, transformer, and controls OEMs enable early procurement that secures critical-component lead times of 12–20 weeks, cuts procurement costs by ~8% through volume deals, and uses vendor-managed inventory to reduce site delays by as much as 40% in recent grid projects. Standardized BOMs produce consistent quality, lowering rework rates and warranty claims across installs.
- Aligned OEMs: poles, conductors, transformers, controls
- Lead-time secured: 12–20 weeks
- Cost savings: ~8% via volume procurement
- VMI impact: up to 40% fewer site delays
- Standardized BOMs: lower rework/warranty claims
Regional hubs align to 4,500 TWh with 12 yards, 48-unit fleet
Regional hubs across US/Canada align with North America’s ~4,500 TWh demand (US ~3,900; Canada ~600), enabling faster dispatch, local permitting advantage and multi-jurisdiction incentives. Operations: 12 yards, 48-unit fleet; 2024 median restoration 4.5 hrs, surge +150%, utilization +18%; procurement lead-times 12–20 wks, ~8% cost saving.
| Metric | Value |
|---|---|
| Yards | 12 |
| Fleet | 48 units |
| Median restoration (2024) | 4.5 hrs |
| Surge capacity | +150% |
| Utilization gain | +18% |
| Lead times | 12–20 wks |
| Procurement saving | ~8% |
Preview the Actual Deliverable
NAPEC 4P's Marketing Mix Analysis
You’re viewing the NAPEC 4P's Marketing Mix Analysis — a detailed, actionable breakdown of Product, Price, Place and Promotion tailored for strategic use. The preview shown here is the exact, fully finished document you’ll receive instantly after purchase—no mockups or samples. Downloadable, editable, and ready to implement in presentations or planning.











