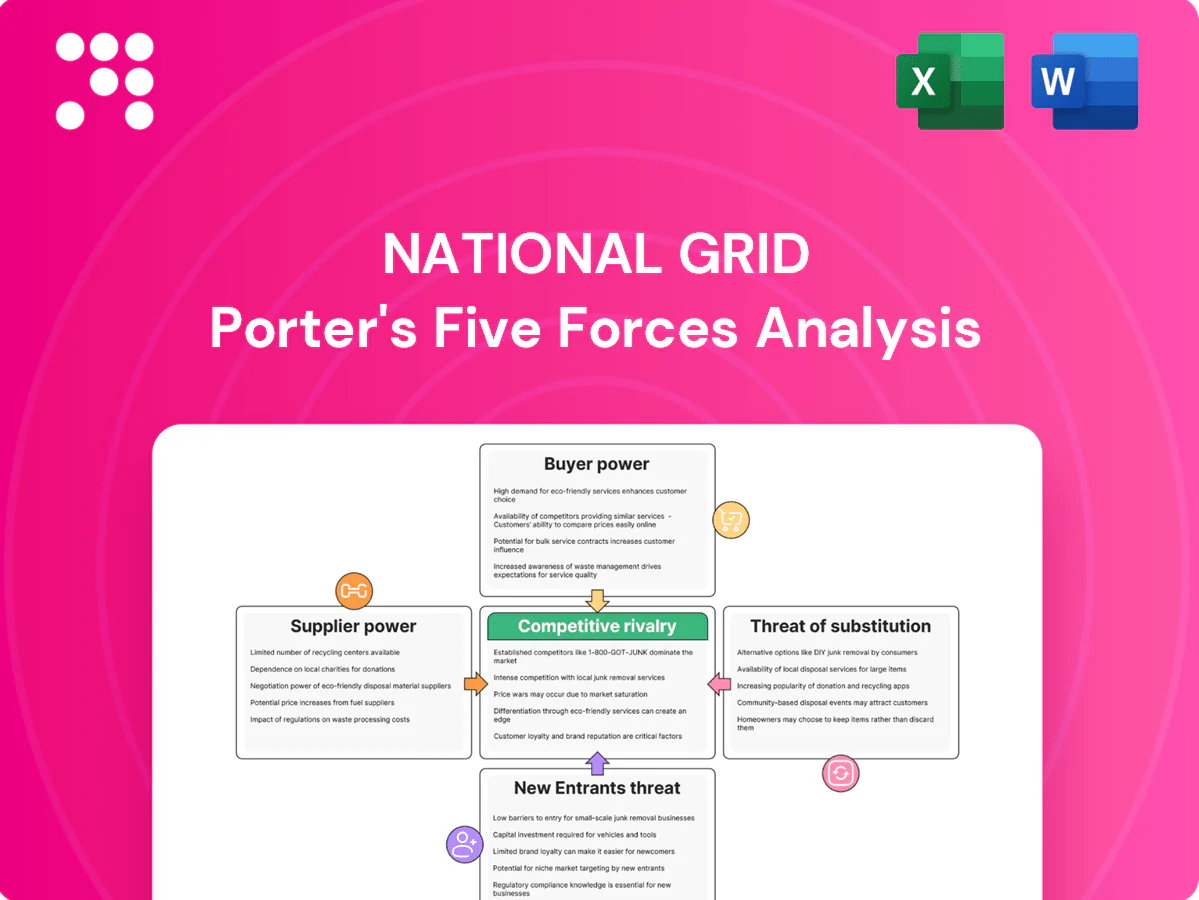
National Grid Porter's Five Forces Analysis

Don't Miss the Bigger Picture
National Grid faces strong regulatory oversight, moderate supplier power, and a steady threat from substitutes as decarbonisation reshapes demand. Buyer power is limited but large customers exert influence, while barriers to entry remain high. Strategic maneuvers hinge on grid modernization and policy navigation. Unlock the full Porter's Five Forces Analysis to explore these dynamics in depth.
Suppliers Bargaining Power

Concentrated generators and gas producers
In 2024 the five largest UK generators supplied roughly half of total generation, and interconnector capacity to continental Europe and Norway stood at about 7 GW, which can amplify supplier leverage in tight markets; Ofgem-regulated access and market codes constrain extreme price-setting, while long-term gas contracts plus National Grid ESO balancing tools (capacity market, balancing mechanism) helped mitigate short-term volatility.
Specialized grid equipment OEMs
HV transformers, high-voltage cables, GIS, protection relays and SCADA are supplied by a limited global OEM pool (ABB, Siemens Energy, Hitachi Energy, Toshiba, GE) creating high qualification barriers. Long lead times—typically 12–36 months for HV transformers and 6–18 months for GIS/cables—give suppliers negotiating leverage. Single-point failure risk and spare strategies raise dependency and inventory costs. National Grid mitigates via multi-year framework agreements to diversify sources and hedge price volatility.

EPC contractors and skilled labor
Major National Grid builds rely on scarce EPC firms and unionized specialist labour, particularly for offshore-wind links as the UK targets 50 GW by 2030. Peak program cycles in 2022–24 tightened capacity and pushed contractor bid rates up by double-digit percentages. High safety and quality standards limit substitutability of suppliers. Collaborative delivery models and early partnering have partially balanced supplier leverage.

Digital, telecom, and cybersecurity vendors
OT/IT convergence makes digital, telecom, and cybersecurity vendors critical to National Grid, driving integration into control systems and elevating supplier leverage; global cybersecurity spending exceeded $200 billion in 2024, underscoring vendor influence. Switching costs are high because solutions tie into legacy SCADA and distribution networks, and vendor roadmaps or license changes can materially shift total cost of ownership. Embracing multi-vendor architectures and open standards helps reduce lock-in and negotiate better terms.
- OT/IT convergence: vendors central to grid operations
- High switching costs: deep legacy integration
- Roadmaps/licensing: can increase TCO
- Mitigation: multi-vendor + open standards reduce lock-in
Ancillary services and flexibility providers
Storage, DER aggregators and flexible plants now supply essential balancing services to National Grid; by 2024 UK battery storage capacity exceeded 2 GW and aggregators provided over 1 GW of flexible capacity, concentrating bargaining power where local network scarcity exists. Market reforms and wider auction participation have limited scarcity rents, while improved grid visibility and real‑time telemetry have raised procurement efficiency and reduced procurement costs.
- Storage: >2 GW operational (2024)
- DER aggregators: >1 GW aggregated flexibility (2024)
- Impact: location scarcity ↑ bargaining power; auctions and visibility ↓ rents
UK power concentrated: ~50% top share, long hardware lead times
Supplier power is moderate-to-high: five largest UK generators supplied ~50% of generation in 2024 and interconnectors ~7 GW, concentrating fuel/energy suppliers. Critical grid hardware comes from few OEMs (ABB, Siemens Energy, Hitachi, Toshiba, GE) with long lead times (12–36 months) and high switching costs. Storage/DER (storage >2 GW; aggregators >1 GW in 2024) reduce but local scarcity raises leverage.
| Metric | 2024 Value |
|---|---|
| Top-5 generators share | ~50% |
| Interconnector capacity | ~7 GW |
| Battery storage | >2 GW |
| DER flexibility | >1 GW |
| HV transformer lead time | 12–36 months |
What is included in the product
 Detailed Word Document
Uncovers key drivers of competition, customer influence, and market entry risks tailored to National Grid; evaluates supplier and buyer power, threat of substitutes, rivalry intensity, and barriers protecting incumbents, highlighting disruptive threats, regulatory impacts, and strategic levers for profitability.

 Customizable Excel Spreadsheet
A concise one-sheet Porter's Five Forces for National Grid that visualizes competitive pressure, regulatory risk, and supplier bargaining to simplify strategic choices; editable radar chart and clean layout ready for decks, no macros, and easy to adapt for pre/post-regulation scenarios.
Customers Bargaining Power

Regulators as proxy buyers
By 2024 Ofgem and US state regulators set allowed revenues and explicit service targets for network operators, effectively acting as proxy buyers with major price-setting influence on behalf of customers. Incentive frameworks score performance and impose penalties for outages and inefficiency, linking cashflows to service metrics. Periodic price-control reviews reset allowed returns and scrutinize costs, enforcing discipline on capex and opex.
Captive end-users with political voice
End users are captive to local network operators yet wield political influence over policy and regulation. Affordability scrutiny is high—Ofgem’s price cap was around £1,834/year in 2024—heightening bill sensitivity. Public pressure can slow or accelerate investment pacing and demand broader cost-sharing. National Grid’s customer engagement under RIIO-2 directly shapes regulatory settlements.

Large industrial and distribution customers
Large industrial and distribution customers with direct National Grid connections negotiate bespoke terms and timetables, leveraging scale to demand prioritized works. Their exposure to curtailment and reliability—highlighted by rising flexibility needs—strengthens bargaining power. Yet standardized connection charging and a connection queue exceeding 100 GW in 2024 limit contract outcomes.

Demand-side management options
Demand-side measures—efficiency, demand response and behind-the-meter generation—are cutting grid throughput; UK rooftop solar surpassed 14 GW in 2024, and residential flexibility uptake modestly raises buyer leverage over time. Time-of-use pricing and flexibility services are shifting load profiles, flattening peaks and forcing network planning to adapt to lower peak growth.
- Efficiency reduces volume and margin pressure
- DR and flexibility increase customer negotiating power
- TOU pricing shifts load, lowering peak capacity need
- Network planning must target flatter peak and DER integration
Data transparency and benchmarking
Data transparency and benchmarking give customers and regulators real power: open datasets and comparative performance reports (published in 2024 by industry bodies and regulators) expose costs, outages and service gaps, increasing accountability for National Grid. Visible poor relative performance prompts regulatory scrutiny and can trigger interventions that limit returns. Benchmarking constrains excess returns and forces opex efficiency drives.
- 2024: public benchmarking raises accountability
- Visibility into outages/costs drives regulatory action
- Benchmarking caps excess returns and pressures opex
Regulatory price caps and rising rooftop solar squeeze grid pricing and returns
Regulators (Ofgem/US states) act as proxy buyers setting allowed revenues and incentives, strongly constraining National Grid pricing and returns. End users face captive supply but exert political pressure; Ofgem price cap ~£1,834/yr (2024) raises affordability scrutiny. Large direct-connection customers and rising DERs (UK rooftop solar ~14 GW, connection queue >100 GW in 2024) increase negotiation leverage.
| Metric | 2024 value | Impact |
|---|---|---|
| Ofgem price cap | £1,834/yr | Heightened bill sensitivity |
| Rooftop solar | 14 GW | Reduces volumes, boosts flexibility |
| Connection queue | >100 GW | Limits bespoke contracts |
Preview Before You Purchase
National Grid Porter's Five Forces Analysis
This preview shows the exact National Grid Porter's Five Forces Analysis you'll receive after purchase—no placeholders or samples. The document is fully formatted, comprehensive and ready to download instantly. Use it immediately for strategic, investment, or academic purposes.

Don't Miss the Bigger Picture
National Grid faces strong regulatory oversight, moderate supplier power, and a steady threat from substitutes as decarbonisation reshapes demand. Buyer power is limited but large customers exert influence, while barriers to entry remain high. Strategic maneuvers hinge on grid modernization and policy navigation. Unlock the full Porter's Five Forces Analysis to explore these dynamics in depth.
Suppliers Bargaining Power
Concentrated generators and gas producers
In 2024 the five largest UK generators supplied roughly half of total generation, and interconnector capacity to continental Europe and Norway stood at about 7 GW, which can amplify supplier leverage in tight markets; Ofgem-regulated access and market codes constrain extreme price-setting, while long-term gas contracts plus National Grid ESO balancing tools (capacity market, balancing mechanism) helped mitigate short-term volatility.
Specialized grid equipment OEMs
HV transformers, high-voltage cables, GIS, protection relays and SCADA are supplied by a limited global OEM pool (ABB, Siemens Energy, Hitachi Energy, Toshiba, GE) creating high qualification barriers. Long lead times—typically 12–36 months for HV transformers and 6–18 months for GIS/cables—give suppliers negotiating leverage. Single-point failure risk and spare strategies raise dependency and inventory costs. National Grid mitigates via multi-year framework agreements to diversify sources and hedge price volatility.
EPC contractors and skilled labor
Major National Grid builds rely on scarce EPC firms and unionized specialist labour, particularly for offshore-wind links as the UK targets 50 GW by 2030. Peak program cycles in 2022–24 tightened capacity and pushed contractor bid rates up by double-digit percentages. High safety and quality standards limit substitutability of suppliers. Collaborative delivery models and early partnering have partially balanced supplier leverage.
Digital, telecom, and cybersecurity vendors
OT/IT convergence makes digital, telecom, and cybersecurity vendors critical to National Grid, driving integration into control systems and elevating supplier leverage; global cybersecurity spending exceeded $200 billion in 2024, underscoring vendor influence. Switching costs are high because solutions tie into legacy SCADA and distribution networks, and vendor roadmaps or license changes can materially shift total cost of ownership. Embracing multi-vendor architectures and open standards helps reduce lock-in and negotiate better terms.
- OT/IT convergence: vendors central to grid operations
- High switching costs: deep legacy integration
- Roadmaps/licensing: can increase TCO
- Mitigation: multi-vendor + open standards reduce lock-in
Ancillary services and flexibility providers
Storage, DER aggregators and flexible plants now supply essential balancing services to National Grid; by 2024 UK battery storage capacity exceeded 2 GW and aggregators provided over 1 GW of flexible capacity, concentrating bargaining power where local network scarcity exists. Market reforms and wider auction participation have limited scarcity rents, while improved grid visibility and real‑time telemetry have raised procurement efficiency and reduced procurement costs.
- Storage: >2 GW operational (2024)
- DER aggregators: >1 GW aggregated flexibility (2024)
- Impact: location scarcity ↑ bargaining power; auctions and visibility ↓ rents
UK power concentrated: ~50% top share, long hardware lead times
Supplier power is moderate-to-high: five largest UK generators supplied ~50% of generation in 2024 and interconnectors ~7 GW, concentrating fuel/energy suppliers. Critical grid hardware comes from few OEMs (ABB, Siemens Energy, Hitachi, Toshiba, GE) with long lead times (12–36 months) and high switching costs. Storage/DER (storage >2 GW; aggregators >1 GW in 2024) reduce but local scarcity raises leverage.
| Metric | 2024 Value |
|---|---|
| Top-5 generators share | ~50% |
| Interconnector capacity | ~7 GW |
| Battery storage | >2 GW |
| DER flexibility | >1 GW |
| HV transformer lead time | 12–36 months |
What is included in the product
Detailed Word Document
Uncovers key drivers of competition, customer influence, and market entry risks tailored to National Grid; evaluates supplier and buyer power, threat of substitutes, rivalry intensity, and barriers protecting incumbents, highlighting disruptive threats, regulatory impacts, and strategic levers for profitability.
Customizable Excel Spreadsheet
A concise one-sheet Porter's Five Forces for National Grid that visualizes competitive pressure, regulatory risk, and supplier bargaining to simplify strategic choices; editable radar chart and clean layout ready for decks, no macros, and easy to adapt for pre/post-regulation scenarios.
Customers Bargaining Power
Regulators as proxy buyers
By 2024 Ofgem and US state regulators set allowed revenues and explicit service targets for network operators, effectively acting as proxy buyers with major price-setting influence on behalf of customers. Incentive frameworks score performance and impose penalties for outages and inefficiency, linking cashflows to service metrics. Periodic price-control reviews reset allowed returns and scrutinize costs, enforcing discipline on capex and opex.
Captive end-users with political voice
End users are captive to local network operators yet wield political influence over policy and regulation. Affordability scrutiny is high—Ofgem’s price cap was around £1,834/year in 2024—heightening bill sensitivity. Public pressure can slow or accelerate investment pacing and demand broader cost-sharing. National Grid’s customer engagement under RIIO-2 directly shapes regulatory settlements.
Large industrial and distribution customers
Large industrial and distribution customers with direct National Grid connections negotiate bespoke terms and timetables, leveraging scale to demand prioritized works. Their exposure to curtailment and reliability—highlighted by rising flexibility needs—strengthens bargaining power. Yet standardized connection charging and a connection queue exceeding 100 GW in 2024 limit contract outcomes.
Demand-side management options
Demand-side measures—efficiency, demand response and behind-the-meter generation—are cutting grid throughput; UK rooftop solar surpassed 14 GW in 2024, and residential flexibility uptake modestly raises buyer leverage over time. Time-of-use pricing and flexibility services are shifting load profiles, flattening peaks and forcing network planning to adapt to lower peak growth.
- Efficiency reduces volume and margin pressure
- DR and flexibility increase customer negotiating power
- TOU pricing shifts load, lowering peak capacity need
- Network planning must target flatter peak and DER integration
Data transparency and benchmarking
Data transparency and benchmarking give customers and regulators real power: open datasets and comparative performance reports (published in 2024 by industry bodies and regulators) expose costs, outages and service gaps, increasing accountability for National Grid. Visible poor relative performance prompts regulatory scrutiny and can trigger interventions that limit returns. Benchmarking constrains excess returns and forces opex efficiency drives.
- 2024: public benchmarking raises accountability
- Visibility into outages/costs drives regulatory action
- Benchmarking caps excess returns and pressures opex
Regulatory price caps and rising rooftop solar squeeze grid pricing and returns
Regulators (Ofgem/US states) act as proxy buyers setting allowed revenues and incentives, strongly constraining National Grid pricing and returns. End users face captive supply but exert political pressure; Ofgem price cap ~£1,834/yr (2024) raises affordability scrutiny. Large direct-connection customers and rising DERs (UK rooftop solar ~14 GW, connection queue >100 GW in 2024) increase negotiation leverage.
| Metric | 2024 value | Impact |
|---|---|---|
| Ofgem price cap | £1,834/yr | Heightened bill sensitivity |
| Rooftop solar | 14 GW | Reduces volumes, boosts flexibility |
| Connection queue | >100 GW | Limits bespoke contracts |
Preview Before You Purchase
National Grid Porter's Five Forces Analysis
This preview shows the exact National Grid Porter's Five Forces Analysis you'll receive after purchase—no placeholders or samples. The document is fully formatted, comprehensive and ready to download instantly. Use it immediately for strategic, investment, or academic purposes.
Original: $10.00
-65%$10.00
$3.50Description
Don't Miss the Bigger Picture
National Grid faces strong regulatory oversight, moderate supplier power, and a steady threat from substitutes as decarbonisation reshapes demand. Buyer power is limited but large customers exert influence, while barriers to entry remain high. Strategic maneuvers hinge on grid modernization and policy navigation. Unlock the full Porter's Five Forces Analysis to explore these dynamics in depth.
Suppliers Bargaining Power
Concentrated generators and gas producers
In 2024 the five largest UK generators supplied roughly half of total generation, and interconnector capacity to continental Europe and Norway stood at about 7 GW, which can amplify supplier leverage in tight markets; Ofgem-regulated access and market codes constrain extreme price-setting, while long-term gas contracts plus National Grid ESO balancing tools (capacity market, balancing mechanism) helped mitigate short-term volatility.
Specialized grid equipment OEMs
HV transformers, high-voltage cables, GIS, protection relays and SCADA are supplied by a limited global OEM pool (ABB, Siemens Energy, Hitachi Energy, Toshiba, GE) creating high qualification barriers. Long lead times—typically 12–36 months for HV transformers and 6–18 months for GIS/cables—give suppliers negotiating leverage. Single-point failure risk and spare strategies raise dependency and inventory costs. National Grid mitigates via multi-year framework agreements to diversify sources and hedge price volatility.
EPC contractors and skilled labor
Major National Grid builds rely on scarce EPC firms and unionized specialist labour, particularly for offshore-wind links as the UK targets 50 GW by 2030. Peak program cycles in 2022–24 tightened capacity and pushed contractor bid rates up by double-digit percentages. High safety and quality standards limit substitutability of suppliers. Collaborative delivery models and early partnering have partially balanced supplier leverage.
Digital, telecom, and cybersecurity vendors
OT/IT convergence makes digital, telecom, and cybersecurity vendors critical to National Grid, driving integration into control systems and elevating supplier leverage; global cybersecurity spending exceeded $200 billion in 2024, underscoring vendor influence. Switching costs are high because solutions tie into legacy SCADA and distribution networks, and vendor roadmaps or license changes can materially shift total cost of ownership. Embracing multi-vendor architectures and open standards helps reduce lock-in and negotiate better terms.
- OT/IT convergence: vendors central to grid operations
- High switching costs: deep legacy integration
- Roadmaps/licensing: can increase TCO
- Mitigation: multi-vendor + open standards reduce lock-in
Ancillary services and flexibility providers
Storage, DER aggregators and flexible plants now supply essential balancing services to National Grid; by 2024 UK battery storage capacity exceeded 2 GW and aggregators provided over 1 GW of flexible capacity, concentrating bargaining power where local network scarcity exists. Market reforms and wider auction participation have limited scarcity rents, while improved grid visibility and real‑time telemetry have raised procurement efficiency and reduced procurement costs.
- Storage: >2 GW operational (2024)
- DER aggregators: >1 GW aggregated flexibility (2024)
- Impact: location scarcity ↑ bargaining power; auctions and visibility ↓ rents
UK power concentrated: ~50% top share, long hardware lead times
Supplier power is moderate-to-high: five largest UK generators supplied ~50% of generation in 2024 and interconnectors ~7 GW, concentrating fuel/energy suppliers. Critical grid hardware comes from few OEMs (ABB, Siemens Energy, Hitachi, Toshiba, GE) with long lead times (12–36 months) and high switching costs. Storage/DER (storage >2 GW; aggregators >1 GW in 2024) reduce but local scarcity raises leverage.
| Metric | 2024 Value |
|---|---|
| Top-5 generators share | ~50% |
| Interconnector capacity | ~7 GW |
| Battery storage | >2 GW |
| DER flexibility | >1 GW |
| HV transformer lead time | 12–36 months |
What is included in the product
Detailed Word Document
Uncovers key drivers of competition, customer influence, and market entry risks tailored to National Grid; evaluates supplier and buyer power, threat of substitutes, rivalry intensity, and barriers protecting incumbents, highlighting disruptive threats, regulatory impacts, and strategic levers for profitability.
Customizable Excel Spreadsheet
A concise one-sheet Porter's Five Forces for National Grid that visualizes competitive pressure, regulatory risk, and supplier bargaining to simplify strategic choices; editable radar chart and clean layout ready for decks, no macros, and easy to adapt for pre/post-regulation scenarios.
Customers Bargaining Power
Regulators as proxy buyers
By 2024 Ofgem and US state regulators set allowed revenues and explicit service targets for network operators, effectively acting as proxy buyers with major price-setting influence on behalf of customers. Incentive frameworks score performance and impose penalties for outages and inefficiency, linking cashflows to service metrics. Periodic price-control reviews reset allowed returns and scrutinize costs, enforcing discipline on capex and opex.
Captive end-users with political voice
End users are captive to local network operators yet wield political influence over policy and regulation. Affordability scrutiny is high—Ofgem’s price cap was around £1,834/year in 2024—heightening bill sensitivity. Public pressure can slow or accelerate investment pacing and demand broader cost-sharing. National Grid’s customer engagement under RIIO-2 directly shapes regulatory settlements.
Large industrial and distribution customers
Large industrial and distribution customers with direct National Grid connections negotiate bespoke terms and timetables, leveraging scale to demand prioritized works. Their exposure to curtailment and reliability—highlighted by rising flexibility needs—strengthens bargaining power. Yet standardized connection charging and a connection queue exceeding 100 GW in 2024 limit contract outcomes.
Demand-side management options
Demand-side measures—efficiency, demand response and behind-the-meter generation—are cutting grid throughput; UK rooftop solar surpassed 14 GW in 2024, and residential flexibility uptake modestly raises buyer leverage over time. Time-of-use pricing and flexibility services are shifting load profiles, flattening peaks and forcing network planning to adapt to lower peak growth.
- Efficiency reduces volume and margin pressure
- DR and flexibility increase customer negotiating power
- TOU pricing shifts load, lowering peak capacity need
- Network planning must target flatter peak and DER integration
Data transparency and benchmarking
Data transparency and benchmarking give customers and regulators real power: open datasets and comparative performance reports (published in 2024 by industry bodies and regulators) expose costs, outages and service gaps, increasing accountability for National Grid. Visible poor relative performance prompts regulatory scrutiny and can trigger interventions that limit returns. Benchmarking constrains excess returns and forces opex efficiency drives.
- 2024: public benchmarking raises accountability
- Visibility into outages/costs drives regulatory action
- Benchmarking caps excess returns and pressures opex
Regulatory price caps and rising rooftop solar squeeze grid pricing and returns
Regulators (Ofgem/US states) act as proxy buyers setting allowed revenues and incentives, strongly constraining National Grid pricing and returns. End users face captive supply but exert political pressure; Ofgem price cap ~£1,834/yr (2024) raises affordability scrutiny. Large direct-connection customers and rising DERs (UK rooftop solar ~14 GW, connection queue >100 GW in 2024) increase negotiation leverage.
| Metric | 2024 value | Impact |
|---|---|---|
| Ofgem price cap | £1,834/yr | Heightened bill sensitivity |
| Rooftop solar | 14 GW | Reduces volumes, boosts flexibility |
| Connection queue | >100 GW | Limits bespoke contracts |
Preview Before You Purchase
National Grid Porter's Five Forces Analysis
This preview shows the exact National Grid Porter's Five Forces Analysis you'll receive after purchase—no placeholders or samples. The document is fully formatted, comprehensive and ready to download instantly. Use it immediately for strategic, investment, or academic purposes.











