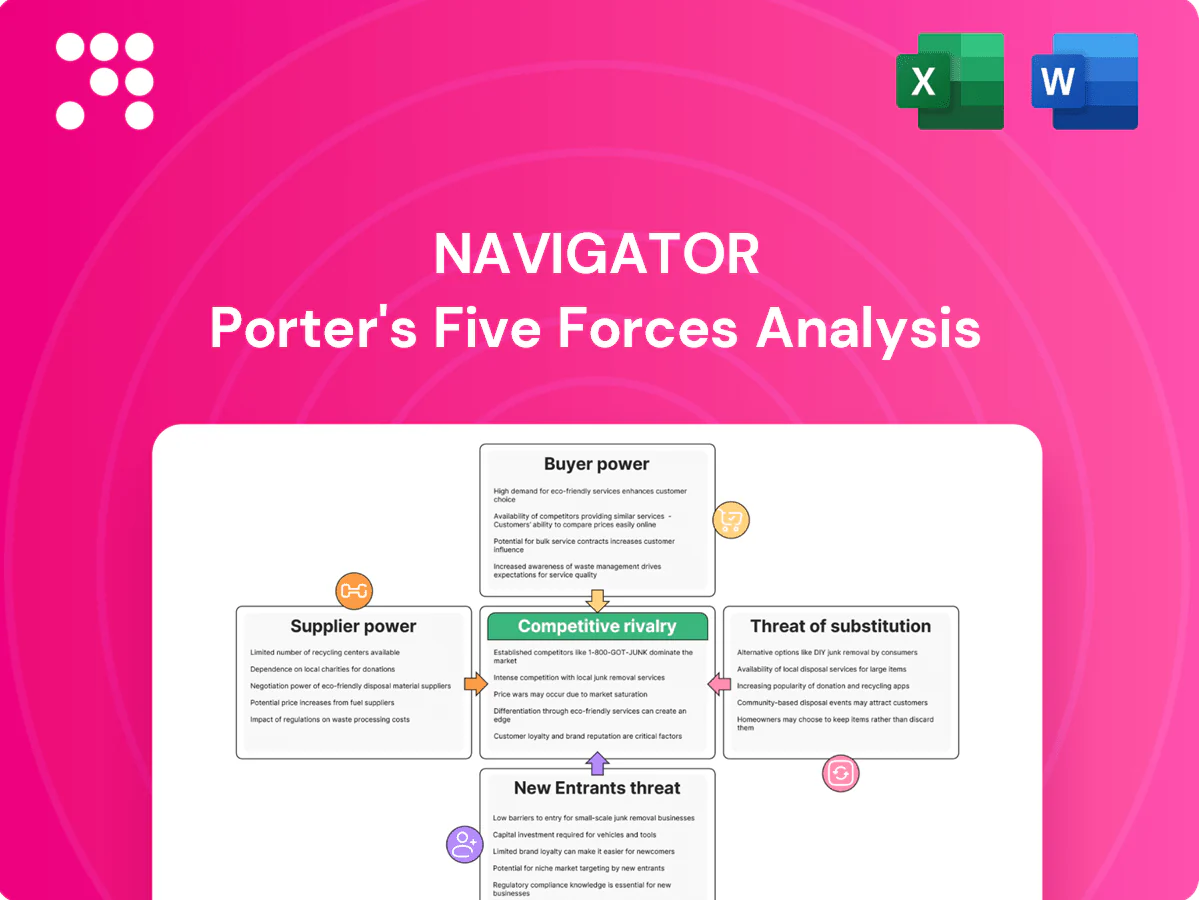
Navigator Porter's Five Forces Analysis

A Must-Have Tool for Decision-Makers
Navigator’s Porter’s Five Forces snapshot highlights competitive threats, supplier and buyer leverage, substitute risks, and entry barriers. This brief overview surfaces key pressures shaping Navigator’s market position. The full Porter's Five Forces Analysis reveals force-by-force ratings, visuals, and actionable implications. Unlock the complete report to inform investment or strategy.
Suppliers Bargaining Power

Scarce top-tier investment talent
Experienced portfolio managers, analysts and quants remain scarce and highly mobile, driving up wage costs and carry demands—star managers commonly negotiate 20% carry or favorable seed economics in 2024. Firms increasingly deploy retention packages, equity, and culture programs to curb attrition. Losing key talent causes measurable performance variability and can trigger significant asset outflows.
Dependence on data, tech, and analytics
Dependence on premium data feeds, execution systems and risk platforms concentrates power with major vendors like Bloomberg, FactSet and Refinitiv; Bloomberg terminals cost about $2,000/month in 2024, illustrating vendor pricing power. Switching is costly due to model revalidation and workflow rewiring, creating high lock-in. Vendors can push price increases or bundle upsells; long-term contracts and multi-vendor redundancy reduce exposure.

Prime brokerage, custody, and financing
Leverage, securities lending and trade financing depend on a small set of major primes and custodians—top five custodians held roughly 70% of global assets under custody of about $135 trillion in 2024—so terms can tighten in volatile markets, constraining capacity and returns. Concentration raises counterparty and pricing-power risks, and spikes in haircuts or recall risk can force deleveraging. Diversifying primes and optimizing collateral and rehypothecation reduces suppliers’ bargaining leverage and stabilizes execution and funding costs.

Deal flow and GP partnerships
Deal flow and GP partnerships determine access to private equity and private credit, with relationships to sponsors, bankers and owners driving 2024 allocations; Preqin reported private capital dry powder at about $2.2 trillion in 2024, intensifying competitive auctions and fee pressure. Established networks capture co-invests and favored auction slots, while proprietary sourcing lowers supplier leverage but requires high fixed costs. Co-GP and club structures help rebalance negotiating power by pooling capital and governance.
- Supplier influence: favored sponsors win larger fee/term concessions
- Dry powder (2024): ~ $2.2 trillion (Preqin)
- Proprietary sourcing: high build cost, lowers dependence
- Co-GP/club: distributes negotiation leverage and risk
Specialist legal, admin, and compliance vendors
Regulatory complexity in 2024 drives heavy reliance on specialist legal, tax, and fund administration vendors, with the global fund administration market estimated at roughly $6.4 billion in 2024 and compliance spend rising year-on-year. For niche jurisdictions or complex products, qualified providers often number very few, creating price and timeline leverage. Multi-jurisdiction operations amplify dependency and operational risk. Building internal capability and dual-sourcing materially reduces supplier power.
- Regulatory complexity: 2024 compliance spend up
- Niche providers: limited supplier pool
- Multi-jurisdiction: higher reliance
- Mitigation: internal capability, dual-sourcing
Supplier power: 20% carry, data fees, $2.2T dry powder
Supplier power in asset management in 2024 is driven by scarce star talent (20% carry typical), dominant data vendors (Bloomberg ~ $2,000/month), custody concentration (top 5 hold ~70% of $135T AUC) and private capital sellers (Preqin dry powder ~ $2.2T), plus specialized fund admin (~$6.4B market). Firms mitigate via retention, multi-vendor, diversified primes, proprietary sourcing and internal compliance.
| Supplier | 2024 metric | Impact |
|---|---|---|
| Talent | 20% carry | High wage/exit risk |
| Data vendors | Bloomberg ~$2,000/mo | High switching cost |
| Custodians | Top5 ~70% of $135T | Counterparty/concentration |
| Private capital | Dry powder ~$2.2T | Competitive auctions |
| Fund admin | Market ~$6.4B | Specialist pricing power |
What is included in the product
 Detailed Word Document
Comprehensive Porter's Five Forces assessment tailored to Navigator, revealing competitive intensity, buyer and supplier power, barriers to entry, substitutes, and emerging threats to market share.

 Customizable Excel Spreadsheet
A single-sheet Navigator Porter's Five Forces that turns competitive complexity into actionable strategy—customize pressure levels, swap in your data, and export clean radar charts and slide-ready layouts for fast, boardroom-ready decisions.
Customers Bargaining Power

Institutional allocators negotiate hard
Pensions, endowments and sovereigns routinely commit large tickets—often exceeding $100m—securing fee breaks and MFN clauses; in 2024 many large public plans continued to demand bespoke fee terms. They dictate liquidity, reporting and co-invest access, while consultant gatekeepers, who influence roughly 70% of institutional allocations, amplify bargaining power. Concentrated client bases raise repricing risk at renewal.
Performance transparency and benchmarking
Investors benchmark net returns vs peers and indices—by 2024 passive funds held over 50% of US equity AUM—creating relentless pressure on alpha and fees, with underperformance prompting reallocations often within 12 months. Detailed look-through reporting in 2024 enabled sharper cost scrutiny, and a fee-for-alpha mindset has compressed management fees (≈15% decline 2020–2024) and accelerated performance-aligned fee structures.

Switching is feasible across managers
LPs can reallocate across managers and strategies with moderate friction, as secondary market volumes surpassed $100bn in 2023–24, improving liquidity and portability of exposure via managed accounts. RFP-driven selection standardizes comparisons and shortens decision cycles. Strong client servicing and bespoke mandates, however, raise effective switching costs and reduce churn.

Demand for customization and co-invest
Large LPs increasingly demand SMAs, ESG integration and co-investments with reduced or no management fees, shifting economics and operational burdens onto managers; winning mandates now often requires bespoke structures and reporting. Scalability and platform breadth protect margins by spreading fixed costs, and co-invests in 2024 commonly carry 0–0.5% management fees with carried interest only.
- SMAs
- ESG
- Co-invest 0–0.5% fees
- Scalability
HNW and wealth platforms aggregate power
Product shelf inclusion hinges on track record, brand and due diligence; fee-sharing and distribution economics compress take-rates to roughly 30–50 bps in competitive markets.
High-quality education and differentiated solutions permit premium pricing and higher retention.
- Gatekeeping power: private banks negotiate access
- Inclusion criteria: performance, brand, due diligence
- Fee pressure: take-rates ~30–50 bps
- Pricing defense: education and differentiation
Consultants & LPs drive fees; passive > 50%; fees −15%
Large institutional LPs (many mandates >100m) plus consultants (≈70% influence) dictate fees, liquidity and co‑invest access; passive >50% of US equity AUM (2024) intensifies fee pressure. Management fees fell ≈15% (2020–2024); secondary turnover >$100bn (2023–24) lowers switching costs; co‑invests commonly 0–0.5% and retail take‑rates ≈30–50 bps.
| Metric | 2024 |
|---|---|
| Consultant influence | ≈70% |
| Passive US equity AUM | >50% |
| Mgmt fee change | −15% (2020–24) |
| Secondary volume | >$100bn |
Preview Before You Purchase
Navigator Porter's Five Forces Analysis
This preview shows the exact Navigator Porter's Five Forces Analysis you'll receive immediately after purchase—no placeholders or samples. The document is fully formatted, professional, and ready for download and use the moment you buy. You're viewing the final deliverable, identical to the file you'll get.

A Must-Have Tool for Decision-Makers
Navigator’s Porter’s Five Forces snapshot highlights competitive threats, supplier and buyer leverage, substitute risks, and entry barriers. This brief overview surfaces key pressures shaping Navigator’s market position. The full Porter's Five Forces Analysis reveals force-by-force ratings, visuals, and actionable implications. Unlock the complete report to inform investment or strategy.
Suppliers Bargaining Power
Scarce top-tier investment talent
Experienced portfolio managers, analysts and quants remain scarce and highly mobile, driving up wage costs and carry demands—star managers commonly negotiate 20% carry or favorable seed economics in 2024. Firms increasingly deploy retention packages, equity, and culture programs to curb attrition. Losing key talent causes measurable performance variability and can trigger significant asset outflows.
Dependence on data, tech, and analytics
Dependence on premium data feeds, execution systems and risk platforms concentrates power with major vendors like Bloomberg, FactSet and Refinitiv; Bloomberg terminals cost about $2,000/month in 2024, illustrating vendor pricing power. Switching is costly due to model revalidation and workflow rewiring, creating high lock-in. Vendors can push price increases or bundle upsells; long-term contracts and multi-vendor redundancy reduce exposure.
Prime brokerage, custody, and financing
Leverage, securities lending and trade financing depend on a small set of major primes and custodians—top five custodians held roughly 70% of global assets under custody of about $135 trillion in 2024—so terms can tighten in volatile markets, constraining capacity and returns. Concentration raises counterparty and pricing-power risks, and spikes in haircuts or recall risk can force deleveraging. Diversifying primes and optimizing collateral and rehypothecation reduces suppliers’ bargaining leverage and stabilizes execution and funding costs.
Deal flow and GP partnerships
Deal flow and GP partnerships determine access to private equity and private credit, with relationships to sponsors, bankers and owners driving 2024 allocations; Preqin reported private capital dry powder at about $2.2 trillion in 2024, intensifying competitive auctions and fee pressure. Established networks capture co-invests and favored auction slots, while proprietary sourcing lowers supplier leverage but requires high fixed costs. Co-GP and club structures help rebalance negotiating power by pooling capital and governance.
- Supplier influence: favored sponsors win larger fee/term concessions
- Dry powder (2024): ~ $2.2 trillion (Preqin)
- Proprietary sourcing: high build cost, lowers dependence
- Co-GP/club: distributes negotiation leverage and risk
Specialist legal, admin, and compliance vendors
Regulatory complexity in 2024 drives heavy reliance on specialist legal, tax, and fund administration vendors, with the global fund administration market estimated at roughly $6.4 billion in 2024 and compliance spend rising year-on-year. For niche jurisdictions or complex products, qualified providers often number very few, creating price and timeline leverage. Multi-jurisdiction operations amplify dependency and operational risk. Building internal capability and dual-sourcing materially reduces supplier power.
- Regulatory complexity: 2024 compliance spend up
- Niche providers: limited supplier pool
- Multi-jurisdiction: higher reliance
- Mitigation: internal capability, dual-sourcing
Supplier power: 20% carry, data fees, $2.2T dry powder
Supplier power in asset management in 2024 is driven by scarce star talent (20% carry typical), dominant data vendors (Bloomberg ~ $2,000/month), custody concentration (top 5 hold ~70% of $135T AUC) and private capital sellers (Preqin dry powder ~ $2.2T), plus specialized fund admin (~$6.4B market). Firms mitigate via retention, multi-vendor, diversified primes, proprietary sourcing and internal compliance.
| Supplier | 2024 metric | Impact |
|---|---|---|
| Talent | 20% carry | High wage/exit risk |
| Data vendors | Bloomberg ~$2,000/mo | High switching cost |
| Custodians | Top5 ~70% of $135T | Counterparty/concentration |
| Private capital | Dry powder ~$2.2T | Competitive auctions |
| Fund admin | Market ~$6.4B | Specialist pricing power |
What is included in the product
Detailed Word Document
Comprehensive Porter's Five Forces assessment tailored to Navigator, revealing competitive intensity, buyer and supplier power, barriers to entry, substitutes, and emerging threats to market share.
Customizable Excel Spreadsheet
A single-sheet Navigator Porter's Five Forces that turns competitive complexity into actionable strategy—customize pressure levels, swap in your data, and export clean radar charts and slide-ready layouts for fast, boardroom-ready decisions.
Customers Bargaining Power
Institutional allocators negotiate hard
Pensions, endowments and sovereigns routinely commit large tickets—often exceeding $100m—securing fee breaks and MFN clauses; in 2024 many large public plans continued to demand bespoke fee terms. They dictate liquidity, reporting and co-invest access, while consultant gatekeepers, who influence roughly 70% of institutional allocations, amplify bargaining power. Concentrated client bases raise repricing risk at renewal.
Performance transparency and benchmarking
Investors benchmark net returns vs peers and indices—by 2024 passive funds held over 50% of US equity AUM—creating relentless pressure on alpha and fees, with underperformance prompting reallocations often within 12 months. Detailed look-through reporting in 2024 enabled sharper cost scrutiny, and a fee-for-alpha mindset has compressed management fees (≈15% decline 2020–2024) and accelerated performance-aligned fee structures.
Switching is feasible across managers
LPs can reallocate across managers and strategies with moderate friction, as secondary market volumes surpassed $100bn in 2023–24, improving liquidity and portability of exposure via managed accounts. RFP-driven selection standardizes comparisons and shortens decision cycles. Strong client servicing and bespoke mandates, however, raise effective switching costs and reduce churn.
Demand for customization and co-invest
Large LPs increasingly demand SMAs, ESG integration and co-investments with reduced or no management fees, shifting economics and operational burdens onto managers; winning mandates now often requires bespoke structures and reporting. Scalability and platform breadth protect margins by spreading fixed costs, and co-invests in 2024 commonly carry 0–0.5% management fees with carried interest only.
- SMAs
- ESG
- Co-invest 0–0.5% fees
- Scalability
HNW and wealth platforms aggregate power
Product shelf inclusion hinges on track record, brand and due diligence; fee-sharing and distribution economics compress take-rates to roughly 30–50 bps in competitive markets.
High-quality education and differentiated solutions permit premium pricing and higher retention.
- Gatekeeping power: private banks negotiate access
- Inclusion criteria: performance, brand, due diligence
- Fee pressure: take-rates ~30–50 bps
- Pricing defense: education and differentiation
Consultants & LPs drive fees; passive > 50%; fees −15%
Large institutional LPs (many mandates >100m) plus consultants (≈70% influence) dictate fees, liquidity and co‑invest access; passive >50% of US equity AUM (2024) intensifies fee pressure. Management fees fell ≈15% (2020–2024); secondary turnover >$100bn (2023–24) lowers switching costs; co‑invests commonly 0–0.5% and retail take‑rates ≈30–50 bps.
| Metric | 2024 |
|---|---|
| Consultant influence | ≈70% |
| Passive US equity AUM | >50% |
| Mgmt fee change | −15% (2020–24) |
| Secondary volume | >$100bn |
Preview Before You Purchase
Navigator Porter's Five Forces Analysis
This preview shows the exact Navigator Porter's Five Forces Analysis you'll receive immediately after purchase—no placeholders or samples. The document is fully formatted, professional, and ready for download and use the moment you buy. You're viewing the final deliverable, identical to the file you'll get.
Description
A Must-Have Tool for Decision-Makers
Navigator’s Porter’s Five Forces snapshot highlights competitive threats, supplier and buyer leverage, substitute risks, and entry barriers. This brief overview surfaces key pressures shaping Navigator’s market position. The full Porter's Five Forces Analysis reveals force-by-force ratings, visuals, and actionable implications. Unlock the complete report to inform investment or strategy.
Suppliers Bargaining Power
Scarce top-tier investment talent
Experienced portfolio managers, analysts and quants remain scarce and highly mobile, driving up wage costs and carry demands—star managers commonly negotiate 20% carry or favorable seed economics in 2024. Firms increasingly deploy retention packages, equity, and culture programs to curb attrition. Losing key talent causes measurable performance variability and can trigger significant asset outflows.
Dependence on data, tech, and analytics
Dependence on premium data feeds, execution systems and risk platforms concentrates power with major vendors like Bloomberg, FactSet and Refinitiv; Bloomberg terminals cost about $2,000/month in 2024, illustrating vendor pricing power. Switching is costly due to model revalidation and workflow rewiring, creating high lock-in. Vendors can push price increases or bundle upsells; long-term contracts and multi-vendor redundancy reduce exposure.
Prime brokerage, custody, and financing
Leverage, securities lending and trade financing depend on a small set of major primes and custodians—top five custodians held roughly 70% of global assets under custody of about $135 trillion in 2024—so terms can tighten in volatile markets, constraining capacity and returns. Concentration raises counterparty and pricing-power risks, and spikes in haircuts or recall risk can force deleveraging. Diversifying primes and optimizing collateral and rehypothecation reduces suppliers’ bargaining leverage and stabilizes execution and funding costs.
Deal flow and GP partnerships
Deal flow and GP partnerships determine access to private equity and private credit, with relationships to sponsors, bankers and owners driving 2024 allocations; Preqin reported private capital dry powder at about $2.2 trillion in 2024, intensifying competitive auctions and fee pressure. Established networks capture co-invests and favored auction slots, while proprietary sourcing lowers supplier leverage but requires high fixed costs. Co-GP and club structures help rebalance negotiating power by pooling capital and governance.
- Supplier influence: favored sponsors win larger fee/term concessions
- Dry powder (2024): ~ $2.2 trillion (Preqin)
- Proprietary sourcing: high build cost, lowers dependence
- Co-GP/club: distributes negotiation leverage and risk
Specialist legal, admin, and compliance vendors
Regulatory complexity in 2024 drives heavy reliance on specialist legal, tax, and fund administration vendors, with the global fund administration market estimated at roughly $6.4 billion in 2024 and compliance spend rising year-on-year. For niche jurisdictions or complex products, qualified providers often number very few, creating price and timeline leverage. Multi-jurisdiction operations amplify dependency and operational risk. Building internal capability and dual-sourcing materially reduces supplier power.
- Regulatory complexity: 2024 compliance spend up
- Niche providers: limited supplier pool
- Multi-jurisdiction: higher reliance
- Mitigation: internal capability, dual-sourcing
Supplier power: 20% carry, data fees, $2.2T dry powder
Supplier power in asset management in 2024 is driven by scarce star talent (20% carry typical), dominant data vendors (Bloomberg ~ $2,000/month), custody concentration (top 5 hold ~70% of $135T AUC) and private capital sellers (Preqin dry powder ~ $2.2T), plus specialized fund admin (~$6.4B market). Firms mitigate via retention, multi-vendor, diversified primes, proprietary sourcing and internal compliance.
| Supplier | 2024 metric | Impact |
|---|---|---|
| Talent | 20% carry | High wage/exit risk |
| Data vendors | Bloomberg ~$2,000/mo | High switching cost |
| Custodians | Top5 ~70% of $135T | Counterparty/concentration |
| Private capital | Dry powder ~$2.2T | Competitive auctions |
| Fund admin | Market ~$6.4B | Specialist pricing power |
What is included in the product
Detailed Word Document
Comprehensive Porter's Five Forces assessment tailored to Navigator, revealing competitive intensity, buyer and supplier power, barriers to entry, substitutes, and emerging threats to market share.
Customizable Excel Spreadsheet
A single-sheet Navigator Porter's Five Forces that turns competitive complexity into actionable strategy—customize pressure levels, swap in your data, and export clean radar charts and slide-ready layouts for fast, boardroom-ready decisions.
Customers Bargaining Power
Institutional allocators negotiate hard
Pensions, endowments and sovereigns routinely commit large tickets—often exceeding $100m—securing fee breaks and MFN clauses; in 2024 many large public plans continued to demand bespoke fee terms. They dictate liquidity, reporting and co-invest access, while consultant gatekeepers, who influence roughly 70% of institutional allocations, amplify bargaining power. Concentrated client bases raise repricing risk at renewal.
Performance transparency and benchmarking
Investors benchmark net returns vs peers and indices—by 2024 passive funds held over 50% of US equity AUM—creating relentless pressure on alpha and fees, with underperformance prompting reallocations often within 12 months. Detailed look-through reporting in 2024 enabled sharper cost scrutiny, and a fee-for-alpha mindset has compressed management fees (≈15% decline 2020–2024) and accelerated performance-aligned fee structures.
Switching is feasible across managers
LPs can reallocate across managers and strategies with moderate friction, as secondary market volumes surpassed $100bn in 2023–24, improving liquidity and portability of exposure via managed accounts. RFP-driven selection standardizes comparisons and shortens decision cycles. Strong client servicing and bespoke mandates, however, raise effective switching costs and reduce churn.
Demand for customization and co-invest
Large LPs increasingly demand SMAs, ESG integration and co-investments with reduced or no management fees, shifting economics and operational burdens onto managers; winning mandates now often requires bespoke structures and reporting. Scalability and platform breadth protect margins by spreading fixed costs, and co-invests in 2024 commonly carry 0–0.5% management fees with carried interest only.
- SMAs
- ESG
- Co-invest 0–0.5% fees
- Scalability
HNW and wealth platforms aggregate power
Product shelf inclusion hinges on track record, brand and due diligence; fee-sharing and distribution economics compress take-rates to roughly 30–50 bps in competitive markets.
High-quality education and differentiated solutions permit premium pricing and higher retention.
- Gatekeeping power: private banks negotiate access
- Inclusion criteria: performance, brand, due diligence
- Fee pressure: take-rates ~30–50 bps
- Pricing defense: education and differentiation
Consultants & LPs drive fees; passive > 50%; fees −15%
Large institutional LPs (many mandates >100m) plus consultants (≈70% influence) dictate fees, liquidity and co‑invest access; passive >50% of US equity AUM (2024) intensifies fee pressure. Management fees fell ≈15% (2020–2024); secondary turnover >$100bn (2023–24) lowers switching costs; co‑invests commonly 0–0.5% and retail take‑rates ≈30–50 bps.
| Metric | 2024 |
|---|---|
| Consultant influence | ≈70% |
| Passive US equity AUM | >50% |
| Mgmt fee change | −15% (2020–24) |
| Secondary volume | >$100bn |
Preview Before You Purchase
Navigator Porter's Five Forces Analysis
This preview shows the exact Navigator Porter's Five Forces Analysis you'll receive immediately after purchase—no placeholders or samples. The document is fully formatted, professional, and ready for download and use the moment you buy. You're viewing the final deliverable, identical to the file you'll get.











