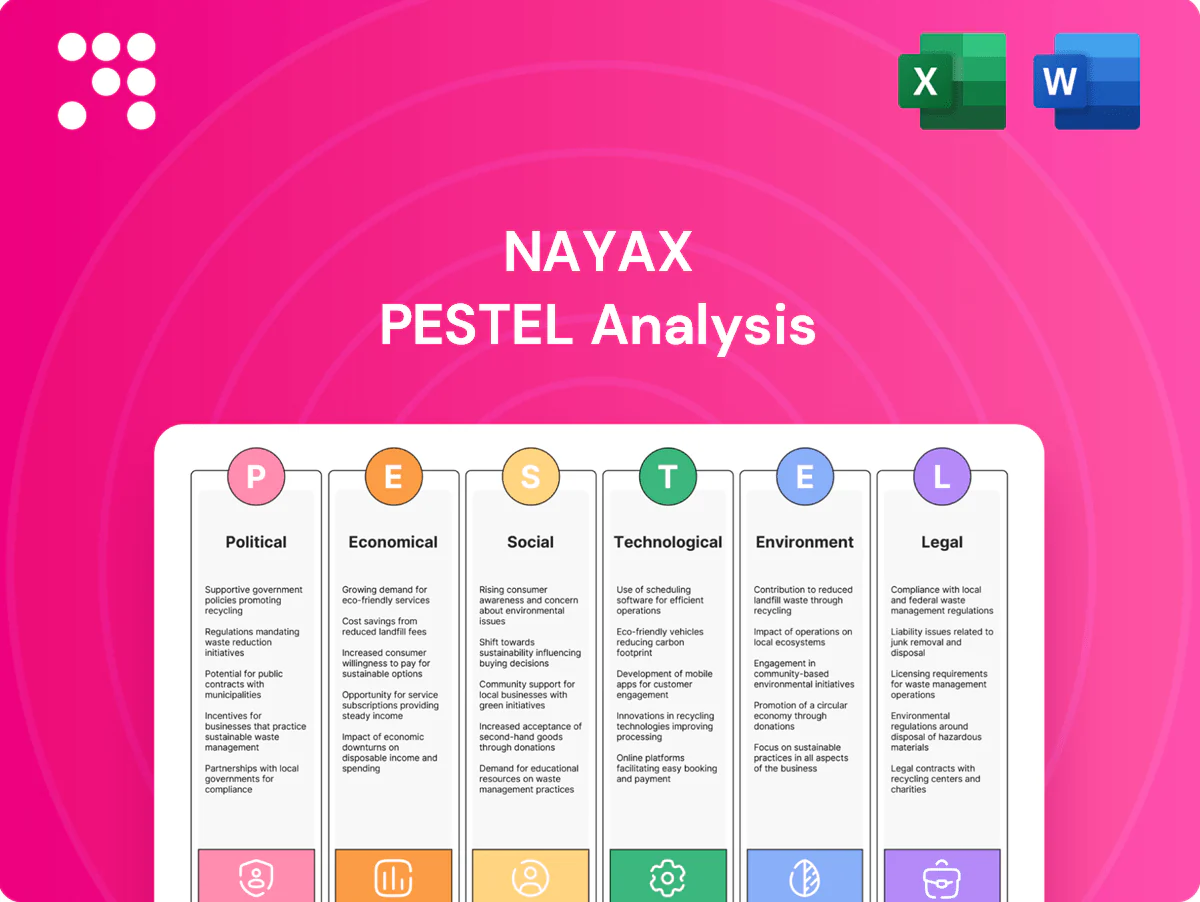
Nayax PESTLE Analysis

Your Competitive Advantage Starts with This Report
Gain a competitive edge with our PESTLE Analysis of Nayax. It reveals political, economic, social, technological, legal and environmental factors shaping growth and risk. Ready-made and actionable for investors and strategists. Purchase the full report for the complete, editable deep-dive.
Political factors

Payments regulation and supervision
Central banks and finance ministries set rules for cashless payments, notably the EU interchange caps of 0.2% for debit and 0.3% for credit cards, which directly influence processing economics. Shifts in policy on fees or settlement timing can compress unit economics for transaction processors. Nayax must adapt pricing and compliance to maintain margins. Active engagement with regulators reduces surprise risk.
Public digitalization agendas
Government-backed cashless initiatives accelerate adoption in transit, public venues and utilities, with over 100 countries now pursuing national digital payment strategies (IMF/World Bank reporting). Subsidies or mandated standards can open unattended categories like kiosks and EV charging. Conversely, stalled programs materially slow rollouts and revenue. Aligning Nayax products with national standards shortens certification timelines and market entry.

Trade policy and cross-border operations
Tariffs, sanctions and import rules can materially raise Nayax hardware costs and restrict market access, especially for card readers and POS terminals in regions with elevated duties. Nayax, listed on Nasdaq (ticker NYAX) and operating in 60+ countries, requires flexible sourcing and multiple certifications (EMV, PCI) to maintain cross-border operations. Political instability can disrupt local distributors and service partners, increasing working capital needs. Geographic diversification across 60+ markets helps hedge localized policy shocks.

Infrastructure and smart city investment
Public funding expands addressable endpoints: US IIJA allocates about 7.5 billion USD for EV charging and EU AFIR (adopted 2023) sets TEN-T charging targets, accelerating kiosks and urban IoT deployments.
Procurement rules increasingly favour compliant, cybersecurity-certified vendors, raising entry barriers for non-compliant suppliers.
Political cycles can delay tenders or shift budgets; building references through pilot programs improves procurement scoring and contract win rates.
- Public funding: IIJA 7.5B USD; EU AFIR targets
- Procurement: compliance + security required
- Risk: political delays, budget re-prioritization
- Advantage: pilots raise win probability
Data sovereignty priorities
Governments increasingly demand local data residency and oversight for payments and telemetry, with 65+ countries adopting localization measures as of 2024 and the EU's GDPR still governing cross‑border flows across 27 member states. Localization raises deployment cost and complexity but is often a prerequisite for market entry and licensure in high‑value markets. Clear data governance and certified local controls build regulator trust, while modular cloud architectures enable region‑specific isolation and faster compliance.
- 65+ countries (2024) — rising localization mandates
- 27 EU states — GDPR cross‑border constraints
- Localization increases implementation cost and time
- Modular cloud = region isolation, easier audits
Interchange caps squeeze margins; IIJA/AFIR and localization drive EV charging and payments
Regulatory caps and settlement rules (EU 0.2%/0.3%) directly compress payment margins and require pricing adjustments. National cashless programs and US IIJA/EU AFIR funding accelerate terminals and EV charging uptake. Localization (65+ countries, 2024) and procurement/security mandates raise entry costs but favor compliant vendors.
| Metric | Value |
|---|---|
| Interchange caps (EU) | 0.2% debit / 0.3% credit |
| Markets | 60+ countries |
| Localization mandates | 65+ countries (2024) |
| Public funding | IIJA ~7.5B USD; AFIR targets (2023) |
What is included in the product
 Detailed Word Document
Explores how macro-environmental factors uniquely affect Nayax across Political, Economic, Social, Technological, Environmental and Legal dimensions, with data-driven trends and region-specific regulatory context. Designed for executives and investors, the analysis offers forward-looking insights, actionable opportunities and risks, and clean formatting ready for reports or pitch decks.

 Customizable Excel Spreadsheet
A concise, visually segmented PESTLE summary for Nayax that highlights external risks and opportunities, ideal for drop-in slides or quick team alignment. Allows easy annotation for region-specific impacts and seamless sharing across teams.
Economic factors

Consumer spending and foot traffic
Macroeconomic cycles drive vending and laundromat revenue volatility, with higher inflation and slower growth in 2023–24 squeezing discretionary spend and reducing impulse purchases that power snack and beverage sales.
Essential services such as laundromats and unattended payment for utilities showed relative resilience versus snacks during downturns, supporting steadier transaction volumes.
Active portfolio mix management—shifting toward payment-enabled essentials and payment-as-a-service accounts—smooths cash flows for Nayax across its 65+ market footprint.
Interest rates and capital costs
Higher rates raise hardware financing and operator lease costs; the US federal funds rate was 5.25–5.50% in mid-2025 and the prime rate near 8.5%, lifting borrowing costs for Nayax customers. Payback periods for retrofits lengthen, dampening adoption as capex hurdles grow. Strong ROI analytics can sustain sales despite rate pressure, and flexible pricing and bundles mitigate upfront capex barriers.

FX exposure and global pricing
Multi-currency revenues and costs expose Nayax to translation and transaction risk amid a global FX market with average daily turnover of about 7.5 trillion USD (BIS, 2022); currency swings also shift device ASPs and processor fees, which commonly range 1–3% of transaction value. Nayax uses forward/option hedging to protect gross margins and implements localized pricing to preserve competitiveness across markets.

Card scheme and processor fees
Network fee increases directly compress Nayax take-rates; the global average merchant discount rate is about 1.5% and a 20–50 bps swing can materially reduce platform margins. Blended MDR and interchange shifts change operator economics and passing fees to merchants risks churn in price-sensitive vending and unattended retail. Negotiating volume tiers and routing optimizations protects margin.
- tag:avg_MDR≈1.5%
- tag:bps_impact=20–50
- tag:churn_risk=high_if_passed
- tag:mitigation=volume_tiers+routing
EV charging and new vertical growth
EV charging capex is driving expansion of unattended endpoints with higher ticket sizes; global public charger installations rose an estimated 45% year-over-year in 2024, increasing average deployment cost per site and boosting Nayax addressable hardware payments. Utilization curves now directly influence revenue predictability for operators. Bundling telemetry with payments improves operator ROI by enabling uptime and dynamic pricing; early movers capture recurring software and transaction fees as fleets and retail chargers scale.
- EV spend: +45% YoY public chargers (2024)
- Higher ticket sizes: larger hardware + installation
- Telemetry+payments: better uptime, dynamic pricing
- Early positioning: recurring SW/tx fee capture
Interchange caps squeeze margins; IIJA/AFIR and localization drive EV charging and payments
Macroeconomic weakness and 2024–25 inflation squeezed discretionary vending spend, while laundromat and utility payments held steadier, smoothing Nayax transaction volumes. Higher rates (US fed funds 5.25–5.50% mid‑2025) raise financing costs and lengthen retrofit paybacks, slowing capex-driven adoption. FX volatility (BIS FX turnover ≈7.5trn USD 2022) and MDR shifts (~1.5% avg) pressure margins; hedging and routing mitigate risk.
| tag | value |
|---|---|
| avg_MDR | ≈1.5% |
| fed_fund_mid2025 | 5.25–5.50% |
| FX_turnover_BIS2022 | ≈7.5trn USD/day |
| EV_pub_chargers_2024 | +45% YoY |
Preview Before You Purchase
Nayax PESTLE Analysis
The Nayax PESTLE Analysis preview shown here is the exact document you’ll receive after purchase—fully formatted, professionally structured, and ready to use. The layout, content, and structure visible are identical to the downloadable file; no placeholders, no teasers. After payment you’ll receive this same finished file instantly.

Your Competitive Advantage Starts with This Report
Gain a competitive edge with our PESTLE Analysis of Nayax. It reveals political, economic, social, technological, legal and environmental factors shaping growth and risk. Ready-made and actionable for investors and strategists. Purchase the full report for the complete, editable deep-dive.
Political factors
Payments regulation and supervision
Central banks and finance ministries set rules for cashless payments, notably the EU interchange caps of 0.2% for debit and 0.3% for credit cards, which directly influence processing economics. Shifts in policy on fees or settlement timing can compress unit economics for transaction processors. Nayax must adapt pricing and compliance to maintain margins. Active engagement with regulators reduces surprise risk.
Public digitalization agendas
Government-backed cashless initiatives accelerate adoption in transit, public venues and utilities, with over 100 countries now pursuing national digital payment strategies (IMF/World Bank reporting). Subsidies or mandated standards can open unattended categories like kiosks and EV charging. Conversely, stalled programs materially slow rollouts and revenue. Aligning Nayax products with national standards shortens certification timelines and market entry.
Trade policy and cross-border operations
Tariffs, sanctions and import rules can materially raise Nayax hardware costs and restrict market access, especially for card readers and POS terminals in regions with elevated duties. Nayax, listed on Nasdaq (ticker NYAX) and operating in 60+ countries, requires flexible sourcing and multiple certifications (EMV, PCI) to maintain cross-border operations. Political instability can disrupt local distributors and service partners, increasing working capital needs. Geographic diversification across 60+ markets helps hedge localized policy shocks.
Infrastructure and smart city investment
Public funding expands addressable endpoints: US IIJA allocates about 7.5 billion USD for EV charging and EU AFIR (adopted 2023) sets TEN-T charging targets, accelerating kiosks and urban IoT deployments.
Procurement rules increasingly favour compliant, cybersecurity-certified vendors, raising entry barriers for non-compliant suppliers.
Political cycles can delay tenders or shift budgets; building references through pilot programs improves procurement scoring and contract win rates.
- Public funding: IIJA 7.5B USD; EU AFIR targets
- Procurement: compliance + security required
- Risk: political delays, budget re-prioritization
- Advantage: pilots raise win probability
Data sovereignty priorities
Governments increasingly demand local data residency and oversight for payments and telemetry, with 65+ countries adopting localization measures as of 2024 and the EU's GDPR still governing cross‑border flows across 27 member states. Localization raises deployment cost and complexity but is often a prerequisite for market entry and licensure in high‑value markets. Clear data governance and certified local controls build regulator trust, while modular cloud architectures enable region‑specific isolation and faster compliance.
- 65+ countries (2024) — rising localization mandates
- 27 EU states — GDPR cross‑border constraints
- Localization increases implementation cost and time
- Modular cloud = region isolation, easier audits
Interchange caps squeeze margins; IIJA/AFIR and localization drive EV charging and payments
Regulatory caps and settlement rules (EU 0.2%/0.3%) directly compress payment margins and require pricing adjustments. National cashless programs and US IIJA/EU AFIR funding accelerate terminals and EV charging uptake. Localization (65+ countries, 2024) and procurement/security mandates raise entry costs but favor compliant vendors.
| Metric | Value |
|---|---|
| Interchange caps (EU) | 0.2% debit / 0.3% credit |
| Markets | 60+ countries |
| Localization mandates | 65+ countries (2024) |
| Public funding | IIJA ~7.5B USD; AFIR targets (2023) |
What is included in the product
Detailed Word Document
Explores how macro-environmental factors uniquely affect Nayax across Political, Economic, Social, Technological, Environmental and Legal dimensions, with data-driven trends and region-specific regulatory context. Designed for executives and investors, the analysis offers forward-looking insights, actionable opportunities and risks, and clean formatting ready for reports or pitch decks.
Customizable Excel Spreadsheet
A concise, visually segmented PESTLE summary for Nayax that highlights external risks and opportunities, ideal for drop-in slides or quick team alignment. Allows easy annotation for region-specific impacts and seamless sharing across teams.
Economic factors
Consumer spending and foot traffic
Macroeconomic cycles drive vending and laundromat revenue volatility, with higher inflation and slower growth in 2023–24 squeezing discretionary spend and reducing impulse purchases that power snack and beverage sales.
Essential services such as laundromats and unattended payment for utilities showed relative resilience versus snacks during downturns, supporting steadier transaction volumes.
Active portfolio mix management—shifting toward payment-enabled essentials and payment-as-a-service accounts—smooths cash flows for Nayax across its 65+ market footprint.
Interest rates and capital costs
Higher rates raise hardware financing and operator lease costs; the US federal funds rate was 5.25–5.50% in mid-2025 and the prime rate near 8.5%, lifting borrowing costs for Nayax customers. Payback periods for retrofits lengthen, dampening adoption as capex hurdles grow. Strong ROI analytics can sustain sales despite rate pressure, and flexible pricing and bundles mitigate upfront capex barriers.
FX exposure and global pricing
Multi-currency revenues and costs expose Nayax to translation and transaction risk amid a global FX market with average daily turnover of about 7.5 trillion USD (BIS, 2022); currency swings also shift device ASPs and processor fees, which commonly range 1–3% of transaction value. Nayax uses forward/option hedging to protect gross margins and implements localized pricing to preserve competitiveness across markets.
Card scheme and processor fees
Network fee increases directly compress Nayax take-rates; the global average merchant discount rate is about 1.5% and a 20–50 bps swing can materially reduce platform margins. Blended MDR and interchange shifts change operator economics and passing fees to merchants risks churn in price-sensitive vending and unattended retail. Negotiating volume tiers and routing optimizations protects margin.
- tag:avg_MDR≈1.5%
- tag:bps_impact=20–50
- tag:churn_risk=high_if_passed
- tag:mitigation=volume_tiers+routing
EV charging and new vertical growth
EV charging capex is driving expansion of unattended endpoints with higher ticket sizes; global public charger installations rose an estimated 45% year-over-year in 2024, increasing average deployment cost per site and boosting Nayax addressable hardware payments. Utilization curves now directly influence revenue predictability for operators. Bundling telemetry with payments improves operator ROI by enabling uptime and dynamic pricing; early movers capture recurring software and transaction fees as fleets and retail chargers scale.
- EV spend: +45% YoY public chargers (2024)
- Higher ticket sizes: larger hardware + installation
- Telemetry+payments: better uptime, dynamic pricing
- Early positioning: recurring SW/tx fee capture
Interchange caps squeeze margins; IIJA/AFIR and localization drive EV charging and payments
Macroeconomic weakness and 2024–25 inflation squeezed discretionary vending spend, while laundromat and utility payments held steadier, smoothing Nayax transaction volumes. Higher rates (US fed funds 5.25–5.50% mid‑2025) raise financing costs and lengthen retrofit paybacks, slowing capex-driven adoption. FX volatility (BIS FX turnover ≈7.5trn USD 2022) and MDR shifts (~1.5% avg) pressure margins; hedging and routing mitigate risk.
| tag | value |
|---|---|
| avg_MDR | ≈1.5% |
| fed_fund_mid2025 | 5.25–5.50% |
| FX_turnover_BIS2022 | ≈7.5trn USD/day |
| EV_pub_chargers_2024 | +45% YoY |
Preview Before You Purchase
Nayax PESTLE Analysis
The Nayax PESTLE Analysis preview shown here is the exact document you’ll receive after purchase—fully formatted, professionally structured, and ready to use. The layout, content, and structure visible are identical to the downloadable file; no placeholders, no teasers. After payment you’ll receive this same finished file instantly.
Description
Your Competitive Advantage Starts with This Report
Gain a competitive edge with our PESTLE Analysis of Nayax. It reveals political, economic, social, technological, legal and environmental factors shaping growth and risk. Ready-made and actionable for investors and strategists. Purchase the full report for the complete, editable deep-dive.
Political factors
Payments regulation and supervision
Central banks and finance ministries set rules for cashless payments, notably the EU interchange caps of 0.2% for debit and 0.3% for credit cards, which directly influence processing economics. Shifts in policy on fees or settlement timing can compress unit economics for transaction processors. Nayax must adapt pricing and compliance to maintain margins. Active engagement with regulators reduces surprise risk.
Public digitalization agendas
Government-backed cashless initiatives accelerate adoption in transit, public venues and utilities, with over 100 countries now pursuing national digital payment strategies (IMF/World Bank reporting). Subsidies or mandated standards can open unattended categories like kiosks and EV charging. Conversely, stalled programs materially slow rollouts and revenue. Aligning Nayax products with national standards shortens certification timelines and market entry.
Trade policy and cross-border operations
Tariffs, sanctions and import rules can materially raise Nayax hardware costs and restrict market access, especially for card readers and POS terminals in regions with elevated duties. Nayax, listed on Nasdaq (ticker NYAX) and operating in 60+ countries, requires flexible sourcing and multiple certifications (EMV, PCI) to maintain cross-border operations. Political instability can disrupt local distributors and service partners, increasing working capital needs. Geographic diversification across 60+ markets helps hedge localized policy shocks.
Infrastructure and smart city investment
Public funding expands addressable endpoints: US IIJA allocates about 7.5 billion USD for EV charging and EU AFIR (adopted 2023) sets TEN-T charging targets, accelerating kiosks and urban IoT deployments.
Procurement rules increasingly favour compliant, cybersecurity-certified vendors, raising entry barriers for non-compliant suppliers.
Political cycles can delay tenders or shift budgets; building references through pilot programs improves procurement scoring and contract win rates.
- Public funding: IIJA 7.5B USD; EU AFIR targets
- Procurement: compliance + security required
- Risk: political delays, budget re-prioritization
- Advantage: pilots raise win probability
Data sovereignty priorities
Governments increasingly demand local data residency and oversight for payments and telemetry, with 65+ countries adopting localization measures as of 2024 and the EU's GDPR still governing cross‑border flows across 27 member states. Localization raises deployment cost and complexity but is often a prerequisite for market entry and licensure in high‑value markets. Clear data governance and certified local controls build regulator trust, while modular cloud architectures enable region‑specific isolation and faster compliance.
- 65+ countries (2024) — rising localization mandates
- 27 EU states — GDPR cross‑border constraints
- Localization increases implementation cost and time
- Modular cloud = region isolation, easier audits
Interchange caps squeeze margins; IIJA/AFIR and localization drive EV charging and payments
Regulatory caps and settlement rules (EU 0.2%/0.3%) directly compress payment margins and require pricing adjustments. National cashless programs and US IIJA/EU AFIR funding accelerate terminals and EV charging uptake. Localization (65+ countries, 2024) and procurement/security mandates raise entry costs but favor compliant vendors.
| Metric | Value |
|---|---|
| Interchange caps (EU) | 0.2% debit / 0.3% credit |
| Markets | 60+ countries |
| Localization mandates | 65+ countries (2024) |
| Public funding | IIJA ~7.5B USD; AFIR targets (2023) |
What is included in the product
Detailed Word Document
Explores how macro-environmental factors uniquely affect Nayax across Political, Economic, Social, Technological, Environmental and Legal dimensions, with data-driven trends and region-specific regulatory context. Designed for executives and investors, the analysis offers forward-looking insights, actionable opportunities and risks, and clean formatting ready for reports or pitch decks.
Customizable Excel Spreadsheet
A concise, visually segmented PESTLE summary for Nayax that highlights external risks and opportunities, ideal for drop-in slides or quick team alignment. Allows easy annotation for region-specific impacts and seamless sharing across teams.
Economic factors
Consumer spending and foot traffic
Macroeconomic cycles drive vending and laundromat revenue volatility, with higher inflation and slower growth in 2023–24 squeezing discretionary spend and reducing impulse purchases that power snack and beverage sales.
Essential services such as laundromats and unattended payment for utilities showed relative resilience versus snacks during downturns, supporting steadier transaction volumes.
Active portfolio mix management—shifting toward payment-enabled essentials and payment-as-a-service accounts—smooths cash flows for Nayax across its 65+ market footprint.
Interest rates and capital costs
Higher rates raise hardware financing and operator lease costs; the US federal funds rate was 5.25–5.50% in mid-2025 and the prime rate near 8.5%, lifting borrowing costs for Nayax customers. Payback periods for retrofits lengthen, dampening adoption as capex hurdles grow. Strong ROI analytics can sustain sales despite rate pressure, and flexible pricing and bundles mitigate upfront capex barriers.
FX exposure and global pricing
Multi-currency revenues and costs expose Nayax to translation and transaction risk amid a global FX market with average daily turnover of about 7.5 trillion USD (BIS, 2022); currency swings also shift device ASPs and processor fees, which commonly range 1–3% of transaction value. Nayax uses forward/option hedging to protect gross margins and implements localized pricing to preserve competitiveness across markets.
Card scheme and processor fees
Network fee increases directly compress Nayax take-rates; the global average merchant discount rate is about 1.5% and a 20–50 bps swing can materially reduce platform margins. Blended MDR and interchange shifts change operator economics and passing fees to merchants risks churn in price-sensitive vending and unattended retail. Negotiating volume tiers and routing optimizations protects margin.
- tag:avg_MDR≈1.5%
- tag:bps_impact=20–50
- tag:churn_risk=high_if_passed
- tag:mitigation=volume_tiers+routing
EV charging and new vertical growth
EV charging capex is driving expansion of unattended endpoints with higher ticket sizes; global public charger installations rose an estimated 45% year-over-year in 2024, increasing average deployment cost per site and boosting Nayax addressable hardware payments. Utilization curves now directly influence revenue predictability for operators. Bundling telemetry with payments improves operator ROI by enabling uptime and dynamic pricing; early movers capture recurring software and transaction fees as fleets and retail chargers scale.
- EV spend: +45% YoY public chargers (2024)
- Higher ticket sizes: larger hardware + installation
- Telemetry+payments: better uptime, dynamic pricing
- Early positioning: recurring SW/tx fee capture
Interchange caps squeeze margins; IIJA/AFIR and localization drive EV charging and payments
Macroeconomic weakness and 2024–25 inflation squeezed discretionary vending spend, while laundromat and utility payments held steadier, smoothing Nayax transaction volumes. Higher rates (US fed funds 5.25–5.50% mid‑2025) raise financing costs and lengthen retrofit paybacks, slowing capex-driven adoption. FX volatility (BIS FX turnover ≈7.5trn USD 2022) and MDR shifts (~1.5% avg) pressure margins; hedging and routing mitigate risk.
| tag | value |
|---|---|
| avg_MDR | ≈1.5% |
| fed_fund_mid2025 | 5.25–5.50% |
| FX_turnover_BIS2022 | ≈7.5trn USD/day |
| EV_pub_chargers_2024 | +45% YoY |
Preview Before You Purchase
Nayax PESTLE Analysis
The Nayax PESTLE Analysis preview shown here is the exact document you’ll receive after purchase—fully formatted, professionally structured, and ready to use. The layout, content, and structure visible are identical to the downloadable file; no placeholders, no teasers. After payment you’ll receive this same finished file instantly.











