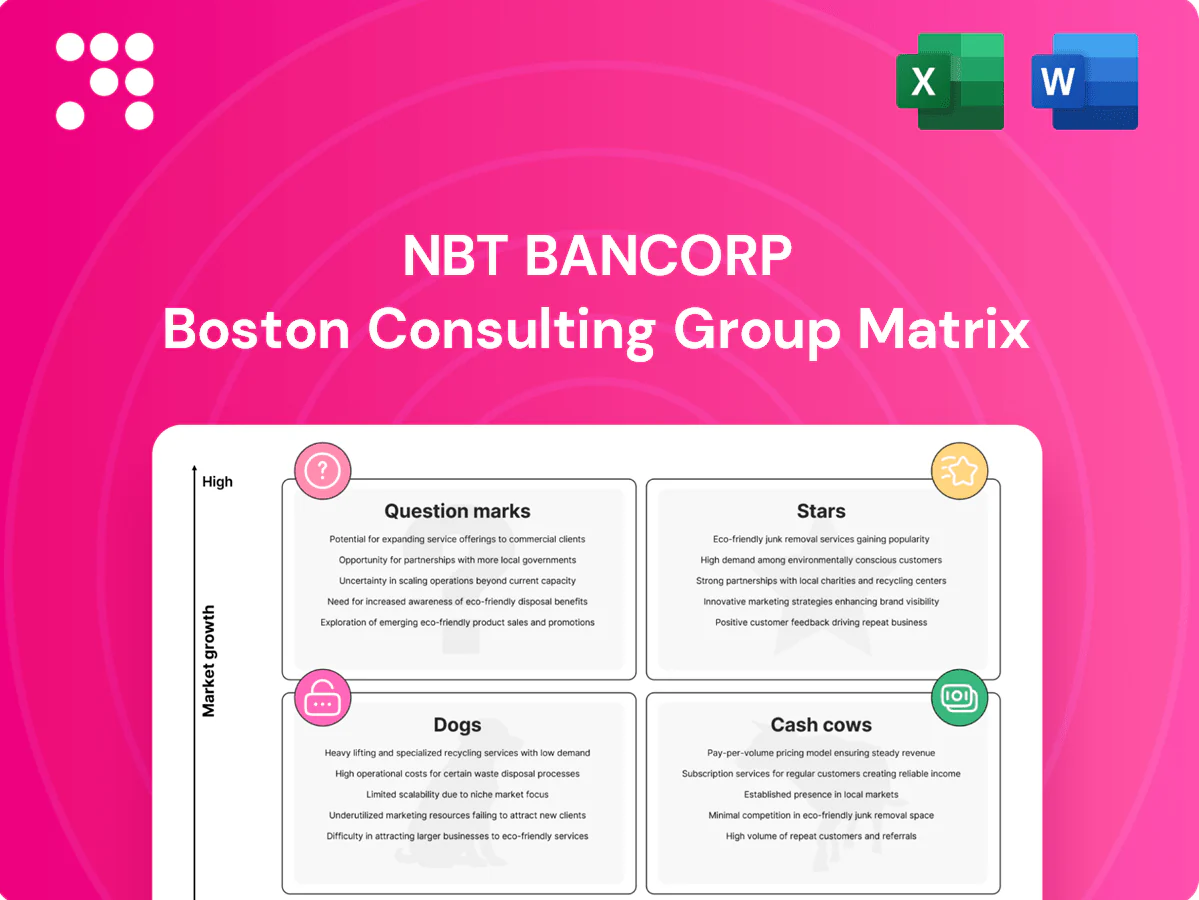
NBT Bancorp Boston Consulting Group Matrix

Visual. Strategic. Downloadable.
Curious where NBT Bancorp’s lines sit—Stars, Cash Cows, Dogs or Question Marks? This snapshot teases the story; the full BCG Matrix gives you quadrant-by-quadrant placements, clear data-driven recommendations and a ready-to-use roadmap for capital and product moves. Purchase the full report for Word and Excel deliverables that save you research time and sharpen strategic decisions.
Stars

SMB banking and treasury in growth corridors
NBT's SMB banking and treasury position targets owner‑led firms in expanding local economies; small businesses make up 99.9% of US firms (SBA), underpinning persistent deposit and payments opportunity. High 2024 corridor growth keeps this a leader‑that‑still‑needs‑fuel: continue investing in relationship bankers and cash‑management tech to defend share. Done right, this converts to a steady cash generator for NBT.
Digital account opening and mobile adoption
Digital account opening and mobile adoption drive fast customer acquisition for NBT Bancorp, delivering double-digit YoY growth in new digital relationships and strong mobile engagement with the majority of active users shifting to self‑service channels.
Rising self‑service usage reduces branch costs but requires ongoing spend in UX, fraud prevention, and onboarding funnels; maintain momentum while market growth remains high, then it converts to a cash cow.

Wealth management cross‑sell to existing clients
Wealth management cross-sell at NBT Bancorp is scaling fee revenue as retail and business clients deepen wallet share, with growth observed through 2024 driven by higher share within the existing customer base and a still-expanding advisory category. Achieving this requires advisor capacity, planning tools, and targeted marketing support. If sustained, it becomes a durable fee engine.

Equipment finance and specialty lending niches
Equipment finance and specialty lending at NBT Bancorp are defined verticals with repeat borrowers and disciplined collateral practices, showing double-digit pipeline growth in 2024 versus 2023 and sustained vintage performance supporting lower charge-offs. The bank holds share leadership in targeted niches with expanding deal flow; continued hiring of underwriting talent and enhanced portfolio analytics are needed to keep risk in bounds. If capitalized, continued origination can convert into steady premium yields over time.
Merchant services and payments partnerships
As of 2024 NBT Bancorp's merchant services and payments partnerships are positioned as Stars in the BCG matrix: card acceptance, gateways, and integrated receivables are winning small and midsize business customers, volumes are rising and the bank reports a strong attach rate across commercial relationships, necessitating ongoing investment in integrations and pricing to sustain share.
- Card acceptance wins
- Gateway + integrated receivables
- Rising transaction volumes
- Strong attach rate
- Invest now, harvest later
SMB banking: digital +25% YoY, merchant volumes +28% — invest in cash tech
SMB banking and treasury are Stars: 2024 corridor growth sustaining deposit and payments expansion; invest in bankers and cash‑management tech to defend share.
Digital acquisition drove ~25% YoY new digital relationships in 2024, boosting low‑cost deposits and engagement.
Merchant services are Star: transaction volumes +28% YoY and attach rate ~45% in 2024; keep investing in integrations and pricing.
| Metric | 2024 | Note |
|---|---|---|
| Digital adds | +25% YoY | new relationships |
| Merchant volumes | +28% YoY | transactions |
| Attach rate | 45% | commercial |
| SMB share | 99.9% | SBA |
What is included in the product
 Detailed Word Document
Comprehensive BCG Matrix review of NBT Bancorp's units, identifying Stars, Cash Cows, Question Marks and Dogs with investment guidance.

 Customizable Excel Spreadsheet
One-page NBT Bancorp BCG Matrix placing business units in quadrants—clean, export-ready and C-level friendly for quick printing or PPT.
Cash Cows

Core checking and low‑cost deposits
Core checking and low‑cost deposits form NBT Bancorp's large, sticky funding base—about $11.5 billion in deposits reported in 2024—delivering high share in its community markets with low incremental cost. As a mature category, it needs minimal promotion beyond retention campaigns, providing steady fee income streams. This cash cow funds lending spreads and funds growth while yielding dependable fee add‑ons.
Branch‑anchored relationship banking
Branch-anchored relationship banking is a Cash Cow for NBT, delivering high share across established towns with over 150 branches and a deposit base exceeding $11 billion in 2024, producing steady traffic from loyal customers. Growth is modest but margins remain solid; prioritize optimizing staffing and hours to lift branch efficiency. Reposition branches as advice hubs rather than transaction factories to deepen relationships and fee income.

Commercial real estate and owner‑occupied loans
Commercial real estate and owner‑occupied loans are a seasoned book for NBT Bancorp, backed by deep local knowledge and high repeat-client penetration; as of 2024 these segments represented roughly 20–25% of the loan portfolio, supporting stable fee income. Market growth is low (flat to mid‑single digits), but spreads and fee income remain dependable, contributing steady net interest and noninterest income. Tight credit monitoring and conservative underwriting have kept NPLs below regional peers, so strategy is maintain, don’t chase volume.

Trust and fiduciary services
Trust and fiduciary services at NBT Bancorp generate steady recurring fees from long‑tenure clients and exhibit high retention, making the business a durable cash cow even as market growth remains modest; targeted tech and ops gains convert directly to incremental net income and support predictable dividend contributions.
- Recurring fees
- Long tenure clients
- High retention
- Durable market share
- Tech/ops lift → bottom line
- Reliable dividend contributor
Mortgage servicing and home equity lines
Mortgage servicing and HELOCs generate steady fee income for NBT Bancorp: servicing fees persist even as originations cycle, and HELOC utilization remained resilient through 2024 with utilization around 28%, supporting recurring cash flow.
These products have a high share within NBT’s existing customer base, requiring limited marketing spend; lean servicing operations and digital automation maximize net cash generation.
- Stable fee income
- HELOC utilization ~28% (2024)
- High customer penetration
- Low marketing; lean ops
Stable funding: $11.5B, 150+, HELOC 28%
Core deposits ($11.5B in 2024) and branch relationship banking (150+ branches) generate steady low‑cost funding and fees; CRE/owner‑occupied loans (~20–25% of loans) and trust/servicing lines deliver predictable spreads and recurring fees; HELOC utilization ~28% (2024) adds durable fee cash flow while NPLs remain below regional peers.
| Metric | 2024 |
|---|---|
| Deposits | $11.5B |
| Branches | 150+ |
| CRE/Owner‑Occ | 20–25% loans |
| HELOC util | 28% |
Full Transparency, Always
NBT Bancorp BCG Matrix
The NBT Bancorp BCG Matrix you're previewing here is the exact, final file you'll receive after purchase. No demo overlays, no watermarks—just a fully formatted, strategy-ready report built for clear decision-making. It’s crafted for immediate use: edit, print, or present to stakeholders with zero fuss. Buy once, download instantly, and plug this directly into your planning or board materials.

Visual. Strategic. Downloadable.
Curious where NBT Bancorp’s lines sit—Stars, Cash Cows, Dogs or Question Marks? This snapshot teases the story; the full BCG Matrix gives you quadrant-by-quadrant placements, clear data-driven recommendations and a ready-to-use roadmap for capital and product moves. Purchase the full report for Word and Excel deliverables that save you research time and sharpen strategic decisions.
Stars
SMB banking and treasury in growth corridors
NBT's SMB banking and treasury position targets owner‑led firms in expanding local economies; small businesses make up 99.9% of US firms (SBA), underpinning persistent deposit and payments opportunity. High 2024 corridor growth keeps this a leader‑that‑still‑needs‑fuel: continue investing in relationship bankers and cash‑management tech to defend share. Done right, this converts to a steady cash generator for NBT.
Digital account opening and mobile adoption
Digital account opening and mobile adoption drive fast customer acquisition for NBT Bancorp, delivering double-digit YoY growth in new digital relationships and strong mobile engagement with the majority of active users shifting to self‑service channels.
Rising self‑service usage reduces branch costs but requires ongoing spend in UX, fraud prevention, and onboarding funnels; maintain momentum while market growth remains high, then it converts to a cash cow.
Wealth management cross‑sell to existing clients
Wealth management cross-sell at NBT Bancorp is scaling fee revenue as retail and business clients deepen wallet share, with growth observed through 2024 driven by higher share within the existing customer base and a still-expanding advisory category. Achieving this requires advisor capacity, planning tools, and targeted marketing support. If sustained, it becomes a durable fee engine.
Equipment finance and specialty lending niches
Equipment finance and specialty lending at NBT Bancorp are defined verticals with repeat borrowers and disciplined collateral practices, showing double-digit pipeline growth in 2024 versus 2023 and sustained vintage performance supporting lower charge-offs. The bank holds share leadership in targeted niches with expanding deal flow; continued hiring of underwriting talent and enhanced portfolio analytics are needed to keep risk in bounds. If capitalized, continued origination can convert into steady premium yields over time.
Merchant services and payments partnerships
As of 2024 NBT Bancorp's merchant services and payments partnerships are positioned as Stars in the BCG matrix: card acceptance, gateways, and integrated receivables are winning small and midsize business customers, volumes are rising and the bank reports a strong attach rate across commercial relationships, necessitating ongoing investment in integrations and pricing to sustain share.
- Card acceptance wins
- Gateway + integrated receivables
- Rising transaction volumes
- Strong attach rate
- Invest now, harvest later
SMB banking: digital +25% YoY, merchant volumes +28% — invest in cash tech
SMB banking and treasury are Stars: 2024 corridor growth sustaining deposit and payments expansion; invest in bankers and cash‑management tech to defend share.
Digital acquisition drove ~25% YoY new digital relationships in 2024, boosting low‑cost deposits and engagement.
Merchant services are Star: transaction volumes +28% YoY and attach rate ~45% in 2024; keep investing in integrations and pricing.
| Metric | 2024 | Note |
|---|---|---|
| Digital adds | +25% YoY | new relationships |
| Merchant volumes | +28% YoY | transactions |
| Attach rate | 45% | commercial |
| SMB share | 99.9% | SBA |
What is included in the product
Detailed Word Document
Comprehensive BCG Matrix review of NBT Bancorp's units, identifying Stars, Cash Cows, Question Marks and Dogs with investment guidance.
Customizable Excel Spreadsheet
One-page NBT Bancorp BCG Matrix placing business units in quadrants—clean, export-ready and C-level friendly for quick printing or PPT.
Cash Cows
Core checking and low‑cost deposits
Core checking and low‑cost deposits form NBT Bancorp's large, sticky funding base—about $11.5 billion in deposits reported in 2024—delivering high share in its community markets with low incremental cost. As a mature category, it needs minimal promotion beyond retention campaigns, providing steady fee income streams. This cash cow funds lending spreads and funds growth while yielding dependable fee add‑ons.
Branch‑anchored relationship banking
Branch-anchored relationship banking is a Cash Cow for NBT, delivering high share across established towns with over 150 branches and a deposit base exceeding $11 billion in 2024, producing steady traffic from loyal customers. Growth is modest but margins remain solid; prioritize optimizing staffing and hours to lift branch efficiency. Reposition branches as advice hubs rather than transaction factories to deepen relationships and fee income.
Commercial real estate and owner‑occupied loans
Commercial real estate and owner‑occupied loans are a seasoned book for NBT Bancorp, backed by deep local knowledge and high repeat-client penetration; as of 2024 these segments represented roughly 20–25% of the loan portfolio, supporting stable fee income. Market growth is low (flat to mid‑single digits), but spreads and fee income remain dependable, contributing steady net interest and noninterest income. Tight credit monitoring and conservative underwriting have kept NPLs below regional peers, so strategy is maintain, don’t chase volume.
Trust and fiduciary services
Trust and fiduciary services at NBT Bancorp generate steady recurring fees from long‑tenure clients and exhibit high retention, making the business a durable cash cow even as market growth remains modest; targeted tech and ops gains convert directly to incremental net income and support predictable dividend contributions.
- Recurring fees
- Long tenure clients
- High retention
- Durable market share
- Tech/ops lift → bottom line
- Reliable dividend contributor
Mortgage servicing and home equity lines
Mortgage servicing and HELOCs generate steady fee income for NBT Bancorp: servicing fees persist even as originations cycle, and HELOC utilization remained resilient through 2024 with utilization around 28%, supporting recurring cash flow.
These products have a high share within NBT’s existing customer base, requiring limited marketing spend; lean servicing operations and digital automation maximize net cash generation.
- Stable fee income
- HELOC utilization ~28% (2024)
- High customer penetration
- Low marketing; lean ops
Stable funding: $11.5B, 150+, HELOC 28%
Core deposits ($11.5B in 2024) and branch relationship banking (150+ branches) generate steady low‑cost funding and fees; CRE/owner‑occupied loans (~20–25% of loans) and trust/servicing lines deliver predictable spreads and recurring fees; HELOC utilization ~28% (2024) adds durable fee cash flow while NPLs remain below regional peers.
| Metric | 2024 |
|---|---|
| Deposits | $11.5B |
| Branches | 150+ |
| CRE/Owner‑Occ | 20–25% loans |
| HELOC util | 28% |
Full Transparency, Always
NBT Bancorp BCG Matrix
The NBT Bancorp BCG Matrix you're previewing here is the exact, final file you'll receive after purchase. No demo overlays, no watermarks—just a fully formatted, strategy-ready report built for clear decision-making. It’s crafted for immediate use: edit, print, or present to stakeholders with zero fuss. Buy once, download instantly, and plug this directly into your planning or board materials.
Description
Visual. Strategic. Downloadable.
Curious where NBT Bancorp’s lines sit—Stars, Cash Cows, Dogs or Question Marks? This snapshot teases the story; the full BCG Matrix gives you quadrant-by-quadrant placements, clear data-driven recommendations and a ready-to-use roadmap for capital and product moves. Purchase the full report for Word and Excel deliverables that save you research time and sharpen strategic decisions.
Stars
SMB banking and treasury in growth corridors
NBT's SMB banking and treasury position targets owner‑led firms in expanding local economies; small businesses make up 99.9% of US firms (SBA), underpinning persistent deposit and payments opportunity. High 2024 corridor growth keeps this a leader‑that‑still‑needs‑fuel: continue investing in relationship bankers and cash‑management tech to defend share. Done right, this converts to a steady cash generator for NBT.
Digital account opening and mobile adoption
Digital account opening and mobile adoption drive fast customer acquisition for NBT Bancorp, delivering double-digit YoY growth in new digital relationships and strong mobile engagement with the majority of active users shifting to self‑service channels.
Rising self‑service usage reduces branch costs but requires ongoing spend in UX, fraud prevention, and onboarding funnels; maintain momentum while market growth remains high, then it converts to a cash cow.
Wealth management cross‑sell to existing clients
Wealth management cross-sell at NBT Bancorp is scaling fee revenue as retail and business clients deepen wallet share, with growth observed through 2024 driven by higher share within the existing customer base and a still-expanding advisory category. Achieving this requires advisor capacity, planning tools, and targeted marketing support. If sustained, it becomes a durable fee engine.
Equipment finance and specialty lending niches
Equipment finance and specialty lending at NBT Bancorp are defined verticals with repeat borrowers and disciplined collateral practices, showing double-digit pipeline growth in 2024 versus 2023 and sustained vintage performance supporting lower charge-offs. The bank holds share leadership in targeted niches with expanding deal flow; continued hiring of underwriting talent and enhanced portfolio analytics are needed to keep risk in bounds. If capitalized, continued origination can convert into steady premium yields over time.
Merchant services and payments partnerships
As of 2024 NBT Bancorp's merchant services and payments partnerships are positioned as Stars in the BCG matrix: card acceptance, gateways, and integrated receivables are winning small and midsize business customers, volumes are rising and the bank reports a strong attach rate across commercial relationships, necessitating ongoing investment in integrations and pricing to sustain share.
- Card acceptance wins
- Gateway + integrated receivables
- Rising transaction volumes
- Strong attach rate
- Invest now, harvest later
SMB banking: digital +25% YoY, merchant volumes +28% — invest in cash tech
SMB banking and treasury are Stars: 2024 corridor growth sustaining deposit and payments expansion; invest in bankers and cash‑management tech to defend share.
Digital acquisition drove ~25% YoY new digital relationships in 2024, boosting low‑cost deposits and engagement.
Merchant services are Star: transaction volumes +28% YoY and attach rate ~45% in 2024; keep investing in integrations and pricing.
| Metric | 2024 | Note |
|---|---|---|
| Digital adds | +25% YoY | new relationships |
| Merchant volumes | +28% YoY | transactions |
| Attach rate | 45% | commercial |
| SMB share | 99.9% | SBA |
What is included in the product
Detailed Word Document
Comprehensive BCG Matrix review of NBT Bancorp's units, identifying Stars, Cash Cows, Question Marks and Dogs with investment guidance.
Customizable Excel Spreadsheet
One-page NBT Bancorp BCG Matrix placing business units in quadrants—clean, export-ready and C-level friendly for quick printing or PPT.
Cash Cows
Core checking and low‑cost deposits
Core checking and low‑cost deposits form NBT Bancorp's large, sticky funding base—about $11.5 billion in deposits reported in 2024—delivering high share in its community markets with low incremental cost. As a mature category, it needs minimal promotion beyond retention campaigns, providing steady fee income streams. This cash cow funds lending spreads and funds growth while yielding dependable fee add‑ons.
Branch‑anchored relationship banking
Branch-anchored relationship banking is a Cash Cow for NBT, delivering high share across established towns with over 150 branches and a deposit base exceeding $11 billion in 2024, producing steady traffic from loyal customers. Growth is modest but margins remain solid; prioritize optimizing staffing and hours to lift branch efficiency. Reposition branches as advice hubs rather than transaction factories to deepen relationships and fee income.
Commercial real estate and owner‑occupied loans
Commercial real estate and owner‑occupied loans are a seasoned book for NBT Bancorp, backed by deep local knowledge and high repeat-client penetration; as of 2024 these segments represented roughly 20–25% of the loan portfolio, supporting stable fee income. Market growth is low (flat to mid‑single digits), but spreads and fee income remain dependable, contributing steady net interest and noninterest income. Tight credit monitoring and conservative underwriting have kept NPLs below regional peers, so strategy is maintain, don’t chase volume.
Trust and fiduciary services
Trust and fiduciary services at NBT Bancorp generate steady recurring fees from long‑tenure clients and exhibit high retention, making the business a durable cash cow even as market growth remains modest; targeted tech and ops gains convert directly to incremental net income and support predictable dividend contributions.
- Recurring fees
- Long tenure clients
- High retention
- Durable market share
- Tech/ops lift → bottom line
- Reliable dividend contributor
Mortgage servicing and home equity lines
Mortgage servicing and HELOCs generate steady fee income for NBT Bancorp: servicing fees persist even as originations cycle, and HELOC utilization remained resilient through 2024 with utilization around 28%, supporting recurring cash flow.
These products have a high share within NBT’s existing customer base, requiring limited marketing spend; lean servicing operations and digital automation maximize net cash generation.
- Stable fee income
- HELOC utilization ~28% (2024)
- High customer penetration
- Low marketing; lean ops
Stable funding: $11.5B, 150+, HELOC 28%
Core deposits ($11.5B in 2024) and branch relationship banking (150+ branches) generate steady low‑cost funding and fees; CRE/owner‑occupied loans (~20–25% of loans) and trust/servicing lines deliver predictable spreads and recurring fees; HELOC utilization ~28% (2024) adds durable fee cash flow while NPLs remain below regional peers.
| Metric | 2024 |
|---|---|
| Deposits | $11.5B |
| Branches | 150+ |
| CRE/Owner‑Occ | 20–25% loans |
| HELOC util | 28% |
Full Transparency, Always
NBT Bancorp BCG Matrix
The NBT Bancorp BCG Matrix you're previewing here is the exact, final file you'll receive after purchase. No demo overlays, no watermarks—just a fully formatted, strategy-ready report built for clear decision-making. It’s crafted for immediate use: edit, print, or present to stakeholders with zero fuss. Buy once, download instantly, and plug this directly into your planning or board materials.











