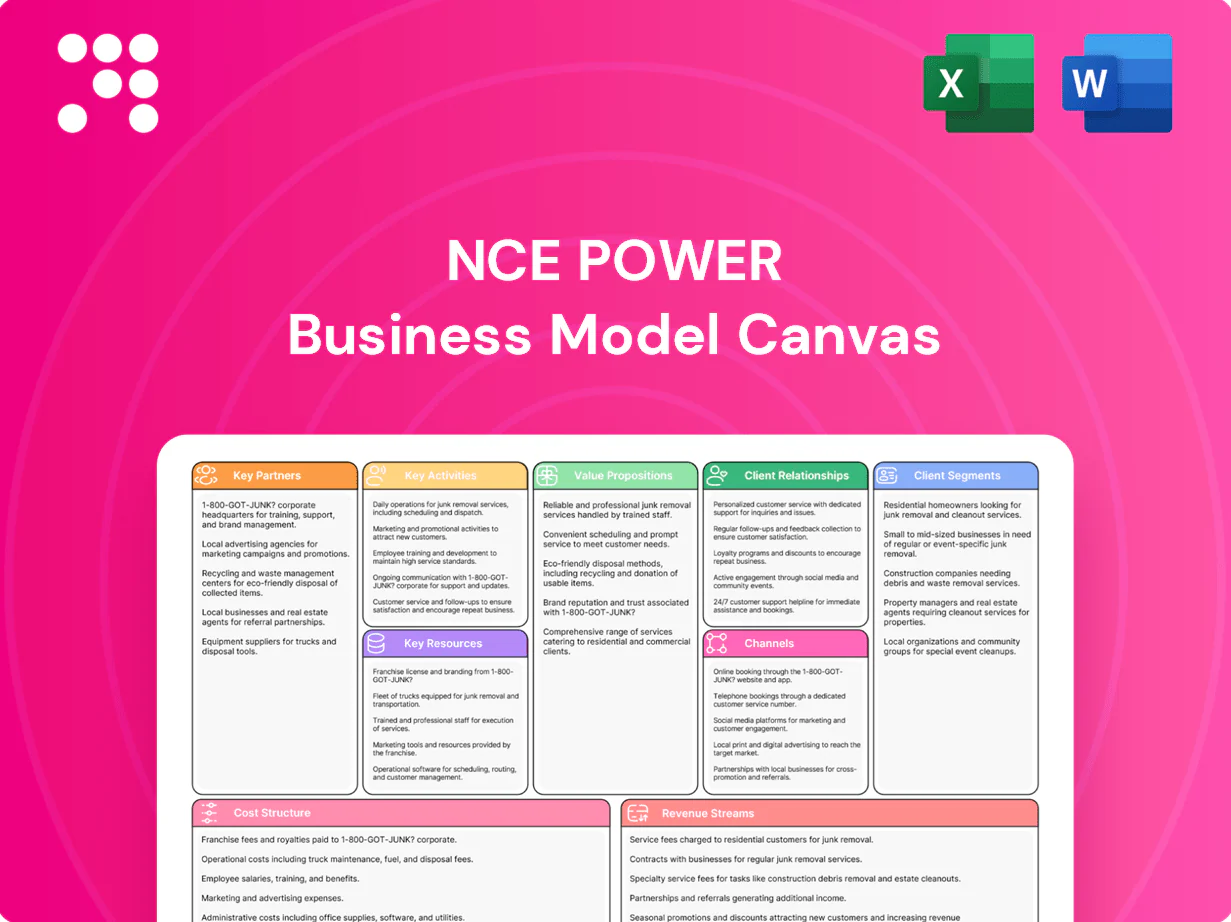
NCE Power Business Model Canvas

Unlock the strategic Business Model Canvas for clean energy growth and investor insights
Unlock the full strategic blueprint behind NCE Power with our Business Model Canvas — a concise, actionable map of its value propositions, customer segments, and revenue levers. Ideal for investors, consultants, and founders, the complete canvas reveals growth drivers, cost structure, and partnership dynamics. Download the Word and Excel files to benchmark, adapt, and execute winning strategies today.
Partnerships

Wafer fabs & OSATs
NCE Power partners with silicon and SiC wafer fabs and OSATs to secure capacity, advanced nodes and cost efficiency, aligning supply with 2024 market growth (SiC demand up ~30% year-on-year). Joint planning synchronizes die sizes, yields and cycle times to forecasted demand. Strategic dual-sourcing mitigates single-vendor risk and ensures continuity. Co-qualification with fabs/OSATs accelerates new-product ramps into volume.
EDA & equipment vendors
Alliances with EDA tool providers and capital-equipment OEMs enable faster design iterations and process improvements, with the global EDA market reaching about $14 billion in 2024, reflecting strong investment in tooling. Access to foundry PDKs, validated device models and TCAD improves accuracy and can cut iterations and time-to-market materially. Early visibility into tool roadmaps guides capex and node-selection decisions, while joint development programs historically boost yield and reliability through co-optimized flows.

Materials & substrate suppliers
Relationships with silicon, SiC and packaging-materials suppliers secure quality, availability and price stability, with ~80% of wafer volumes under 12–36 month long-term agreements to lock in specs and lead times. Collaboration on new substrates and thermal interface materials targets 10–20% efficiency/thermal improvements. Supplier audits (ISO 9001/IATF 16949) ensure 100% traceability and compliance and aim to cap input-cost variance to ±5% annually.

OEMs & Tier-1 integrators
Co-development with leading power supply, motor drive, EV, and inverter OEMs aligns NCE Power products to system requirements and drove design-ins across platforms as global EV sales reached about 14.5 million units in 2024; early engagement secures lifecycle value and multi-year volumes. Joint reliability testing accelerates certifications and shortens time-to-market.
- Co-dev: aligns system needs
- Early engagement: locks multi-year volumes
- Testing: speeds certifications
- 2024 EV sales: ~14.5M
Universities & research institutes
Academic partnerships drive device-physics, wide-bandgap and packaging advances while giving NCE Power access to specialized labs and talent; global R&D spending exceeded $2.5 trillion in 2024, underscoring available sponsored funding. Sponsored projects de-risk exploratory tech and accelerate milestones, and joint IP creation feeds the patent portfolio and licensing pipelines.
- Access to labs and talent
- Sponsored projects de-risk R&D
- Wide-bandgap & packaging innovation
- Co-created IP boosts patents
Wafer/OSAT scale, dual-sourcing and EDA alliances accelerate SiC and EV ramps
NCE Power secures wafer/OSAT capacity (SiC demand +30% YoY in 2024) and dual-sources to mitigate vendor risk; co-qualification accelerates volume ramps. EDA/OEM alliances (EDA market ~$14B in 2024) shorten design cycles. OEM/academic co-devs align products to EV volumes (~14.5M units in 2024) and expand IP/reliability.
| Partner | Role | 2024 Metric |
|---|---|---|
| Fabs/OSATs | Capacity & co-qual | SiC +30% YoY |
| EDA/OEMs | Tooling & capex | $14B market |
| OEMs/Academia | Co-dev & IP | EV 14.5M |
What is included in the product
 Detailed Word Document
A comprehensive, pre-written Business Model Canvas for NCE Power that maps all 9 BMC blocks with detailed value propositions, channels and customer segments, includes SWOT and competitive insights, and is investor-ready for presentations and strategic planning.

 Customizable Excel Spreadsheet
High-level view of NCE Power’s business model with editable cells that quickly identify core components and relieve strategic pain points for teams, saving hours of formatting and structuring your own model.
Activities

Power device R&D
NCE Power designs MOSFETs, IGBTs and SiC diodes optimized for efficiency, switching speed and robustness, targeting 40–1200V classes and currents to 600A. Core activities span TCAD modeling, layout and process integration; reliability engineering qualifies devices for 10-year lifetime at 125°C and >1e6 switching cycles. Roadmap development prioritizes voltage/current tiers aligned with 2024 SiC market expansion.
Wafer fabrication
Fab operations and managed foundry runs produce power dies with tight parametric control, covering implantation, trench/planar formation, metallization and passivation; SPC and yield engineering reduced cost per die, with 2024 industry averages showing >90% mature-process yields and continuous improvement programs delivering up to 20% throughput gains.

Packaging & testing
Advanced packaging (DFN, TO, modules) reduces thermal resistance and enables devices in 600–1200V classes with sub-10 mΩ Rds(on) for power modules. Final test screens leakage (<μA), breakdown voltage, Rds(on) and switching metrics. Burn-in (48–168 h) and AEC-Q (-40 to +150°C) ensure reliability. Test-data analytics drive targeted process fixes.

Applications engineering
Applications engineering: FAEs support customer design-ins with reference designs, SPICE models, and layout guidance; system-level validation in PSUs, drives, lighting and renewables ensures fit; troubleshooting shortens time-to-market; design notes and ANs scale global support. In 2024 the global power semiconductor market was about $64 billion, highlighting demand.
- FAE-led reference designs: quicker design-in
- SPICE/layout: reduce board respins
- System validation: ensures integration in PSUs/drives/lighting/renewables
- ANs/design notes: scale support globally
Quality & compliance
QMS activities enforce ISO 9001 and IATF 16949 controls, drive PPAP/APQP for all automotive launches, and ensure RoHS3 restrictions (10 substance groups) plus REACH compliance; failure analysis with RCA practices targets measurable RMA reduction and continuous corrective action. Supplier quality management and audits preserve part consistency, while lot-level traceability supports customer and regulatory audits.
- Standards: ISO 9001, IATF 16949
- Automotive: 100% PPAP/APQP for launches
- Compliance: RoHS3 (10 groups), REACH (Candidate List >200)
- Quality impact: RCA-driven RMA reduction
- Traceability: lot-level auditability
SiC MOSFETs & IGBTs: 1200V, 600A
NCE Power designs MOSFETs, IGBTs and SiC diodes (40–1200V, up to 600A) optimizing efficiency, switching speed and robustness. Core activities cover TCAD, layout, process integration and reliability engineering (10-year @125°C, >1e6 switching cycles) aligned to 2024 SiC market expansion. Fab, advanced packaging and test yield >90% mature-process, burn-in 48–168h; FAEs deliver SPICE, reference designs and system validation.
| Metric | 2024 Value |
|---|---|
| Global power semiconductor market | $64B |
| Mature-process yield | >90% |
| Throughput improvement | up to 20% |
| Module Rds(on) | <10 mΩ |
| Qualified lifetime | 10 y @125°C |
Delivered as Displayed
Business Model Canvas
The document previewed here is the actual NCE Power Business Model Canvas, not a mockup, and shows the exact structure and content you will receive. After purchase you’ll download this same professional file, fully editable and formatted for immediate use in Word and Excel. No placeholders, no surprises.

Unlock the strategic Business Model Canvas for clean energy growth and investor insights
Unlock the full strategic blueprint behind NCE Power with our Business Model Canvas — a concise, actionable map of its value propositions, customer segments, and revenue levers. Ideal for investors, consultants, and founders, the complete canvas reveals growth drivers, cost structure, and partnership dynamics. Download the Word and Excel files to benchmark, adapt, and execute winning strategies today.
Partnerships
Wafer fabs & OSATs
NCE Power partners with silicon and SiC wafer fabs and OSATs to secure capacity, advanced nodes and cost efficiency, aligning supply with 2024 market growth (SiC demand up ~30% year-on-year). Joint planning synchronizes die sizes, yields and cycle times to forecasted demand. Strategic dual-sourcing mitigates single-vendor risk and ensures continuity. Co-qualification with fabs/OSATs accelerates new-product ramps into volume.
EDA & equipment vendors
Alliances with EDA tool providers and capital-equipment OEMs enable faster design iterations and process improvements, with the global EDA market reaching about $14 billion in 2024, reflecting strong investment in tooling. Access to foundry PDKs, validated device models and TCAD improves accuracy and can cut iterations and time-to-market materially. Early visibility into tool roadmaps guides capex and node-selection decisions, while joint development programs historically boost yield and reliability through co-optimized flows.
Materials & substrate suppliers
Relationships with silicon, SiC and packaging-materials suppliers secure quality, availability and price stability, with ~80% of wafer volumes under 12–36 month long-term agreements to lock in specs and lead times. Collaboration on new substrates and thermal interface materials targets 10–20% efficiency/thermal improvements. Supplier audits (ISO 9001/IATF 16949) ensure 100% traceability and compliance and aim to cap input-cost variance to ±5% annually.
OEMs & Tier-1 integrators
Co-development with leading power supply, motor drive, EV, and inverter OEMs aligns NCE Power products to system requirements and drove design-ins across platforms as global EV sales reached about 14.5 million units in 2024; early engagement secures lifecycle value and multi-year volumes. Joint reliability testing accelerates certifications and shortens time-to-market.
- Co-dev: aligns system needs
- Early engagement: locks multi-year volumes
- Testing: speeds certifications
- 2024 EV sales: ~14.5M
Universities & research institutes
Academic partnerships drive device-physics, wide-bandgap and packaging advances while giving NCE Power access to specialized labs and talent; global R&D spending exceeded $2.5 trillion in 2024, underscoring available sponsored funding. Sponsored projects de-risk exploratory tech and accelerate milestones, and joint IP creation feeds the patent portfolio and licensing pipelines.
- Access to labs and talent
- Sponsored projects de-risk R&D
- Wide-bandgap & packaging innovation
- Co-created IP boosts patents
Wafer/OSAT scale, dual-sourcing and EDA alliances accelerate SiC and EV ramps
NCE Power secures wafer/OSAT capacity (SiC demand +30% YoY in 2024) and dual-sources to mitigate vendor risk; co-qualification accelerates volume ramps. EDA/OEM alliances (EDA market ~$14B in 2024) shorten design cycles. OEM/academic co-devs align products to EV volumes (~14.5M units in 2024) and expand IP/reliability.
| Partner | Role | 2024 Metric |
|---|---|---|
| Fabs/OSATs | Capacity & co-qual | SiC +30% YoY |
| EDA/OEMs | Tooling & capex | $14B market |
| OEMs/Academia | Co-dev & IP | EV 14.5M |
What is included in the product
Detailed Word Document
A comprehensive, pre-written Business Model Canvas for NCE Power that maps all 9 BMC blocks with detailed value propositions, channels and customer segments, includes SWOT and competitive insights, and is investor-ready for presentations and strategic planning.
Customizable Excel Spreadsheet
High-level view of NCE Power’s business model with editable cells that quickly identify core components and relieve strategic pain points for teams, saving hours of formatting and structuring your own model.
Activities
Power device R&D
NCE Power designs MOSFETs, IGBTs and SiC diodes optimized for efficiency, switching speed and robustness, targeting 40–1200V classes and currents to 600A. Core activities span TCAD modeling, layout and process integration; reliability engineering qualifies devices for 10-year lifetime at 125°C and >1e6 switching cycles. Roadmap development prioritizes voltage/current tiers aligned with 2024 SiC market expansion.
Wafer fabrication
Fab operations and managed foundry runs produce power dies with tight parametric control, covering implantation, trench/planar formation, metallization and passivation; SPC and yield engineering reduced cost per die, with 2024 industry averages showing >90% mature-process yields and continuous improvement programs delivering up to 20% throughput gains.
Packaging & testing
Advanced packaging (DFN, TO, modules) reduces thermal resistance and enables devices in 600–1200V classes with sub-10 mΩ Rds(on) for power modules. Final test screens leakage (<μA), breakdown voltage, Rds(on) and switching metrics. Burn-in (48–168 h) and AEC-Q (-40 to +150°C) ensure reliability. Test-data analytics drive targeted process fixes.
Applications engineering
Applications engineering: FAEs support customer design-ins with reference designs, SPICE models, and layout guidance; system-level validation in PSUs, drives, lighting and renewables ensures fit; troubleshooting shortens time-to-market; design notes and ANs scale global support. In 2024 the global power semiconductor market was about $64 billion, highlighting demand.
- FAE-led reference designs: quicker design-in
- SPICE/layout: reduce board respins
- System validation: ensures integration in PSUs/drives/lighting/renewables
- ANs/design notes: scale support globally
Quality & compliance
QMS activities enforce ISO 9001 and IATF 16949 controls, drive PPAP/APQP for all automotive launches, and ensure RoHS3 restrictions (10 substance groups) plus REACH compliance; failure analysis with RCA practices targets measurable RMA reduction and continuous corrective action. Supplier quality management and audits preserve part consistency, while lot-level traceability supports customer and regulatory audits.
- Standards: ISO 9001, IATF 16949
- Automotive: 100% PPAP/APQP for launches
- Compliance: RoHS3 (10 groups), REACH (Candidate List >200)
- Quality impact: RCA-driven RMA reduction
- Traceability: lot-level auditability
SiC MOSFETs & IGBTs: 1200V, 600A
NCE Power designs MOSFETs, IGBTs and SiC diodes (40–1200V, up to 600A) optimizing efficiency, switching speed and robustness. Core activities cover TCAD, layout, process integration and reliability engineering (10-year @125°C, >1e6 switching cycles) aligned to 2024 SiC market expansion. Fab, advanced packaging and test yield >90% mature-process, burn-in 48–168h; FAEs deliver SPICE, reference designs and system validation.
| Metric | 2024 Value |
|---|---|
| Global power semiconductor market | $64B |
| Mature-process yield | >90% |
| Throughput improvement | up to 20% |
| Module Rds(on) | <10 mΩ |
| Qualified lifetime | 10 y @125°C |
Delivered as Displayed
Business Model Canvas
The document previewed here is the actual NCE Power Business Model Canvas, not a mockup, and shows the exact structure and content you will receive. After purchase you’ll download this same professional file, fully editable and formatted for immediate use in Word and Excel. No placeholders, no surprises.
Description
Unlock the strategic Business Model Canvas for clean energy growth and investor insights
Unlock the full strategic blueprint behind NCE Power with our Business Model Canvas — a concise, actionable map of its value propositions, customer segments, and revenue levers. Ideal for investors, consultants, and founders, the complete canvas reveals growth drivers, cost structure, and partnership dynamics. Download the Word and Excel files to benchmark, adapt, and execute winning strategies today.
Partnerships
Wafer fabs & OSATs
NCE Power partners with silicon and SiC wafer fabs and OSATs to secure capacity, advanced nodes and cost efficiency, aligning supply with 2024 market growth (SiC demand up ~30% year-on-year). Joint planning synchronizes die sizes, yields and cycle times to forecasted demand. Strategic dual-sourcing mitigates single-vendor risk and ensures continuity. Co-qualification with fabs/OSATs accelerates new-product ramps into volume.
EDA & equipment vendors
Alliances with EDA tool providers and capital-equipment OEMs enable faster design iterations and process improvements, with the global EDA market reaching about $14 billion in 2024, reflecting strong investment in tooling. Access to foundry PDKs, validated device models and TCAD improves accuracy and can cut iterations and time-to-market materially. Early visibility into tool roadmaps guides capex and node-selection decisions, while joint development programs historically boost yield and reliability through co-optimized flows.
Materials & substrate suppliers
Relationships with silicon, SiC and packaging-materials suppliers secure quality, availability and price stability, with ~80% of wafer volumes under 12–36 month long-term agreements to lock in specs and lead times. Collaboration on new substrates and thermal interface materials targets 10–20% efficiency/thermal improvements. Supplier audits (ISO 9001/IATF 16949) ensure 100% traceability and compliance and aim to cap input-cost variance to ±5% annually.
OEMs & Tier-1 integrators
Co-development with leading power supply, motor drive, EV, and inverter OEMs aligns NCE Power products to system requirements and drove design-ins across platforms as global EV sales reached about 14.5 million units in 2024; early engagement secures lifecycle value and multi-year volumes. Joint reliability testing accelerates certifications and shortens time-to-market.
- Co-dev: aligns system needs
- Early engagement: locks multi-year volumes
- Testing: speeds certifications
- 2024 EV sales: ~14.5M
Universities & research institutes
Academic partnerships drive device-physics, wide-bandgap and packaging advances while giving NCE Power access to specialized labs and talent; global R&D spending exceeded $2.5 trillion in 2024, underscoring available sponsored funding. Sponsored projects de-risk exploratory tech and accelerate milestones, and joint IP creation feeds the patent portfolio and licensing pipelines.
- Access to labs and talent
- Sponsored projects de-risk R&D
- Wide-bandgap & packaging innovation
- Co-created IP boosts patents
Wafer/OSAT scale, dual-sourcing and EDA alliances accelerate SiC and EV ramps
NCE Power secures wafer/OSAT capacity (SiC demand +30% YoY in 2024) and dual-sources to mitigate vendor risk; co-qualification accelerates volume ramps. EDA/OEM alliances (EDA market ~$14B in 2024) shorten design cycles. OEM/academic co-devs align products to EV volumes (~14.5M units in 2024) and expand IP/reliability.
| Partner | Role | 2024 Metric |
|---|---|---|
| Fabs/OSATs | Capacity & co-qual | SiC +30% YoY |
| EDA/OEMs | Tooling & capex | $14B market |
| OEMs/Academia | Co-dev & IP | EV 14.5M |
What is included in the product
Detailed Word Document
A comprehensive, pre-written Business Model Canvas for NCE Power that maps all 9 BMC blocks with detailed value propositions, channels and customer segments, includes SWOT and competitive insights, and is investor-ready for presentations and strategic planning.
Customizable Excel Spreadsheet
High-level view of NCE Power’s business model with editable cells that quickly identify core components and relieve strategic pain points for teams, saving hours of formatting and structuring your own model.
Activities
Power device R&D
NCE Power designs MOSFETs, IGBTs and SiC diodes optimized for efficiency, switching speed and robustness, targeting 40–1200V classes and currents to 600A. Core activities span TCAD modeling, layout and process integration; reliability engineering qualifies devices for 10-year lifetime at 125°C and >1e6 switching cycles. Roadmap development prioritizes voltage/current tiers aligned with 2024 SiC market expansion.
Wafer fabrication
Fab operations and managed foundry runs produce power dies with tight parametric control, covering implantation, trench/planar formation, metallization and passivation; SPC and yield engineering reduced cost per die, with 2024 industry averages showing >90% mature-process yields and continuous improvement programs delivering up to 20% throughput gains.
Packaging & testing
Advanced packaging (DFN, TO, modules) reduces thermal resistance and enables devices in 600–1200V classes with sub-10 mΩ Rds(on) for power modules. Final test screens leakage (<μA), breakdown voltage, Rds(on) and switching metrics. Burn-in (48–168 h) and AEC-Q (-40 to +150°C) ensure reliability. Test-data analytics drive targeted process fixes.
Applications engineering
Applications engineering: FAEs support customer design-ins with reference designs, SPICE models, and layout guidance; system-level validation in PSUs, drives, lighting and renewables ensures fit; troubleshooting shortens time-to-market; design notes and ANs scale global support. In 2024 the global power semiconductor market was about $64 billion, highlighting demand.
- FAE-led reference designs: quicker design-in
- SPICE/layout: reduce board respins
- System validation: ensures integration in PSUs/drives/lighting/renewables
- ANs/design notes: scale support globally
Quality & compliance
QMS activities enforce ISO 9001 and IATF 16949 controls, drive PPAP/APQP for all automotive launches, and ensure RoHS3 restrictions (10 substance groups) plus REACH compliance; failure analysis with RCA practices targets measurable RMA reduction and continuous corrective action. Supplier quality management and audits preserve part consistency, while lot-level traceability supports customer and regulatory audits.
- Standards: ISO 9001, IATF 16949
- Automotive: 100% PPAP/APQP for launches
- Compliance: RoHS3 (10 groups), REACH (Candidate List >200)
- Quality impact: RCA-driven RMA reduction
- Traceability: lot-level auditability
SiC MOSFETs & IGBTs: 1200V, 600A
NCE Power designs MOSFETs, IGBTs and SiC diodes (40–1200V, up to 600A) optimizing efficiency, switching speed and robustness. Core activities cover TCAD, layout, process integration and reliability engineering (10-year @125°C, >1e6 switching cycles) aligned to 2024 SiC market expansion. Fab, advanced packaging and test yield >90% mature-process, burn-in 48–168h; FAEs deliver SPICE, reference designs and system validation.
| Metric | 2024 Value |
|---|---|
| Global power semiconductor market | $64B |
| Mature-process yield | >90% |
| Throughput improvement | up to 20% |
| Module Rds(on) | <10 mΩ |
| Qualified lifetime | 10 y @125°C |
Delivered as Displayed
Business Model Canvas
The document previewed here is the actual NCE Power Business Model Canvas, not a mockup, and shows the exact structure and content you will receive. After purchase you’ll download this same professional file, fully editable and formatted for immediate use in Word and Excel. No placeholders, no surprises.











