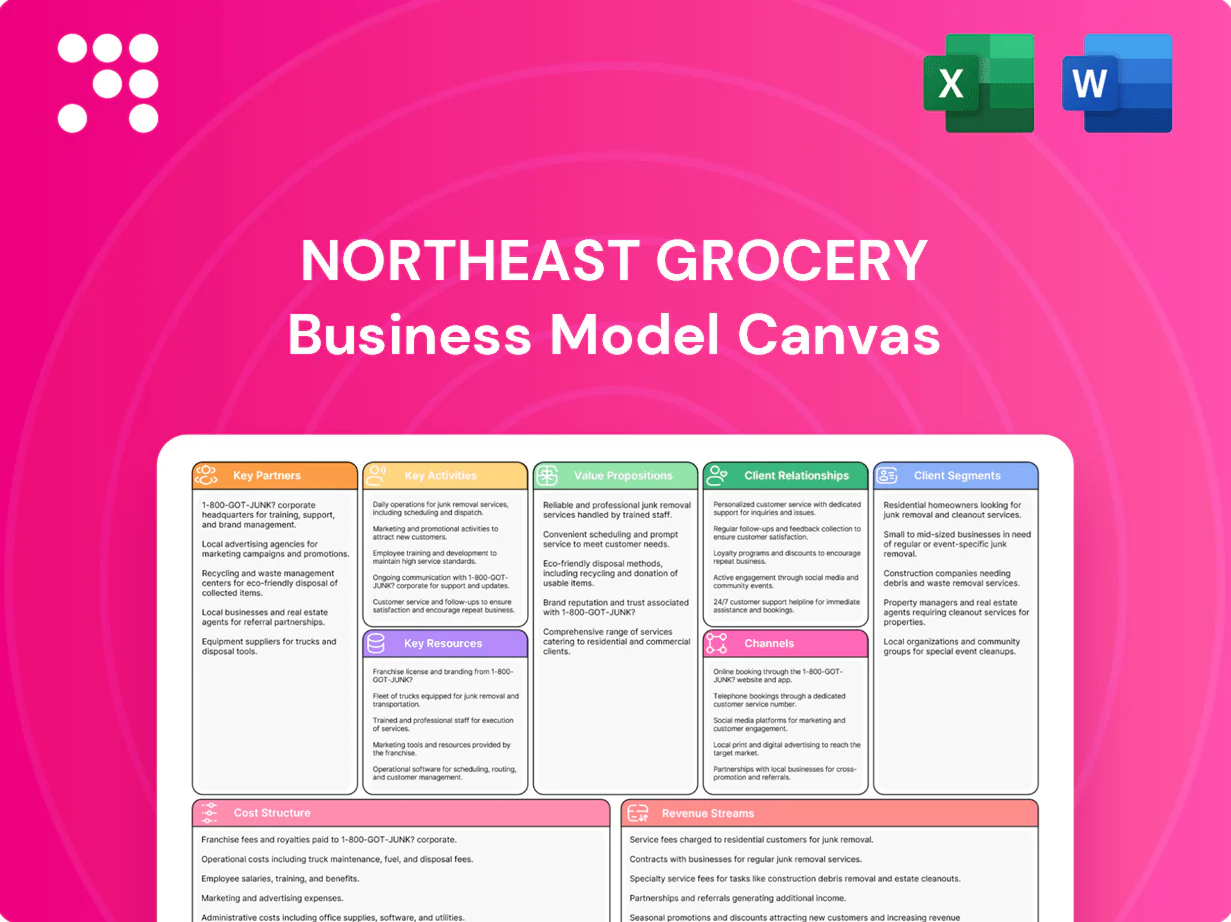
Northeast Grocery Business Model Canvas

Business Model Canvas: Supermarket Growth, Channels & Revenue Levers
Unlock the full strategic blueprint behind Northeast Grocery with our Business Model Canvas—three pages of actionable insight showing value propositions, customer segments, channels, and revenue levers. Ideal for investors, entrepreneurs, and analysts aiming to benchmark or scale. Download the editable Word & Excel files to apply these strategies today.
Partnerships

National CPG suppliers
Strategic supply agreements with national CPG brands secure broad assortments, reliable in-store availability and promotional funding that can represent up to 12% of category sell-through in 2024. Partners co-plan assortments and trade promos across Price Chopper/Market 32 and Tops, while joint forecasting and vendor-managed inventory have lowered stockouts by ~25% and reduced working capital needs by ~12%.
Local farms and regional producers
Direct relationships with Northeast growers and artisans deliver fresher produce and differentiated local SKUs, supporting seasonal programs and co-branded promotions that 68% of regional shoppers said increased perceived quality in a 2024 consumer survey.
Shorter supply chains cut transit time to 1–2 days for many items versus national averages, reducing spoilage and shrinking logistics costs by roughly 10–15% for fresh categories in 2024 retailer case studies.

Logistics and last-mile providers
Third-party carriers and delivery platforms extend store replenishment and e-commerce reach across the Northeast, supporting a grocery e-commerce channel that reached about 12% of US grocery sales in 2024; flexible capacity scales for peak demand and weather disruptions, while binding service-level agreements enforce temperature controls and on-time delivery to protect freshness.

Technology and payment platforms
- POS integration: real-time inventory and unified cart
- Payments: secure, PCI-compliant gateways, lower AOV friction
- Loyalty/analytics: personalization increases repeat rate
Healthcare and pharmacy partners
- Wholesalers: reliable supply, bulk pricing
- Insurers: reimbursement, patient access
- Clinics: in-store services, traffic lift
- Compliance: risk mitigation, audit readiness
Promos up 12%; stockouts -25%; local quality 68%
Strategic CPG deals fund promotions up to 12% of category sell-through in 2024; joint forecasting/VMI cut stockouts ~25% and working capital ~12%. Northeast growers supplied local SKUs that 68% of regional shoppers cited as higher quality in 2024 surveys. Shorter supply chains trimmed fresh logistics costs ~10–15% and e-commerce reached ~12% of US grocery sales in 2024; pharmacy retail was ~$400B.
| Metric | 2024 Value |
|---|---|
| Promo funding (% sell-through) | 12% |
| Stockout reduction | ~25% |
| Working capital reduction | ~12% |
| Local SKU quality lift (survey) | 68% |
| Fresh logistics savings | 10–15% |
| US grocery e‑commerce share | ~12% |
| US pharmacy retail sales | $400B |
What is included in the product
 Detailed Word Document
A comprehensive, pre-written Business Model Canvas tailored to Northeast Grocery’s strategy, covering customer segments, channels, value propositions and revenue streams across the 9 classic BMC blocks. Includes competitive-analysis insights, linked SWOT, operational KPIs and polished narrative for presentations, investor diligence and strategic planning.

 Customizable Excel Spreadsheet
High-level view of Northeast Grocery’s business model with editable cells, relieving pain by condensing strategy, supply-chain and margin drivers into a single, shareable page for faster decisions, team alignment, and board-ready presentations.
Activities

Merchandising and assortment optimization
Curating national brands, private label (≈15–20% share in US grocery 2024) and local items to match neighborhood demand drives basket relevance and loyalty. Rigorous planograms, space management and seasonal sets typically lift sales per square foot by 5–10%, pushing benchmarks toward roughly $550/sq ft in 2024. Data-driven SKU reviews and gross-margin-based churn remove underperformers and boost category yield.
Supply chain and fresh execution
Forecasting, replenishment and cold-chain management keep shelves full and safe, cutting spoilage that contributes to roughly 30–40% of U.S. food waste (USDA estimate). Cross-dock and DC operations balance cost and speed to support same-day freshness and lower handling costs. Tight waste control in perishables protects thin supermarket net margins near 1–2% (industry 2024 average).

Omni-channel retailing
Operating in-store, curbside pickup and delivery adds convenience and captured rising demand as US online grocery sales reached an estimated $131 billion in 2024, with omnichannel households showing higher basket sizes. Order picking accuracy, smart substitutions and dynamic time-slot management directly affect NPS and repeat rates. Continuous UX optimization on apps and sites—reducing checkouts and load times—drives repeat use and increases digital share of wallet.

Pricing, promotions, and loyalty
- Everyday pricing: value and frequency
- Weekly circulars: awareness and traffic
- Digital coupons: targeted lift
- Vendor-funded offers: ~20% promo spend
- Price-zone: local competitive alignment
Private label development
- Margins: 2–6 pp advantage
- Penetration: ~18% (2023–24)
- Tiers: value / core / premium
- Focus: sourcing, QA, packaging, storytelling
Omnichannel grocery: optimize private-label and space to hit $550/sqft, cut 30–40% waste
Merchandising national, private-label (~18% penetration 2023–24) and local SKUs drives basket relevance; planogram and space mgmt lift sales/sqft to ≈$550 (2024). Tight forecasting, cold-chain and DC ops cut spoilage (USDA 30–40% food waste) and protect thin net margins (~1–2%). Omnichannel (online grocery $131B 2024) plus pricing, promos and loyalty (>50% txn) boost frequency and AOV.
| Metric | Value (2024) |
|---|---|
| Sales / sqft | $550 |
| Private label | ~18% |
| Online grocery | $131B |
| Food waste | 30–40% |
| Net margin | 1–2% |
| Vendor-funded promo | ~20% |
| Loyalty txn share | >50% |
What You See Is What You Get
Business Model Canvas
The document you're previewing is the exact Northeast Grocery Business Model Canvas you'll receive—it's not a mockup or sample. On purchase you get the same complete, editable file formatted for immediate use, ready for presentation or customization. No hidden content or filler: what you see is what you'll download.

Business Model Canvas: Supermarket Growth, Channels & Revenue Levers
Unlock the full strategic blueprint behind Northeast Grocery with our Business Model Canvas—three pages of actionable insight showing value propositions, customer segments, channels, and revenue levers. Ideal for investors, entrepreneurs, and analysts aiming to benchmark or scale. Download the editable Word & Excel files to apply these strategies today.
Partnerships
National CPG suppliers
Strategic supply agreements with national CPG brands secure broad assortments, reliable in-store availability and promotional funding that can represent up to 12% of category sell-through in 2024. Partners co-plan assortments and trade promos across Price Chopper/Market 32 and Tops, while joint forecasting and vendor-managed inventory have lowered stockouts by ~25% and reduced working capital needs by ~12%.
Local farms and regional producers
Direct relationships with Northeast growers and artisans deliver fresher produce and differentiated local SKUs, supporting seasonal programs and co-branded promotions that 68% of regional shoppers said increased perceived quality in a 2024 consumer survey.
Shorter supply chains cut transit time to 1–2 days for many items versus national averages, reducing spoilage and shrinking logistics costs by roughly 10–15% for fresh categories in 2024 retailer case studies.
Logistics and last-mile providers
Third-party carriers and delivery platforms extend store replenishment and e-commerce reach across the Northeast, supporting a grocery e-commerce channel that reached about 12% of US grocery sales in 2024; flexible capacity scales for peak demand and weather disruptions, while binding service-level agreements enforce temperature controls and on-time delivery to protect freshness.
Technology and payment platforms
- POS integration: real-time inventory and unified cart
- Payments: secure, PCI-compliant gateways, lower AOV friction
- Loyalty/analytics: personalization increases repeat rate
Healthcare and pharmacy partners
- Wholesalers: reliable supply, bulk pricing
- Insurers: reimbursement, patient access
- Clinics: in-store services, traffic lift
- Compliance: risk mitigation, audit readiness
Promos up 12%; stockouts -25%; local quality 68%
Strategic CPG deals fund promotions up to 12% of category sell-through in 2024; joint forecasting/VMI cut stockouts ~25% and working capital ~12%. Northeast growers supplied local SKUs that 68% of regional shoppers cited as higher quality in 2024 surveys. Shorter supply chains trimmed fresh logistics costs ~10–15% and e-commerce reached ~12% of US grocery sales in 2024; pharmacy retail was ~$400B.
| Metric | 2024 Value |
|---|---|
| Promo funding (% sell-through) | 12% |
| Stockout reduction | ~25% |
| Working capital reduction | ~12% |
| Local SKU quality lift (survey) | 68% |
| Fresh logistics savings | 10–15% |
| US grocery e‑commerce share | ~12% |
| US pharmacy retail sales | $400B |
What is included in the product
Detailed Word Document
A comprehensive, pre-written Business Model Canvas tailored to Northeast Grocery’s strategy, covering customer segments, channels, value propositions and revenue streams across the 9 classic BMC blocks. Includes competitive-analysis insights, linked SWOT, operational KPIs and polished narrative for presentations, investor diligence and strategic planning.
Customizable Excel Spreadsheet
High-level view of Northeast Grocery’s business model with editable cells, relieving pain by condensing strategy, supply-chain and margin drivers into a single, shareable page for faster decisions, team alignment, and board-ready presentations.
Activities
Merchandising and assortment optimization
Curating national brands, private label (≈15–20% share in US grocery 2024) and local items to match neighborhood demand drives basket relevance and loyalty. Rigorous planograms, space management and seasonal sets typically lift sales per square foot by 5–10%, pushing benchmarks toward roughly $550/sq ft in 2024. Data-driven SKU reviews and gross-margin-based churn remove underperformers and boost category yield.
Supply chain and fresh execution
Forecasting, replenishment and cold-chain management keep shelves full and safe, cutting spoilage that contributes to roughly 30–40% of U.S. food waste (USDA estimate). Cross-dock and DC operations balance cost and speed to support same-day freshness and lower handling costs. Tight waste control in perishables protects thin supermarket net margins near 1–2% (industry 2024 average).
Omni-channel retailing
Operating in-store, curbside pickup and delivery adds convenience and captured rising demand as US online grocery sales reached an estimated $131 billion in 2024, with omnichannel households showing higher basket sizes. Order picking accuracy, smart substitutions and dynamic time-slot management directly affect NPS and repeat rates. Continuous UX optimization on apps and sites—reducing checkouts and load times—drives repeat use and increases digital share of wallet.
Pricing, promotions, and loyalty
- Everyday pricing: value and frequency
- Weekly circulars: awareness and traffic
- Digital coupons: targeted lift
- Vendor-funded offers: ~20% promo spend
- Price-zone: local competitive alignment
Private label development
- Margins: 2–6 pp advantage
- Penetration: ~18% (2023–24)
- Tiers: value / core / premium
- Focus: sourcing, QA, packaging, storytelling
Omnichannel grocery: optimize private-label and space to hit $550/sqft, cut 30–40% waste
Merchandising national, private-label (~18% penetration 2023–24) and local SKUs drives basket relevance; planogram and space mgmt lift sales/sqft to ≈$550 (2024). Tight forecasting, cold-chain and DC ops cut spoilage (USDA 30–40% food waste) and protect thin net margins (~1–2%). Omnichannel (online grocery $131B 2024) plus pricing, promos and loyalty (>50% txn) boost frequency and AOV.
| Metric | Value (2024) |
|---|---|
| Sales / sqft | $550 |
| Private label | ~18% |
| Online grocery | $131B |
| Food waste | 30–40% |
| Net margin | 1–2% |
| Vendor-funded promo | ~20% |
| Loyalty txn share | >50% |
What You See Is What You Get
Business Model Canvas
The document you're previewing is the exact Northeast Grocery Business Model Canvas you'll receive—it's not a mockup or sample. On purchase you get the same complete, editable file formatted for immediate use, ready for presentation or customization. No hidden content or filler: what you see is what you'll download.
Description
Business Model Canvas: Supermarket Growth, Channels & Revenue Levers
Unlock the full strategic blueprint behind Northeast Grocery with our Business Model Canvas—three pages of actionable insight showing value propositions, customer segments, channels, and revenue levers. Ideal for investors, entrepreneurs, and analysts aiming to benchmark or scale. Download the editable Word & Excel files to apply these strategies today.
Partnerships
National CPG suppliers
Strategic supply agreements with national CPG brands secure broad assortments, reliable in-store availability and promotional funding that can represent up to 12% of category sell-through in 2024. Partners co-plan assortments and trade promos across Price Chopper/Market 32 and Tops, while joint forecasting and vendor-managed inventory have lowered stockouts by ~25% and reduced working capital needs by ~12%.
Local farms and regional producers
Direct relationships with Northeast growers and artisans deliver fresher produce and differentiated local SKUs, supporting seasonal programs and co-branded promotions that 68% of regional shoppers said increased perceived quality in a 2024 consumer survey.
Shorter supply chains cut transit time to 1–2 days for many items versus national averages, reducing spoilage and shrinking logistics costs by roughly 10–15% for fresh categories in 2024 retailer case studies.
Logistics and last-mile providers
Third-party carriers and delivery platforms extend store replenishment and e-commerce reach across the Northeast, supporting a grocery e-commerce channel that reached about 12% of US grocery sales in 2024; flexible capacity scales for peak demand and weather disruptions, while binding service-level agreements enforce temperature controls and on-time delivery to protect freshness.
Technology and payment platforms
- POS integration: real-time inventory and unified cart
- Payments: secure, PCI-compliant gateways, lower AOV friction
- Loyalty/analytics: personalization increases repeat rate
Healthcare and pharmacy partners
- Wholesalers: reliable supply, bulk pricing
- Insurers: reimbursement, patient access
- Clinics: in-store services, traffic lift
- Compliance: risk mitigation, audit readiness
Promos up 12%; stockouts -25%; local quality 68%
Strategic CPG deals fund promotions up to 12% of category sell-through in 2024; joint forecasting/VMI cut stockouts ~25% and working capital ~12%. Northeast growers supplied local SKUs that 68% of regional shoppers cited as higher quality in 2024 surveys. Shorter supply chains trimmed fresh logistics costs ~10–15% and e-commerce reached ~12% of US grocery sales in 2024; pharmacy retail was ~$400B.
| Metric | 2024 Value |
|---|---|
| Promo funding (% sell-through) | 12% |
| Stockout reduction | ~25% |
| Working capital reduction | ~12% |
| Local SKU quality lift (survey) | 68% |
| Fresh logistics savings | 10–15% |
| US grocery e‑commerce share | ~12% |
| US pharmacy retail sales | $400B |
What is included in the product
Detailed Word Document
A comprehensive, pre-written Business Model Canvas tailored to Northeast Grocery’s strategy, covering customer segments, channels, value propositions and revenue streams across the 9 classic BMC blocks. Includes competitive-analysis insights, linked SWOT, operational KPIs and polished narrative for presentations, investor diligence and strategic planning.
Customizable Excel Spreadsheet
High-level view of Northeast Grocery’s business model with editable cells, relieving pain by condensing strategy, supply-chain and margin drivers into a single, shareable page for faster decisions, team alignment, and board-ready presentations.
Activities
Merchandising and assortment optimization
Curating national brands, private label (≈15–20% share in US grocery 2024) and local items to match neighborhood demand drives basket relevance and loyalty. Rigorous planograms, space management and seasonal sets typically lift sales per square foot by 5–10%, pushing benchmarks toward roughly $550/sq ft in 2024. Data-driven SKU reviews and gross-margin-based churn remove underperformers and boost category yield.
Supply chain and fresh execution
Forecasting, replenishment and cold-chain management keep shelves full and safe, cutting spoilage that contributes to roughly 30–40% of U.S. food waste (USDA estimate). Cross-dock and DC operations balance cost and speed to support same-day freshness and lower handling costs. Tight waste control in perishables protects thin supermarket net margins near 1–2% (industry 2024 average).
Omni-channel retailing
Operating in-store, curbside pickup and delivery adds convenience and captured rising demand as US online grocery sales reached an estimated $131 billion in 2024, with omnichannel households showing higher basket sizes. Order picking accuracy, smart substitutions and dynamic time-slot management directly affect NPS and repeat rates. Continuous UX optimization on apps and sites—reducing checkouts and load times—drives repeat use and increases digital share of wallet.
Pricing, promotions, and loyalty
- Everyday pricing: value and frequency
- Weekly circulars: awareness and traffic
- Digital coupons: targeted lift
- Vendor-funded offers: ~20% promo spend
- Price-zone: local competitive alignment
Private label development
- Margins: 2–6 pp advantage
- Penetration: ~18% (2023–24)
- Tiers: value / core / premium
- Focus: sourcing, QA, packaging, storytelling
Omnichannel grocery: optimize private-label and space to hit $550/sqft, cut 30–40% waste
Merchandising national, private-label (~18% penetration 2023–24) and local SKUs drives basket relevance; planogram and space mgmt lift sales/sqft to ≈$550 (2024). Tight forecasting, cold-chain and DC ops cut spoilage (USDA 30–40% food waste) and protect thin net margins (~1–2%). Omnichannel (online grocery $131B 2024) plus pricing, promos and loyalty (>50% txn) boost frequency and AOV.
| Metric | Value (2024) |
|---|---|
| Sales / sqft | $550 |
| Private label | ~18% |
| Online grocery | $131B |
| Food waste | 30–40% |
| Net margin | 1–2% |
| Vendor-funded promo | ~20% |
| Loyalty txn share | >50% |
What You See Is What You Get
Business Model Canvas
The document you're previewing is the exact Northeast Grocery Business Model Canvas you'll receive—it's not a mockup or sample. On purchase you get the same complete, editable file formatted for immediate use, ready for presentation or customization. No hidden content or filler: what you see is what you'll download.











