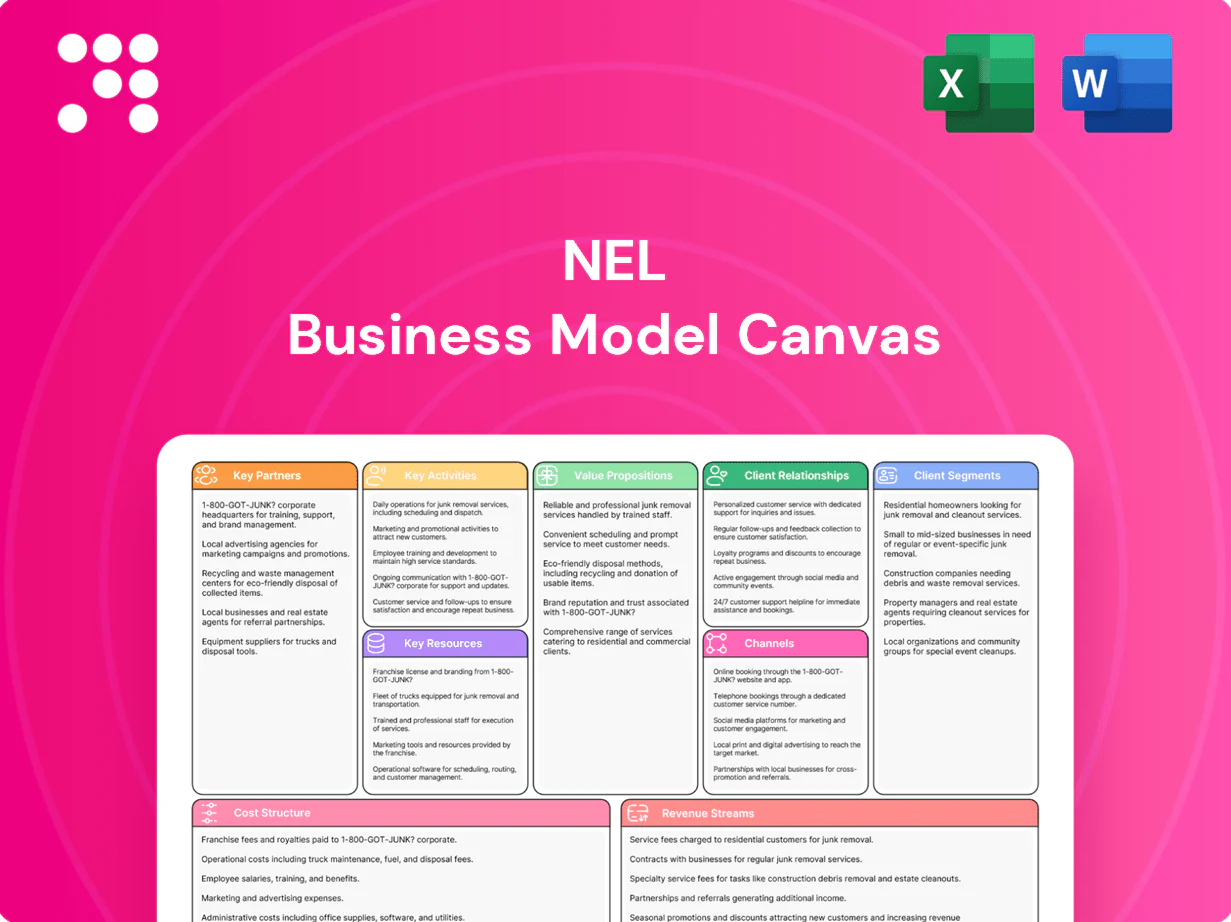
NEL Business Model Canvas

Unlock strategic Business Model Canvas: map value, scale operations, capture market share
Unlock NEL's strategic blueprint with our Business Model Canvas—showing how the company creates value, scales operations, and captures market share. This concise, company-specific canvas maps customer segments, revenue streams, key partners and costs. Download the full Word/Excel file to benchmark, plan strategy, or prepare investor-ready analysis.
Partnerships

Renewable power developers
Partner with wind and solar IPPs to secure bankable green PPAs (sub-40 USD/MWh in favorable 2024 markets) to feed electrolysers (~50 kWh/kg H2), align project timelines so plant ramp-up matches seasonal renewable profiles, co-develop co-located sites to cut transmission losses (typically 3–8%) and grid fees, and jointly pursue incentives and long-term offtakes to de-risk capital.
Industrial gas and energy majors
Collaborate with industrial gas and energy majors on project financing, EPC execution and global rollout, leveraging a 2024 announced clean-hydrogen project pipeline exceeding 200 GW to scale deployments. Use majors’ distribution networks, safety practices and customer access to accelerate market entry. Form JVs for large hydrogen hubs and pipeline blending. Share O&M capabilities to meet uptime and performance guarantees.

OEMs and mobility integrators
Partner with OEMs such as Toyota and Hyundai in 2024 to standardize fueling protocols across fuel cell cars, buses and trucks, reducing integration time and warranty friction.
Coordinate station design for high-throughput, high-availability operations, aligning dispenser specs and communications to support continuous fleet refueling cycles.
Pilot depot projects with fleet operators to validate total cost of ownership and uptime under real-world duty cycles, capturing operational metrics for scale-up.
Co-market integrated vehicle-plus-infrastructure solutions with OEMs and integrators to accelerate fleet adoption and commercial deployment in 2024 markets.

Policy bodies and research institutions
Engage standards bodies to influence codes, permitting, and safety frameworks; partner with universities on advanced materials, stacks, and controls; join demonstration programs to validate bankability; and leverage grants to lower innovation and scale-up risk—noting Horizon Europe’s €95.5 billion program and the US BIL’s $8 billion Clean Hydrogen Hubs funding (2024) as relevant funding pools.
- Standards: codes & permitting
- Academia: materials, stacks, controls
- Demo: bankability validation
- Grants: Horizon Europe €95.5B; US BIL $8B
EPCs and supply chain vendors
Secure reliable suppliers for stacks, power electronics, compressors and storage through long-term qualified agreements with tiered traceability and HSE audits; align EPCs on modularization and repeatable delivery to shorten site schedules and improve unit economics; implement cross-tier quality, HSE and traceability systems; negotiate volume contracts to lower costs and compress lead times.
- Supply security
- Modular EPC delivery
- Cross-tier quality & HSE
- Volume pricing & lead-time reduction
Scale clean H2 with sub-40 USD/MWh PPAs and ~50 kWh/kg electrolysers
Partner with wind/solar IPPs for bankable PPAs (sub-40 USD/MWh in 2024) to feed electrolysers (~50 kWh/kg H2), co-develop co-located sites to cut 3–8% transmission losses; JV with majors to scale (2024 clean-H2 pipeline >200 GW); align OEMs for fueling standards; secure suppliers and grants (Horizon €95.5B; US BIL $8B).
| Item | Key |
|---|---|
| PPA price | sub-40 USD/MWh |
| Electrolyser | ~50 kWh/kg |
| Pipeline | >200 GW (2024) |
What is included in the product
 Detailed Word Document
A comprehensive NEL Business Model Canvas aligned to the company’s strategy, covering customer segments, channels, value propositions and revenue streams across the 9 classic BMC blocks with narratives and insights.

 Customizable Excel Spreadsheet
High-level, editable snapshot that removes setup friction by condensing the company’s strategy into shareable cells for fast collaboration, executive summaries, and side-by-side comparisons.
Activities

Electrolyzer design and manufacturing
Develop PEM and alkaline systems optimized for efficiency and durability, leveraging modular stack designs and materials common to industry leaders. Scale automated production to gigawatt-scale output (>1 GW/year) through robotics and lean manufacturing. Conduct rigorous testing and certification to IEC standards and DNV approvals. Implement continuous improvement programs focused on cost-down and yield via SPC and automated process control.
Hydrogen station engineering and deployment
Design, build and commission compression, storage and dispensing solutions tailored to 350 and 700 bar refueling standards, following ISO 19880-1 (gas fueling stations) requirements updated through 2024. Layouts are optimized for high-throughput fleet refueling and safe storage sizing, with permitting and formal safety case submissions managed end-to-end. Deliver turnkey EPC contracts with site acceptance testing (SAT) to certify operational readiness.

Project development and integration
Perform techno‑economic modeling and sizing for 50–100 MW projects using 2024 benchmarks (electrolyzer CAPEX ~800 USD/kW; best‑case LCOH ~2.5 USD/kg) to stress test feasibility and returns. Integrate with renewables (capacity factors 25–40%), grid, water treatment and thermal management for round‑trip efficiency and curtailment mitigation. Structure PPAs, offtake and service agreements to support 70% debt project financing with 10–15 year tenors. Coordinate lenders, insurers, grid operators and local authorities through typical 12–24 month permitting and interconnection processes.

Aftermarket service and asset management
Aftermarket service and asset management at NEL provides preventive and corrective maintenance with guaranteed response times, 24/7 remote diagnostics and data analytics to monitor fleets and predict failures, spares logistics and field service teams to maximize uptime, plus performance guarantees and software/firmware updates as of 2024 to support long-term asset performance.
- Guaranteed response times
- 24/7 remote diagnostics
- Spares logistics & field teams
- Performance guarantees & updates
R&D and product roadmap execution
R&D focuses on advancing stack materials, catalysts and balance-of-plant efficiency while validating new modular formats in 2024 pilots before full rollout; efforts aim to lower CAPEX and OPEX through standardization and repeatable manufacturing. Concurrent work secures IP and ensures compliance with evolving global standards and certification regimes.
- R&D
- Modularization
- Pilots 2024
- CAPEX/OPEX reduction
- IP & standards
Scale automated PEM/alkaline stacks >1 GW/yr; turnkey 350/700 bar H2
Develop and manufacture PEM/alkaline stacks at >1 GW/year scale with automated lines (electrolyzer CAPEX ~800 USD/kW, target cost-down 2024). Deliver turnkey H2 stations (350/700 bar) with EPC, SAT and ISO/IEC/DNV certifications. Provide 24/7 remote diagnostics, spare logistics, SLA response times and asset management to maximize uptime.
| Metric | 2024 Value |
|---|---|
| Electrolyzer CAPEX | ~800 USD/kW |
| Scale | >1 GW/yr |
| LCOH best case | ~2.5 USD/kg |
| Project size | 50–100 MW |
Preview Before You Purchase
Business Model Canvas
The NEL Business Model Canvas you’re previewing is the exact document you’ll receive—no mockup or demo—presented as a live snapshot of the final deliverable. When you purchase, you’ll download the same complete, editable file ready for presentation and customization. Designed for immediate use in Word and Excel, it includes all content and sections shown.

Unlock strategic Business Model Canvas: map value, scale operations, capture market share
Unlock NEL's strategic blueprint with our Business Model Canvas—showing how the company creates value, scales operations, and captures market share. This concise, company-specific canvas maps customer segments, revenue streams, key partners and costs. Download the full Word/Excel file to benchmark, plan strategy, or prepare investor-ready analysis.
Partnerships
Renewable power developers
Partner with wind and solar IPPs to secure bankable green PPAs (sub-40 USD/MWh in favorable 2024 markets) to feed electrolysers (~50 kWh/kg H2), align project timelines so plant ramp-up matches seasonal renewable profiles, co-develop co-located sites to cut transmission losses (typically 3–8%) and grid fees, and jointly pursue incentives and long-term offtakes to de-risk capital.
Industrial gas and energy majors
Collaborate with industrial gas and energy majors on project financing, EPC execution and global rollout, leveraging a 2024 announced clean-hydrogen project pipeline exceeding 200 GW to scale deployments. Use majors’ distribution networks, safety practices and customer access to accelerate market entry. Form JVs for large hydrogen hubs and pipeline blending. Share O&M capabilities to meet uptime and performance guarantees.
OEMs and mobility integrators
Partner with OEMs such as Toyota and Hyundai in 2024 to standardize fueling protocols across fuel cell cars, buses and trucks, reducing integration time and warranty friction.
Coordinate station design for high-throughput, high-availability operations, aligning dispenser specs and communications to support continuous fleet refueling cycles.
Pilot depot projects with fleet operators to validate total cost of ownership and uptime under real-world duty cycles, capturing operational metrics for scale-up.
Co-market integrated vehicle-plus-infrastructure solutions with OEMs and integrators to accelerate fleet adoption and commercial deployment in 2024 markets.
Policy bodies and research institutions
Engage standards bodies to influence codes, permitting, and safety frameworks; partner with universities on advanced materials, stacks, and controls; join demonstration programs to validate bankability; and leverage grants to lower innovation and scale-up risk—noting Horizon Europe’s €95.5 billion program and the US BIL’s $8 billion Clean Hydrogen Hubs funding (2024) as relevant funding pools.
- Standards: codes & permitting
- Academia: materials, stacks, controls
- Demo: bankability validation
- Grants: Horizon Europe €95.5B; US BIL $8B
EPCs and supply chain vendors
Secure reliable suppliers for stacks, power electronics, compressors and storage through long-term qualified agreements with tiered traceability and HSE audits; align EPCs on modularization and repeatable delivery to shorten site schedules and improve unit economics; implement cross-tier quality, HSE and traceability systems; negotiate volume contracts to lower costs and compress lead times.
- Supply security
- Modular EPC delivery
- Cross-tier quality & HSE
- Volume pricing & lead-time reduction
Scale clean H2 with sub-40 USD/MWh PPAs and ~50 kWh/kg electrolysers
Partner with wind/solar IPPs for bankable PPAs (sub-40 USD/MWh in 2024) to feed electrolysers (~50 kWh/kg H2), co-develop co-located sites to cut 3–8% transmission losses; JV with majors to scale (2024 clean-H2 pipeline >200 GW); align OEMs for fueling standards; secure suppliers and grants (Horizon €95.5B; US BIL $8B).
| Item | Key |
|---|---|
| PPA price | sub-40 USD/MWh |
| Electrolyser | ~50 kWh/kg |
| Pipeline | >200 GW (2024) |
What is included in the product
Detailed Word Document
A comprehensive NEL Business Model Canvas aligned to the company’s strategy, covering customer segments, channels, value propositions and revenue streams across the 9 classic BMC blocks with narratives and insights.
Customizable Excel Spreadsheet
High-level, editable snapshot that removes setup friction by condensing the company’s strategy into shareable cells for fast collaboration, executive summaries, and side-by-side comparisons.
Activities
Electrolyzer design and manufacturing
Develop PEM and alkaline systems optimized for efficiency and durability, leveraging modular stack designs and materials common to industry leaders. Scale automated production to gigawatt-scale output (>1 GW/year) through robotics and lean manufacturing. Conduct rigorous testing and certification to IEC standards and DNV approvals. Implement continuous improvement programs focused on cost-down and yield via SPC and automated process control.
Hydrogen station engineering and deployment
Design, build and commission compression, storage and dispensing solutions tailored to 350 and 700 bar refueling standards, following ISO 19880-1 (gas fueling stations) requirements updated through 2024. Layouts are optimized for high-throughput fleet refueling and safe storage sizing, with permitting and formal safety case submissions managed end-to-end. Deliver turnkey EPC contracts with site acceptance testing (SAT) to certify operational readiness.
Project development and integration
Perform techno‑economic modeling and sizing for 50–100 MW projects using 2024 benchmarks (electrolyzer CAPEX ~800 USD/kW; best‑case LCOH ~2.5 USD/kg) to stress test feasibility and returns. Integrate with renewables (capacity factors 25–40%), grid, water treatment and thermal management for round‑trip efficiency and curtailment mitigation. Structure PPAs, offtake and service agreements to support 70% debt project financing with 10–15 year tenors. Coordinate lenders, insurers, grid operators and local authorities through typical 12–24 month permitting and interconnection processes.
Aftermarket service and asset management
Aftermarket service and asset management at NEL provides preventive and corrective maintenance with guaranteed response times, 24/7 remote diagnostics and data analytics to monitor fleets and predict failures, spares logistics and field service teams to maximize uptime, plus performance guarantees and software/firmware updates as of 2024 to support long-term asset performance.
- Guaranteed response times
- 24/7 remote diagnostics
- Spares logistics & field teams
- Performance guarantees & updates
R&D and product roadmap execution
R&D focuses on advancing stack materials, catalysts and balance-of-plant efficiency while validating new modular formats in 2024 pilots before full rollout; efforts aim to lower CAPEX and OPEX through standardization and repeatable manufacturing. Concurrent work secures IP and ensures compliance with evolving global standards and certification regimes.
- R&D
- Modularization
- Pilots 2024
- CAPEX/OPEX reduction
- IP & standards
Scale automated PEM/alkaline stacks >1 GW/yr; turnkey 350/700 bar H2
Develop and manufacture PEM/alkaline stacks at >1 GW/year scale with automated lines (electrolyzer CAPEX ~800 USD/kW, target cost-down 2024). Deliver turnkey H2 stations (350/700 bar) with EPC, SAT and ISO/IEC/DNV certifications. Provide 24/7 remote diagnostics, spare logistics, SLA response times and asset management to maximize uptime.
| Metric | 2024 Value |
|---|---|
| Electrolyzer CAPEX | ~800 USD/kW |
| Scale | >1 GW/yr |
| LCOH best case | ~2.5 USD/kg |
| Project size | 50–100 MW |
Preview Before You Purchase
Business Model Canvas
The NEL Business Model Canvas you’re previewing is the exact document you’ll receive—no mockup or demo—presented as a live snapshot of the final deliverable. When you purchase, you’ll download the same complete, editable file ready for presentation and customization. Designed for immediate use in Word and Excel, it includes all content and sections shown.
Description
Unlock strategic Business Model Canvas: map value, scale operations, capture market share
Unlock NEL's strategic blueprint with our Business Model Canvas—showing how the company creates value, scales operations, and captures market share. This concise, company-specific canvas maps customer segments, revenue streams, key partners and costs. Download the full Word/Excel file to benchmark, plan strategy, or prepare investor-ready analysis.
Partnerships
Renewable power developers
Partner with wind and solar IPPs to secure bankable green PPAs (sub-40 USD/MWh in favorable 2024 markets) to feed electrolysers (~50 kWh/kg H2), align project timelines so plant ramp-up matches seasonal renewable profiles, co-develop co-located sites to cut transmission losses (typically 3–8%) and grid fees, and jointly pursue incentives and long-term offtakes to de-risk capital.
Industrial gas and energy majors
Collaborate with industrial gas and energy majors on project financing, EPC execution and global rollout, leveraging a 2024 announced clean-hydrogen project pipeline exceeding 200 GW to scale deployments. Use majors’ distribution networks, safety practices and customer access to accelerate market entry. Form JVs for large hydrogen hubs and pipeline blending. Share O&M capabilities to meet uptime and performance guarantees.
OEMs and mobility integrators
Partner with OEMs such as Toyota and Hyundai in 2024 to standardize fueling protocols across fuel cell cars, buses and trucks, reducing integration time and warranty friction.
Coordinate station design for high-throughput, high-availability operations, aligning dispenser specs and communications to support continuous fleet refueling cycles.
Pilot depot projects with fleet operators to validate total cost of ownership and uptime under real-world duty cycles, capturing operational metrics for scale-up.
Co-market integrated vehicle-plus-infrastructure solutions with OEMs and integrators to accelerate fleet adoption and commercial deployment in 2024 markets.
Policy bodies and research institutions
Engage standards bodies to influence codes, permitting, and safety frameworks; partner with universities on advanced materials, stacks, and controls; join demonstration programs to validate bankability; and leverage grants to lower innovation and scale-up risk—noting Horizon Europe’s €95.5 billion program and the US BIL’s $8 billion Clean Hydrogen Hubs funding (2024) as relevant funding pools.
- Standards: codes & permitting
- Academia: materials, stacks, controls
- Demo: bankability validation
- Grants: Horizon Europe €95.5B; US BIL $8B
EPCs and supply chain vendors
Secure reliable suppliers for stacks, power electronics, compressors and storage through long-term qualified agreements with tiered traceability and HSE audits; align EPCs on modularization and repeatable delivery to shorten site schedules and improve unit economics; implement cross-tier quality, HSE and traceability systems; negotiate volume contracts to lower costs and compress lead times.
- Supply security
- Modular EPC delivery
- Cross-tier quality & HSE
- Volume pricing & lead-time reduction
Scale clean H2 with sub-40 USD/MWh PPAs and ~50 kWh/kg electrolysers
Partner with wind/solar IPPs for bankable PPAs (sub-40 USD/MWh in 2024) to feed electrolysers (~50 kWh/kg H2), co-develop co-located sites to cut 3–8% transmission losses; JV with majors to scale (2024 clean-H2 pipeline >200 GW); align OEMs for fueling standards; secure suppliers and grants (Horizon €95.5B; US BIL $8B).
| Item | Key |
|---|---|
| PPA price | sub-40 USD/MWh |
| Electrolyser | ~50 kWh/kg |
| Pipeline | >200 GW (2024) |
What is included in the product
Detailed Word Document
A comprehensive NEL Business Model Canvas aligned to the company’s strategy, covering customer segments, channels, value propositions and revenue streams across the 9 classic BMC blocks with narratives and insights.
Customizable Excel Spreadsheet
High-level, editable snapshot that removes setup friction by condensing the company’s strategy into shareable cells for fast collaboration, executive summaries, and side-by-side comparisons.
Activities
Electrolyzer design and manufacturing
Develop PEM and alkaline systems optimized for efficiency and durability, leveraging modular stack designs and materials common to industry leaders. Scale automated production to gigawatt-scale output (>1 GW/year) through robotics and lean manufacturing. Conduct rigorous testing and certification to IEC standards and DNV approvals. Implement continuous improvement programs focused on cost-down and yield via SPC and automated process control.
Hydrogen station engineering and deployment
Design, build and commission compression, storage and dispensing solutions tailored to 350 and 700 bar refueling standards, following ISO 19880-1 (gas fueling stations) requirements updated through 2024. Layouts are optimized for high-throughput fleet refueling and safe storage sizing, with permitting and formal safety case submissions managed end-to-end. Deliver turnkey EPC contracts with site acceptance testing (SAT) to certify operational readiness.
Project development and integration
Perform techno‑economic modeling and sizing for 50–100 MW projects using 2024 benchmarks (electrolyzer CAPEX ~800 USD/kW; best‑case LCOH ~2.5 USD/kg) to stress test feasibility and returns. Integrate with renewables (capacity factors 25–40%), grid, water treatment and thermal management for round‑trip efficiency and curtailment mitigation. Structure PPAs, offtake and service agreements to support 70% debt project financing with 10–15 year tenors. Coordinate lenders, insurers, grid operators and local authorities through typical 12–24 month permitting and interconnection processes.
Aftermarket service and asset management
Aftermarket service and asset management at NEL provides preventive and corrective maintenance with guaranteed response times, 24/7 remote diagnostics and data analytics to monitor fleets and predict failures, spares logistics and field service teams to maximize uptime, plus performance guarantees and software/firmware updates as of 2024 to support long-term asset performance.
- Guaranteed response times
- 24/7 remote diagnostics
- Spares logistics & field teams
- Performance guarantees & updates
R&D and product roadmap execution
R&D focuses on advancing stack materials, catalysts and balance-of-plant efficiency while validating new modular formats in 2024 pilots before full rollout; efforts aim to lower CAPEX and OPEX through standardization and repeatable manufacturing. Concurrent work secures IP and ensures compliance with evolving global standards and certification regimes.
- R&D
- Modularization
- Pilots 2024
- CAPEX/OPEX reduction
- IP & standards
Scale automated PEM/alkaline stacks >1 GW/yr; turnkey 350/700 bar H2
Develop and manufacture PEM/alkaline stacks at >1 GW/year scale with automated lines (electrolyzer CAPEX ~800 USD/kW, target cost-down 2024). Deliver turnkey H2 stations (350/700 bar) with EPC, SAT and ISO/IEC/DNV certifications. Provide 24/7 remote diagnostics, spare logistics, SLA response times and asset management to maximize uptime.
| Metric | 2024 Value |
|---|---|
| Electrolyzer CAPEX | ~800 USD/kW |
| Scale | >1 GW/yr |
| LCOH best case | ~2.5 USD/kg |
| Project size | 50–100 MW |
Preview Before You Purchase
Business Model Canvas
The NEL Business Model Canvas you’re previewing is the exact document you’ll receive—no mockup or demo—presented as a live snapshot of the final deliverable. When you purchase, you’ll download the same complete, editable file ready for presentation and customization. Designed for immediate use in Word and Excel, it includes all content and sections shown.











