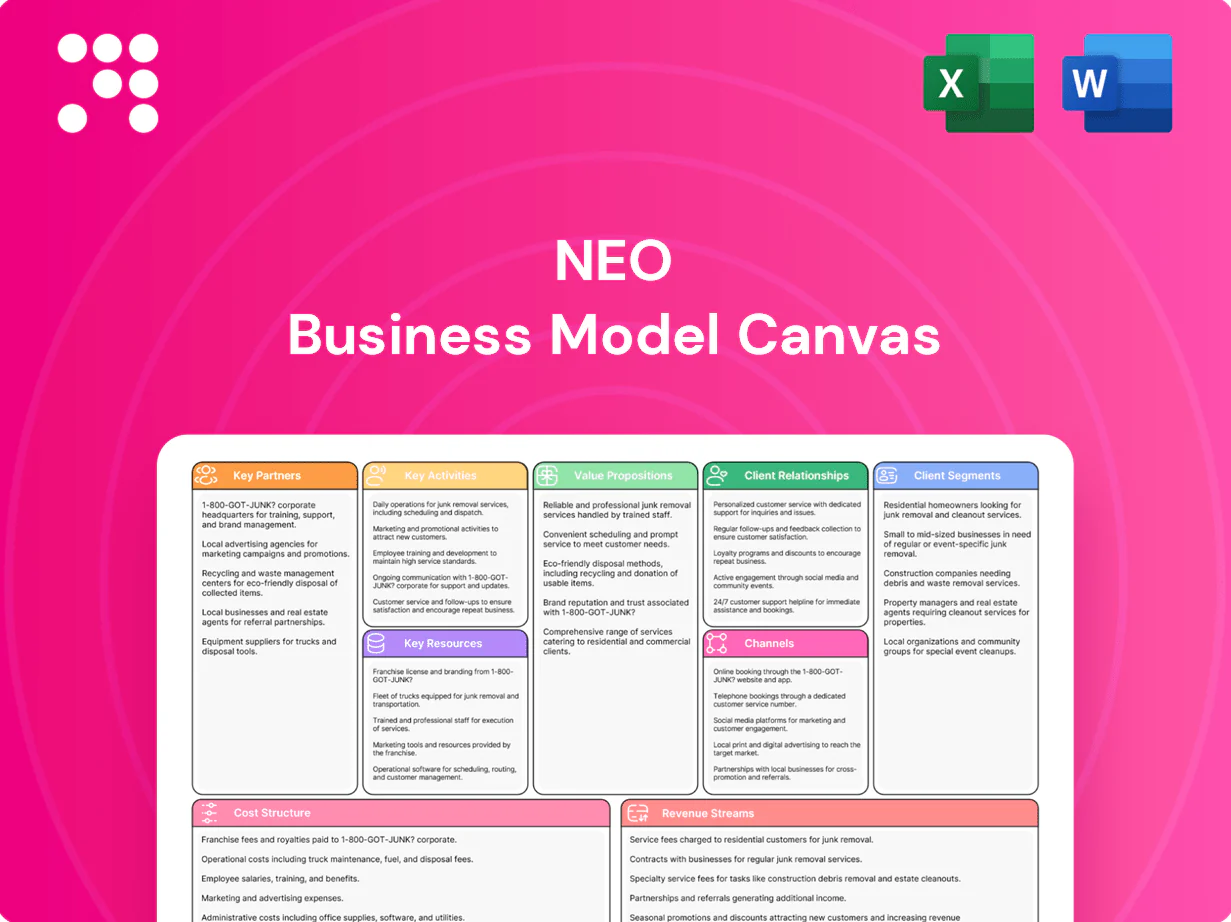
Neo Business Model Canvas

Concise Business Model Canvas Preview - Get the Full Editable Canvas and Actionable Insights
Discover Neo’s strategic engine with our concise Business Model Canvas preview—then unlock the full document to see every building block in action. Ideal for entrepreneurs, investors, and consultants, the complete Canvas delivers editable Word and Excel files, actionable insights, and section-by-section analysis to inform decisions and accelerate growth.
Partnerships

Upstream Rare Earth Miners
Secure multi‑year offtake and supply agreements lock feedstock and price visibility, typically covering over 70% of Neo’s annual requirements; China still supplies roughly 60–70% of mined rare earths while accounting for over 80% of refining capacity in 2024. Diversified sourcing across Australia, US and SE Asia reduces geopolitical concentration risk; joint planning aligns ore chemistry to downstream separation specs and collaborative ESG due diligence ensures responsible sourcing and traceability.
Refining & Separation Partners
Alliances with specialized refiners balance capacity and enable flexible scaling across oxides, metals, and alloys, improving responsiveness to market shifts. Technical interchange between partners boosts yield and impurity control while lowering per-unit cost. Shared investments in purification technology accelerate time-to-market. Co-located operations cut logistics complexity and reduce working capital needs.

OEMs and Tier-1s in EV, Wind, Electronics
In 2024, strategic partnerships with OEMs and Tier-1s in EV, wind and electronics drove co-development of magnet powders and engineered materials, aligning specs and test protocols. Long-horizon qualification plans lock in platform wins and reduce requalification cycles. Shared forecasts stabilize production planning and inventory. Joint performance roadmaps inform next-gen material specifications.

Research Institutions & Universities
Collaborative R&D with universities accelerates magnetic, catalytic and separation science, cutting lab-to-patent timelines and leveraging over $80B annual U.S. university R&D (2023–24) to de-risk early-stage innovation; IP sharing frameworks boost patentable outcomes while government grants and consortia often provide 2–4x funding leverage for scale-up.
- Collaborative R&D
- Talent & facilities
- IP sharing
- Grant leverage 2–4x
Recycling, Logistics & Compliance Bodies
Recycling partners supply secondary feedstock and close material loops, with global e-waste ~60 million tonnes in 2024 (Global E-waste Monitor) and certified recyclers reporting metal recovery rates up to 90–95% for key commodities. Global logistics providers ensure ADR/IATA-compliant movement of hazardous materials, while engagement with regulators and standards bodies accelerates certifications and enables end-to-end traceability and lifecycle reporting.
- Recycled feedstock: ~60 Mt e-waste (2024)
- Recovery rates: 90–95% for key metals
- Compliance: ADR/IATA certified logistics
- Traceability: regulatory-aligned lifecycle reporting
Secure >70% feedstock cover; China 60–70% mined share
Secure multi‑year offtake/supply cover >70% of feedstock; China supplied ~60–70% of mined rare earths and >80% of refining capacity (2024).
Alliances with refiners, OEMs and recyclers cut costs, speed qualification and leverage co‑investment; university R&D ~$80B (2023–24).
Recycling supplies secondary feedstock from ~60 Mt e‑waste (2024) with recovery rates 90–95%.
| Metric | Value (2024) |
|---|---|
| Offtake coverage | >70% |
| China share | 60–70% mined; >80% refining |
| Univ R&D | $80B |
| E‑waste | ~60 Mt |
| Recovery | 90–95% |
What is included in the product
 Detailed Word Document
A concise, pre-written Neo Business Model Canvas aligned to a company’s strategic goals, detailing customer segments, channels, value propositions, revenue streams and cost structure with real-world operational insights. Ideal for presentations, funding discussions and strategic validation with SWOT-linked analysis per block.

 Customizable Excel Spreadsheet
Streamlines identification of core pain points and value propositions on a single editable canvas for fast team alignment. Shareable, easy-to-adapt layout saves hours of formatting and enables quick deliverables, comparisons, and executive summaries.
Activities

Rare Earth Separation & Refining
Execute solvent extraction, precipitation and calcination to produce high-purity rare-earth oxides and metals targeting >99.5% purity for NdPr and dysprosium streams. Optimize yields above 90%, scale throughput toward 10 kt REO/year per mid‑scale plant and cut energy intensity ~15% via heat recovery and reagent recycling. Maintain stringent impurity profiles aligned to downstream magnet and catalyst specs (ppb levels). Continuously debottleneck processes to expand margins and improve ROIC.
Magnequench Powder & Alloy Production
Manufacture bonded and sintered magnet powders with tight particle-size and anisotropy control to meet EV traction motor and consumer electronics specs. Tailor alloy compositions and heat treatments for torque density and miniaturization; EVs comprised about 14% of global light-vehicle sales in 2024, driving magnet demand. Maintain consistency via advanced process control, inline QA and SPC. Provide technical support for customer pressing and molding processes.

Application Engineering & Co-Development
Collaborate with OEMs on material selection, design-in, and qualification while providing simulation, prototyping, and testing support to translate application stresses into precise material-property targets; as of 2024 co-development partnerships often cut time-to-market by ~30% and materially lower switching costs.

Supply Chain & ESG Management
Manage multi-region sourcing, inventory and logistics to ensure resilience and lowest total landed cost; implement traceability, third-party audits and responsible sourcing protocols; report Scope 1–3 emissions (Scope 3 often >70% of total emissions in 2024) and drive energy efficiency; prepare for accelerating regulatory scrutiny on critical minerals in 2024.
- Multi-region sourcing, traceability, Scope 1–3 reporting, critical-minerals readiness
IP, Product Management & Market Development
Protect proprietary process know-how and compositions with layered IP (patents, trade secrets, contracts), prioritizing platform programs and high‑growth segments to capture >5–15% margin uplifts from differentiated pricing; manage commodity exposure to limit cost volatility and price to value while educating markets on performance, reliability and sustainability benefits to drive adoption.
- IP protection: patents + trade secrets
- Focus: platform programs, high‑growth segments
- Pricing: value-based; mitigate commodity swings 5–15%
- Go‑to‑market: education on performance, reliability, sustainability
Operate solvent extraction to >99.5% purity, >90% yield, 10 kt REO/yr
Operate solvent extraction, precipitation and calcination to deliver >99.5% NdPr/Dy purity, >90% yields and mid‑scale throughput toward 10 kt REO/yr. Produce bonded/sintered magnet powders with tight PSD and anisotropy for EV traction (EVs ≈14% global light‑vehicle sales in 2024). Manage multi‑region sourcing, traceability, Scope 1–3 reporting (Scope 3 >70%). Protect IP to capture 5–15% pricing uplift.
| Metric | 2024/Target |
|---|---|
| Purity | >99.5% |
| Yield | >90% |
| Throughput | 10 kt REO/yr |
| EV share | ≈14% |
| Scope 3 | >70% |
| Pricing uplift | 5–15% |
Preview Before You Purchase
Business Model Canvas
The preview you see of the Neo Business Model Canvas is the exact document you will receive—no mockup or sample. Upon purchase you’ll get this same fully formatted, editable file ready for presentation and implementation. What you see in the preview is what you’ll download and own.

Concise Business Model Canvas Preview - Get the Full Editable Canvas and Actionable Insights
Discover Neo’s strategic engine with our concise Business Model Canvas preview—then unlock the full document to see every building block in action. Ideal for entrepreneurs, investors, and consultants, the complete Canvas delivers editable Word and Excel files, actionable insights, and section-by-section analysis to inform decisions and accelerate growth.
Partnerships
Upstream Rare Earth Miners
Secure multi‑year offtake and supply agreements lock feedstock and price visibility, typically covering over 70% of Neo’s annual requirements; China still supplies roughly 60–70% of mined rare earths while accounting for over 80% of refining capacity in 2024. Diversified sourcing across Australia, US and SE Asia reduces geopolitical concentration risk; joint planning aligns ore chemistry to downstream separation specs and collaborative ESG due diligence ensures responsible sourcing and traceability.
Refining & Separation Partners
Alliances with specialized refiners balance capacity and enable flexible scaling across oxides, metals, and alloys, improving responsiveness to market shifts. Technical interchange between partners boosts yield and impurity control while lowering per-unit cost. Shared investments in purification technology accelerate time-to-market. Co-located operations cut logistics complexity and reduce working capital needs.
OEMs and Tier-1s in EV, Wind, Electronics
In 2024, strategic partnerships with OEMs and Tier-1s in EV, wind and electronics drove co-development of magnet powders and engineered materials, aligning specs and test protocols. Long-horizon qualification plans lock in platform wins and reduce requalification cycles. Shared forecasts stabilize production planning and inventory. Joint performance roadmaps inform next-gen material specifications.
Research Institutions & Universities
Collaborative R&D with universities accelerates magnetic, catalytic and separation science, cutting lab-to-patent timelines and leveraging over $80B annual U.S. university R&D (2023–24) to de-risk early-stage innovation; IP sharing frameworks boost patentable outcomes while government grants and consortia often provide 2–4x funding leverage for scale-up.
- Collaborative R&D
- Talent & facilities
- IP sharing
- Grant leverage 2–4x
Recycling, Logistics & Compliance Bodies
Recycling partners supply secondary feedstock and close material loops, with global e-waste ~60 million tonnes in 2024 (Global E-waste Monitor) and certified recyclers reporting metal recovery rates up to 90–95% for key commodities. Global logistics providers ensure ADR/IATA-compliant movement of hazardous materials, while engagement with regulators and standards bodies accelerates certifications and enables end-to-end traceability and lifecycle reporting.
- Recycled feedstock: ~60 Mt e-waste (2024)
- Recovery rates: 90–95% for key metals
- Compliance: ADR/IATA certified logistics
- Traceability: regulatory-aligned lifecycle reporting
Secure >70% feedstock cover; China 60–70% mined share
Secure multi‑year offtake/supply cover >70% of feedstock; China supplied ~60–70% of mined rare earths and >80% of refining capacity (2024).
Alliances with refiners, OEMs and recyclers cut costs, speed qualification and leverage co‑investment; university R&D ~$80B (2023–24).
Recycling supplies secondary feedstock from ~60 Mt e‑waste (2024) with recovery rates 90–95%.
| Metric | Value (2024) |
|---|---|
| Offtake coverage | >70% |
| China share | 60–70% mined; >80% refining |
| Univ R&D | $80B |
| E‑waste | ~60 Mt |
| Recovery | 90–95% |
What is included in the product
Detailed Word Document
A concise, pre-written Neo Business Model Canvas aligned to a company’s strategic goals, detailing customer segments, channels, value propositions, revenue streams and cost structure with real-world operational insights. Ideal for presentations, funding discussions and strategic validation with SWOT-linked analysis per block.
Customizable Excel Spreadsheet
Streamlines identification of core pain points and value propositions on a single editable canvas for fast team alignment. Shareable, easy-to-adapt layout saves hours of formatting and enables quick deliverables, comparisons, and executive summaries.
Activities
Rare Earth Separation & Refining
Execute solvent extraction, precipitation and calcination to produce high-purity rare-earth oxides and metals targeting >99.5% purity for NdPr and dysprosium streams. Optimize yields above 90%, scale throughput toward 10 kt REO/year per mid‑scale plant and cut energy intensity ~15% via heat recovery and reagent recycling. Maintain stringent impurity profiles aligned to downstream magnet and catalyst specs (ppb levels). Continuously debottleneck processes to expand margins and improve ROIC.
Magnequench Powder & Alloy Production
Manufacture bonded and sintered magnet powders with tight particle-size and anisotropy control to meet EV traction motor and consumer electronics specs. Tailor alloy compositions and heat treatments for torque density and miniaturization; EVs comprised about 14% of global light-vehicle sales in 2024, driving magnet demand. Maintain consistency via advanced process control, inline QA and SPC. Provide technical support for customer pressing and molding processes.
Application Engineering & Co-Development
Collaborate with OEMs on material selection, design-in, and qualification while providing simulation, prototyping, and testing support to translate application stresses into precise material-property targets; as of 2024 co-development partnerships often cut time-to-market by ~30% and materially lower switching costs.
Supply Chain & ESG Management
Manage multi-region sourcing, inventory and logistics to ensure resilience and lowest total landed cost; implement traceability, third-party audits and responsible sourcing protocols; report Scope 1–3 emissions (Scope 3 often >70% of total emissions in 2024) and drive energy efficiency; prepare for accelerating regulatory scrutiny on critical minerals in 2024.
- Multi-region sourcing, traceability, Scope 1–3 reporting, critical-minerals readiness
IP, Product Management & Market Development
Protect proprietary process know-how and compositions with layered IP (patents, trade secrets, contracts), prioritizing platform programs and high‑growth segments to capture >5–15% margin uplifts from differentiated pricing; manage commodity exposure to limit cost volatility and price to value while educating markets on performance, reliability and sustainability benefits to drive adoption.
- IP protection: patents + trade secrets
- Focus: platform programs, high‑growth segments
- Pricing: value-based; mitigate commodity swings 5–15%
- Go‑to‑market: education on performance, reliability, sustainability
Operate solvent extraction to >99.5% purity, >90% yield, 10 kt REO/yr
Operate solvent extraction, precipitation and calcination to deliver >99.5% NdPr/Dy purity, >90% yields and mid‑scale throughput toward 10 kt REO/yr. Produce bonded/sintered magnet powders with tight PSD and anisotropy for EV traction (EVs ≈14% global light‑vehicle sales in 2024). Manage multi‑region sourcing, traceability, Scope 1–3 reporting (Scope 3 >70%). Protect IP to capture 5–15% pricing uplift.
| Metric | 2024/Target |
|---|---|
| Purity | >99.5% |
| Yield | >90% |
| Throughput | 10 kt REO/yr |
| EV share | ≈14% |
| Scope 3 | >70% |
| Pricing uplift | 5–15% |
Preview Before You Purchase
Business Model Canvas
The preview you see of the Neo Business Model Canvas is the exact document you will receive—no mockup or sample. Upon purchase you’ll get this same fully formatted, editable file ready for presentation and implementation. What you see in the preview is what you’ll download and own.
Original: $10.00
-65%$10.00
$3.50Description
Concise Business Model Canvas Preview - Get the Full Editable Canvas and Actionable Insights
Discover Neo’s strategic engine with our concise Business Model Canvas preview—then unlock the full document to see every building block in action. Ideal for entrepreneurs, investors, and consultants, the complete Canvas delivers editable Word and Excel files, actionable insights, and section-by-section analysis to inform decisions and accelerate growth.
Partnerships
Upstream Rare Earth Miners
Secure multi‑year offtake and supply agreements lock feedstock and price visibility, typically covering over 70% of Neo’s annual requirements; China still supplies roughly 60–70% of mined rare earths while accounting for over 80% of refining capacity in 2024. Diversified sourcing across Australia, US and SE Asia reduces geopolitical concentration risk; joint planning aligns ore chemistry to downstream separation specs and collaborative ESG due diligence ensures responsible sourcing and traceability.
Refining & Separation Partners
Alliances with specialized refiners balance capacity and enable flexible scaling across oxides, metals, and alloys, improving responsiveness to market shifts. Technical interchange between partners boosts yield and impurity control while lowering per-unit cost. Shared investments in purification technology accelerate time-to-market. Co-located operations cut logistics complexity and reduce working capital needs.
OEMs and Tier-1s in EV, Wind, Electronics
In 2024, strategic partnerships with OEMs and Tier-1s in EV, wind and electronics drove co-development of magnet powders and engineered materials, aligning specs and test protocols. Long-horizon qualification plans lock in platform wins and reduce requalification cycles. Shared forecasts stabilize production planning and inventory. Joint performance roadmaps inform next-gen material specifications.
Research Institutions & Universities
Collaborative R&D with universities accelerates magnetic, catalytic and separation science, cutting lab-to-patent timelines and leveraging over $80B annual U.S. university R&D (2023–24) to de-risk early-stage innovation; IP sharing frameworks boost patentable outcomes while government grants and consortia often provide 2–4x funding leverage for scale-up.
- Collaborative R&D
- Talent & facilities
- IP sharing
- Grant leverage 2–4x
Recycling, Logistics & Compliance Bodies
Recycling partners supply secondary feedstock and close material loops, with global e-waste ~60 million tonnes in 2024 (Global E-waste Monitor) and certified recyclers reporting metal recovery rates up to 90–95% for key commodities. Global logistics providers ensure ADR/IATA-compliant movement of hazardous materials, while engagement with regulators and standards bodies accelerates certifications and enables end-to-end traceability and lifecycle reporting.
- Recycled feedstock: ~60 Mt e-waste (2024)
- Recovery rates: 90–95% for key metals
- Compliance: ADR/IATA certified logistics
- Traceability: regulatory-aligned lifecycle reporting
Secure >70% feedstock cover; China 60–70% mined share
Secure multi‑year offtake/supply cover >70% of feedstock; China supplied ~60–70% of mined rare earths and >80% of refining capacity (2024).
Alliances with refiners, OEMs and recyclers cut costs, speed qualification and leverage co‑investment; university R&D ~$80B (2023–24).
Recycling supplies secondary feedstock from ~60 Mt e‑waste (2024) with recovery rates 90–95%.
| Metric | Value (2024) |
|---|---|
| Offtake coverage | >70% |
| China share | 60–70% mined; >80% refining |
| Univ R&D | $80B |
| E‑waste | ~60 Mt |
| Recovery | 90–95% |
What is included in the product
Detailed Word Document
A concise, pre-written Neo Business Model Canvas aligned to a company’s strategic goals, detailing customer segments, channels, value propositions, revenue streams and cost structure with real-world operational insights. Ideal for presentations, funding discussions and strategic validation with SWOT-linked analysis per block.
Customizable Excel Spreadsheet
Streamlines identification of core pain points and value propositions on a single editable canvas for fast team alignment. Shareable, easy-to-adapt layout saves hours of formatting and enables quick deliverables, comparisons, and executive summaries.
Activities
Rare Earth Separation & Refining
Execute solvent extraction, precipitation and calcination to produce high-purity rare-earth oxides and metals targeting >99.5% purity for NdPr and dysprosium streams. Optimize yields above 90%, scale throughput toward 10 kt REO/year per mid‑scale plant and cut energy intensity ~15% via heat recovery and reagent recycling. Maintain stringent impurity profiles aligned to downstream magnet and catalyst specs (ppb levels). Continuously debottleneck processes to expand margins and improve ROIC.
Magnequench Powder & Alloy Production
Manufacture bonded and sintered magnet powders with tight particle-size and anisotropy control to meet EV traction motor and consumer electronics specs. Tailor alloy compositions and heat treatments for torque density and miniaturization; EVs comprised about 14% of global light-vehicle sales in 2024, driving magnet demand. Maintain consistency via advanced process control, inline QA and SPC. Provide technical support for customer pressing and molding processes.
Application Engineering & Co-Development
Collaborate with OEMs on material selection, design-in, and qualification while providing simulation, prototyping, and testing support to translate application stresses into precise material-property targets; as of 2024 co-development partnerships often cut time-to-market by ~30% and materially lower switching costs.
Supply Chain & ESG Management
Manage multi-region sourcing, inventory and logistics to ensure resilience and lowest total landed cost; implement traceability, third-party audits and responsible sourcing protocols; report Scope 1–3 emissions (Scope 3 often >70% of total emissions in 2024) and drive energy efficiency; prepare for accelerating regulatory scrutiny on critical minerals in 2024.
- Multi-region sourcing, traceability, Scope 1–3 reporting, critical-minerals readiness
IP, Product Management & Market Development
Protect proprietary process know-how and compositions with layered IP (patents, trade secrets, contracts), prioritizing platform programs and high‑growth segments to capture >5–15% margin uplifts from differentiated pricing; manage commodity exposure to limit cost volatility and price to value while educating markets on performance, reliability and sustainability benefits to drive adoption.
- IP protection: patents + trade secrets
- Focus: platform programs, high‑growth segments
- Pricing: value-based; mitigate commodity swings 5–15%
- Go‑to‑market: education on performance, reliability, sustainability
Operate solvent extraction to >99.5% purity, >90% yield, 10 kt REO/yr
Operate solvent extraction, precipitation and calcination to deliver >99.5% NdPr/Dy purity, >90% yields and mid‑scale throughput toward 10 kt REO/yr. Produce bonded/sintered magnet powders with tight PSD and anisotropy for EV traction (EVs ≈14% global light‑vehicle sales in 2024). Manage multi‑region sourcing, traceability, Scope 1–3 reporting (Scope 3 >70%). Protect IP to capture 5–15% pricing uplift.
| Metric | 2024/Target |
|---|---|
| Purity | >99.5% |
| Yield | >90% |
| Throughput | 10 kt REO/yr |
| EV share | ≈14% |
| Scope 3 | >70% |
| Pricing uplift | 5–15% |
Preview Before You Purchase
Business Model Canvas
The preview you see of the Neo Business Model Canvas is the exact document you will receive—no mockup or sample. Upon purchase you’ll get this same fully formatted, editable file ready for presentation and implementation. What you see in the preview is what you’ll download and own.











