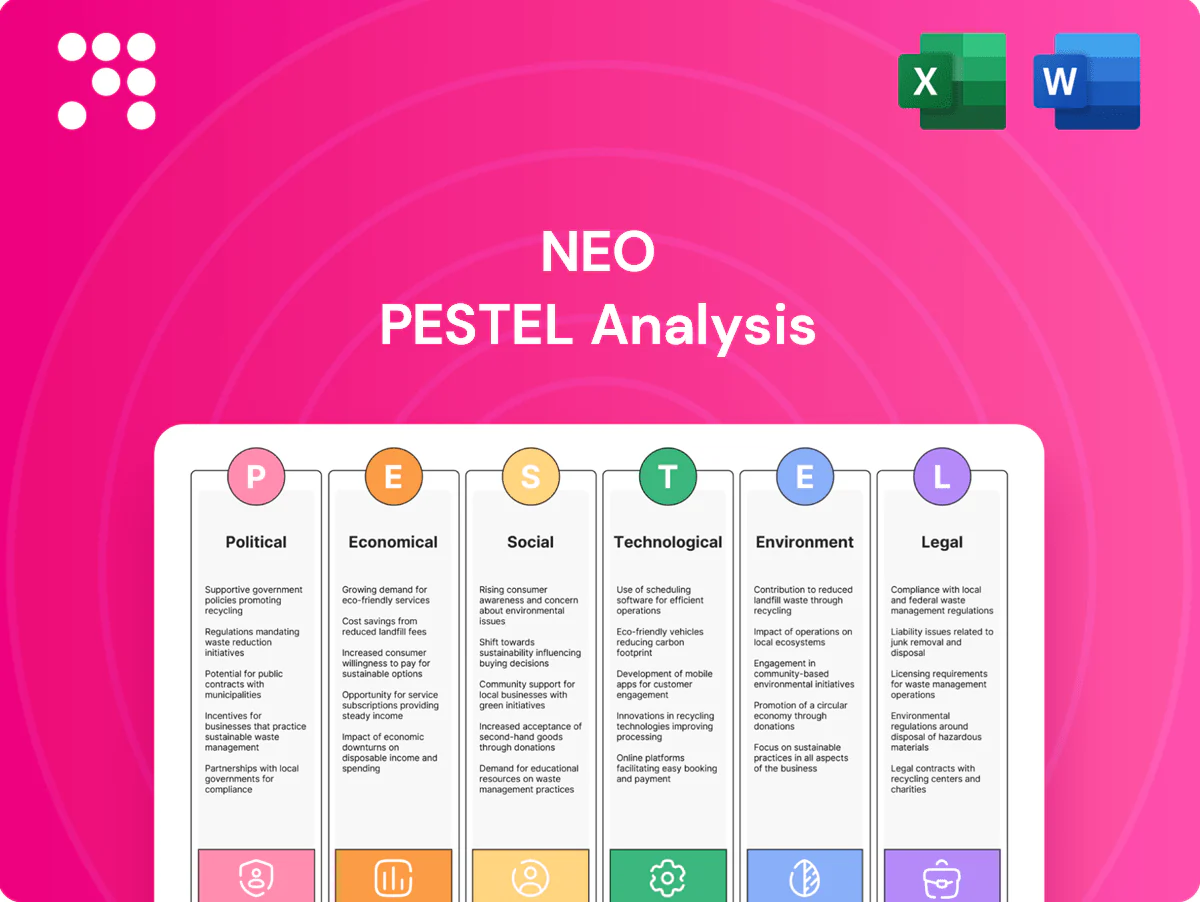
Neo PESTLE Analysis

Your Competitive Advantage Starts with This Report
Uncover the external forces shaping Neo’s future with our targeted PESTLE Analysis. Three-plus pages of concise political, economic, social, technological, legal and environmental insights help you spot risks and opportunities. Purchase the full, editable report now for instant, boardroom-ready strategic intelligence.
Political factors

Geopolitical rare earth tensions
Neo and some customers are exposed to China–US/EU tensions that risk disrupting flows or prompting retaliatory export curbs; China produced roughly 60–70% of rare earth oxides and held over 80% of refining capacity in 2023–24. Policy shifts can change export licences, quotas or tariffs quickly, impacting prices and margins. Scenario planning for bifurcated supply chains and dual sourcing is therefore critical to mitigate supply shocks.
Export controls and quotas
Governments can tighten export controls on critical minerals—China, which produced about 58% of global rare-earth oxide in 2023 (USGS), has expanded controls (eg gallium, germanium in 2023), affecting oxides, metals and magnet powders. Sudden quota cuts have pushed prices 20–50% higher and extended lead times from weeks to months. Diversified sourcing and 90–180 day inventory buffers reduce exposure and smooth shocks.

Industrial policy and subsidies
US industrial policy—led by the Inflation Reduction Act’s ~369 billion USD clean-energy package and EV tax credits up to 7,500 USD—plus the EU Chips Act (~43 billion EUR) and China’s tens-of-billions funding for semiconductors, can pull demand forward for Neo’s battery, wind and chip-grade materials. Local-content rules in US, EU and many Asian programs will steer where Neo locates plants and selects partners. Capturing grants, tax credits or PTC/ITC equivalents materially improves project economics and de-risks capital, shortening payback and boosting returns.

Resource nationalism
Producer states may raise royalties, impose beneficiation mandates or export taxes—Indonesia's 2020 nickel ore export ban remains a clear precedent—driving higher upstream costs and incentivizing onshore processing investment. These policies shift cost curves toward domestic smelting and midstream CAPEX. Long-term offtakes, typically 5–20 years, can secure supply and stabilize access; 2024 saw offtake activity in critical minerals totaling tens of billions globally.
- Royalties/export taxes: increase producer take, raise upstream costs
- Beneficiation mandates: favor onshore processing, drive CAPEX
- Offtakes 5–20 yrs: stabilize access, lock supply
Sanctions and trade compliance
- Scope: multijurisdictional (US/EU/UK/UN)
- Scale: OFAC SDN >9,000 (mid‑2025)
- Risk: restricted payment channels, correspondent bans
- Mitigation: screening, EDD, contractual sanctions clauses
China rare-earth dominance, subsidy wars and export risks reshape supply chains amid sanctions
Neo faces China–US/EU tensions: China held ~58–70% of rare‑earth oxide output and >80% of refining (2023–24), risking export curbs. US IRA ~$369bn, EU Chips Act €43bn and China subsidies pull demand and impose local‑content rules. Producer policies (eg Indonesia nickel ban) raise upstream costs. OFAC SDN >9,000 (mid‑2025) elevates sanctions/compliance risk.
| Metric | Value |
|---|---|
| China REO output | 58–70% (2023–24) |
| Refining share | >80% (2023–24) |
| US IRA | $369bn |
| OFAC SDN | >9,000 (mid‑2025) |
What is included in the product
 Detailed Word Document
Provides a concise Neo PESTLE evaluation of Political, Economic, Social, Technological, Environmental, and Legal forces—data-backed, region- and industry-specific, and expanded into actionable sub-points—designed for executives, investors, and entrepreneurs to identify risks, opportunities, and forward-looking scenarios for strategy and funding readiness.

 Customizable Excel Spreadsheet
Condensed, visually segmented Neo PESTLE summary that highlights key external factors and recommended actions, easily editable and shareable for meetings, presentations, and cross-team alignment.
Economic factors

Commodity price volatility
Rare earth and rare metal prices are highly cyclical, with global rare-earth oxide (REO) mine production ~240,000 tonnes REO in 2023 and China accounting for about 60–70% of processing, driving inventory-led swings. Margin capture hinges on pass-through mechanisms; firms with flexible pricing recovered faster after 2021–22 shocks. Hedging and index-linked pricing formulas are now key risk-management tools for producers and buyers.
Demand cyclicality in end-markets
EVs, electronics and renewables anchor demand growth—EV sales rose about 20% y/y to roughly 16 million units in 2024, while global renewables added ~450 GW and electronics shipments were broadly flat to down low-single-digits in 2024—yet all show inventory- and rate-sensitive cycles. Downturns quickly compress volumes in Magnequench and Chemicals & Oxides, where order books fell double digits in prior slowdowns. A balanced portfolio smooths utilization and limits margin volatility.

FX exposure and cost base
Multi-currency revenues and inputs (USD, EUR, CNY, CAD) create translation and transaction risk; IMF COFER Q4 2024 shows reserves USD 58.9%, EUR 19.4%, CNY 3.5%, underscoring dollar-driven spillovers to pricing.
Currency moves can invert regional cost advantages within months, forcing supply-chain reshoring or margin compression.
Natural hedges and derivatives (forwards, options, swaps) are employed to stabilize EBITDA volatility.

Capital intensity and capex timing
Processing expansions are capital-intensive: leading-edge semiconductor fabs require tens of billions USD and major equipment often has 12–36 month lead times. Mis-timed investments risk underutilization—DRAM oversupply in 2019–2020 drove prices down over 50%, compressing returns. Staged, modular capacity preserves ROIC by aligning spend with realized demand.
- Capex scale: tens of billions USD for leading-edge fabs
- Lead times: 12–36 months for major equipment
- Risk: DRAM prices fell >50% in 2019–2020
- Mitigation: staged/modular builds match spend to demand
Interest rates and financing
China rare-earth dominance, subsidy wars and export risks reshape supply chains amid sanctions
Rare-earth prices remain cyclical; global REO mine output ~240,000 t in 2023 with China 60–70% of processing. EVs drove demand—global EV sales ~16m units in 2024—and renewables added ~450 GW in 2024. Fed funds 5.25–5.50% (mid‑2025) lifts WACC ~100–150 bps; project spreads up ~200 bps since 2022, pushing staged capex and hedging.
| Metric | Value |
|---|---|
| REO production 2023 | ~240,000 t |
| China processing | 60–70% |
| EV sales 2024 | ~16m units |
| Renewables 2024 | ~450 GW |
| Fed funds (mid‑2025) | 5.25–5.50% |
Preview the Actual Deliverable
Neo PESTLE Analysis
This Neo PESTLE Analysis preview is the exact document you’ll receive after purchase—fully formatted, professionally structured, and ready to use. The content, layout, and strategic insights shown here are delivered exactly as displayed with no placeholders or teasers. After checkout you can download this final file immediately and begin applying the analysis to your business or investment decisions.

Your Competitive Advantage Starts with This Report
Uncover the external forces shaping Neo’s future with our targeted PESTLE Analysis. Three-plus pages of concise political, economic, social, technological, legal and environmental insights help you spot risks and opportunities. Purchase the full, editable report now for instant, boardroom-ready strategic intelligence.
Political factors
Geopolitical rare earth tensions
Neo and some customers are exposed to China–US/EU tensions that risk disrupting flows or prompting retaliatory export curbs; China produced roughly 60–70% of rare earth oxides and held over 80% of refining capacity in 2023–24. Policy shifts can change export licences, quotas or tariffs quickly, impacting prices and margins. Scenario planning for bifurcated supply chains and dual sourcing is therefore critical to mitigate supply shocks.
Export controls and quotas
Governments can tighten export controls on critical minerals—China, which produced about 58% of global rare-earth oxide in 2023 (USGS), has expanded controls (eg gallium, germanium in 2023), affecting oxides, metals and magnet powders. Sudden quota cuts have pushed prices 20–50% higher and extended lead times from weeks to months. Diversified sourcing and 90–180 day inventory buffers reduce exposure and smooth shocks.
Industrial policy and subsidies
US industrial policy—led by the Inflation Reduction Act’s ~369 billion USD clean-energy package and EV tax credits up to 7,500 USD—plus the EU Chips Act (~43 billion EUR) and China’s tens-of-billions funding for semiconductors, can pull demand forward for Neo’s battery, wind and chip-grade materials. Local-content rules in US, EU and many Asian programs will steer where Neo locates plants and selects partners. Capturing grants, tax credits or PTC/ITC equivalents materially improves project economics and de-risks capital, shortening payback and boosting returns.
Resource nationalism
Producer states may raise royalties, impose beneficiation mandates or export taxes—Indonesia's 2020 nickel ore export ban remains a clear precedent—driving higher upstream costs and incentivizing onshore processing investment. These policies shift cost curves toward domestic smelting and midstream CAPEX. Long-term offtakes, typically 5–20 years, can secure supply and stabilize access; 2024 saw offtake activity in critical minerals totaling tens of billions globally.
- Royalties/export taxes: increase producer take, raise upstream costs
- Beneficiation mandates: favor onshore processing, drive CAPEX
- Offtakes 5–20 yrs: stabilize access, lock supply
Sanctions and trade compliance
- Scope: multijurisdictional (US/EU/UK/UN)
- Scale: OFAC SDN >9,000 (mid‑2025)
- Risk: restricted payment channels, correspondent bans
- Mitigation: screening, EDD, contractual sanctions clauses
China rare-earth dominance, subsidy wars and export risks reshape supply chains amid sanctions
Neo faces China–US/EU tensions: China held ~58–70% of rare‑earth oxide output and >80% of refining (2023–24), risking export curbs. US IRA ~$369bn, EU Chips Act €43bn and China subsidies pull demand and impose local‑content rules. Producer policies (eg Indonesia nickel ban) raise upstream costs. OFAC SDN >9,000 (mid‑2025) elevates sanctions/compliance risk.
| Metric | Value |
|---|---|
| China REO output | 58–70% (2023–24) |
| Refining share | >80% (2023–24) |
| US IRA | $369bn |
| OFAC SDN | >9,000 (mid‑2025) |
What is included in the product
Detailed Word Document
Provides a concise Neo PESTLE evaluation of Political, Economic, Social, Technological, Environmental, and Legal forces—data-backed, region- and industry-specific, and expanded into actionable sub-points—designed for executives, investors, and entrepreneurs to identify risks, opportunities, and forward-looking scenarios for strategy and funding readiness.
Customizable Excel Spreadsheet
Condensed, visually segmented Neo PESTLE summary that highlights key external factors and recommended actions, easily editable and shareable for meetings, presentations, and cross-team alignment.
Economic factors
Commodity price volatility
Rare earth and rare metal prices are highly cyclical, with global rare-earth oxide (REO) mine production ~240,000 tonnes REO in 2023 and China accounting for about 60–70% of processing, driving inventory-led swings. Margin capture hinges on pass-through mechanisms; firms with flexible pricing recovered faster after 2021–22 shocks. Hedging and index-linked pricing formulas are now key risk-management tools for producers and buyers.
Demand cyclicality in end-markets
EVs, electronics and renewables anchor demand growth—EV sales rose about 20% y/y to roughly 16 million units in 2024, while global renewables added ~450 GW and electronics shipments were broadly flat to down low-single-digits in 2024—yet all show inventory- and rate-sensitive cycles. Downturns quickly compress volumes in Magnequench and Chemicals & Oxides, where order books fell double digits in prior slowdowns. A balanced portfolio smooths utilization and limits margin volatility.
FX exposure and cost base
Multi-currency revenues and inputs (USD, EUR, CNY, CAD) create translation and transaction risk; IMF COFER Q4 2024 shows reserves USD 58.9%, EUR 19.4%, CNY 3.5%, underscoring dollar-driven spillovers to pricing.
Currency moves can invert regional cost advantages within months, forcing supply-chain reshoring or margin compression.
Natural hedges and derivatives (forwards, options, swaps) are employed to stabilize EBITDA volatility.
Capital intensity and capex timing
Processing expansions are capital-intensive: leading-edge semiconductor fabs require tens of billions USD and major equipment often has 12–36 month lead times. Mis-timed investments risk underutilization—DRAM oversupply in 2019–2020 drove prices down over 50%, compressing returns. Staged, modular capacity preserves ROIC by aligning spend with realized demand.
- Capex scale: tens of billions USD for leading-edge fabs
- Lead times: 12–36 months for major equipment
- Risk: DRAM prices fell >50% in 2019–2020
- Mitigation: staged/modular builds match spend to demand
Interest rates and financing
China rare-earth dominance, subsidy wars and export risks reshape supply chains amid sanctions
Rare-earth prices remain cyclical; global REO mine output ~240,000 t in 2023 with China 60–70% of processing. EVs drove demand—global EV sales ~16m units in 2024—and renewables added ~450 GW in 2024. Fed funds 5.25–5.50% (mid‑2025) lifts WACC ~100–150 bps; project spreads up ~200 bps since 2022, pushing staged capex and hedging.
| Metric | Value |
|---|---|
| REO production 2023 | ~240,000 t |
| China processing | 60–70% |
| EV sales 2024 | ~16m units |
| Renewables 2024 | ~450 GW |
| Fed funds (mid‑2025) | 5.25–5.50% |
Preview the Actual Deliverable
Neo PESTLE Analysis
This Neo PESTLE Analysis preview is the exact document you’ll receive after purchase—fully formatted, professionally structured, and ready to use. The content, layout, and strategic insights shown here are delivered exactly as displayed with no placeholders or teasers. After checkout you can download this final file immediately and begin applying the analysis to your business or investment decisions.
Original: $10.00
-65%$10.00
$3.50Description
Your Competitive Advantage Starts with This Report
Uncover the external forces shaping Neo’s future with our targeted PESTLE Analysis. Three-plus pages of concise political, economic, social, technological, legal and environmental insights help you spot risks and opportunities. Purchase the full, editable report now for instant, boardroom-ready strategic intelligence.
Political factors
Geopolitical rare earth tensions
Neo and some customers are exposed to China–US/EU tensions that risk disrupting flows or prompting retaliatory export curbs; China produced roughly 60–70% of rare earth oxides and held over 80% of refining capacity in 2023–24. Policy shifts can change export licences, quotas or tariffs quickly, impacting prices and margins. Scenario planning for bifurcated supply chains and dual sourcing is therefore critical to mitigate supply shocks.
Export controls and quotas
Governments can tighten export controls on critical minerals—China, which produced about 58% of global rare-earth oxide in 2023 (USGS), has expanded controls (eg gallium, germanium in 2023), affecting oxides, metals and magnet powders. Sudden quota cuts have pushed prices 20–50% higher and extended lead times from weeks to months. Diversified sourcing and 90–180 day inventory buffers reduce exposure and smooth shocks.
Industrial policy and subsidies
US industrial policy—led by the Inflation Reduction Act’s ~369 billion USD clean-energy package and EV tax credits up to 7,500 USD—plus the EU Chips Act (~43 billion EUR) and China’s tens-of-billions funding for semiconductors, can pull demand forward for Neo’s battery, wind and chip-grade materials. Local-content rules in US, EU and many Asian programs will steer where Neo locates plants and selects partners. Capturing grants, tax credits or PTC/ITC equivalents materially improves project economics and de-risks capital, shortening payback and boosting returns.
Resource nationalism
Producer states may raise royalties, impose beneficiation mandates or export taxes—Indonesia's 2020 nickel ore export ban remains a clear precedent—driving higher upstream costs and incentivizing onshore processing investment. These policies shift cost curves toward domestic smelting and midstream CAPEX. Long-term offtakes, typically 5–20 years, can secure supply and stabilize access; 2024 saw offtake activity in critical minerals totaling tens of billions globally.
- Royalties/export taxes: increase producer take, raise upstream costs
- Beneficiation mandates: favor onshore processing, drive CAPEX
- Offtakes 5–20 yrs: stabilize access, lock supply
Sanctions and trade compliance
- Scope: multijurisdictional (US/EU/UK/UN)
- Scale: OFAC SDN >9,000 (mid‑2025)
- Risk: restricted payment channels, correspondent bans
- Mitigation: screening, EDD, contractual sanctions clauses
China rare-earth dominance, subsidy wars and export risks reshape supply chains amid sanctions
Neo faces China–US/EU tensions: China held ~58–70% of rare‑earth oxide output and >80% of refining (2023–24), risking export curbs. US IRA ~$369bn, EU Chips Act €43bn and China subsidies pull demand and impose local‑content rules. Producer policies (eg Indonesia nickel ban) raise upstream costs. OFAC SDN >9,000 (mid‑2025) elevates sanctions/compliance risk.
| Metric | Value |
|---|---|
| China REO output | 58–70% (2023–24) |
| Refining share | >80% (2023–24) |
| US IRA | $369bn |
| OFAC SDN | >9,000 (mid‑2025) |
What is included in the product
Detailed Word Document
Provides a concise Neo PESTLE evaluation of Political, Economic, Social, Technological, Environmental, and Legal forces—data-backed, region- and industry-specific, and expanded into actionable sub-points—designed for executives, investors, and entrepreneurs to identify risks, opportunities, and forward-looking scenarios for strategy and funding readiness.
Customizable Excel Spreadsheet
Condensed, visually segmented Neo PESTLE summary that highlights key external factors and recommended actions, easily editable and shareable for meetings, presentations, and cross-team alignment.
Economic factors
Commodity price volatility
Rare earth and rare metal prices are highly cyclical, with global rare-earth oxide (REO) mine production ~240,000 tonnes REO in 2023 and China accounting for about 60–70% of processing, driving inventory-led swings. Margin capture hinges on pass-through mechanisms; firms with flexible pricing recovered faster after 2021–22 shocks. Hedging and index-linked pricing formulas are now key risk-management tools for producers and buyers.
Demand cyclicality in end-markets
EVs, electronics and renewables anchor demand growth—EV sales rose about 20% y/y to roughly 16 million units in 2024, while global renewables added ~450 GW and electronics shipments were broadly flat to down low-single-digits in 2024—yet all show inventory- and rate-sensitive cycles. Downturns quickly compress volumes in Magnequench and Chemicals & Oxides, where order books fell double digits in prior slowdowns. A balanced portfolio smooths utilization and limits margin volatility.
FX exposure and cost base
Multi-currency revenues and inputs (USD, EUR, CNY, CAD) create translation and transaction risk; IMF COFER Q4 2024 shows reserves USD 58.9%, EUR 19.4%, CNY 3.5%, underscoring dollar-driven spillovers to pricing.
Currency moves can invert regional cost advantages within months, forcing supply-chain reshoring or margin compression.
Natural hedges and derivatives (forwards, options, swaps) are employed to stabilize EBITDA volatility.
Capital intensity and capex timing
Processing expansions are capital-intensive: leading-edge semiconductor fabs require tens of billions USD and major equipment often has 12–36 month lead times. Mis-timed investments risk underutilization—DRAM oversupply in 2019–2020 drove prices down over 50%, compressing returns. Staged, modular capacity preserves ROIC by aligning spend with realized demand.
- Capex scale: tens of billions USD for leading-edge fabs
- Lead times: 12–36 months for major equipment
- Risk: DRAM prices fell >50% in 2019–2020
- Mitigation: staged/modular builds match spend to demand
Interest rates and financing
China rare-earth dominance, subsidy wars and export risks reshape supply chains amid sanctions
Rare-earth prices remain cyclical; global REO mine output ~240,000 t in 2023 with China 60–70% of processing. EVs drove demand—global EV sales ~16m units in 2024—and renewables added ~450 GW in 2024. Fed funds 5.25–5.50% (mid‑2025) lifts WACC ~100–150 bps; project spreads up ~200 bps since 2022, pushing staged capex and hedging.
| Metric | Value |
|---|---|
| REO production 2023 | ~240,000 t |
| China processing | 60–70% |
| EV sales 2024 | ~16m units |
| Renewables 2024 | ~450 GW |
| Fed funds (mid‑2025) | 5.25–5.50% |
Preview the Actual Deliverable
Neo PESTLE Analysis
This Neo PESTLE Analysis preview is the exact document you’ll receive after purchase—fully formatted, professionally structured, and ready to use. The content, layout, and strategic insights shown here are delivered exactly as displayed with no placeholders or teasers. After checkout you can download this final file immediately and begin applying the analysis to your business or investment decisions.











