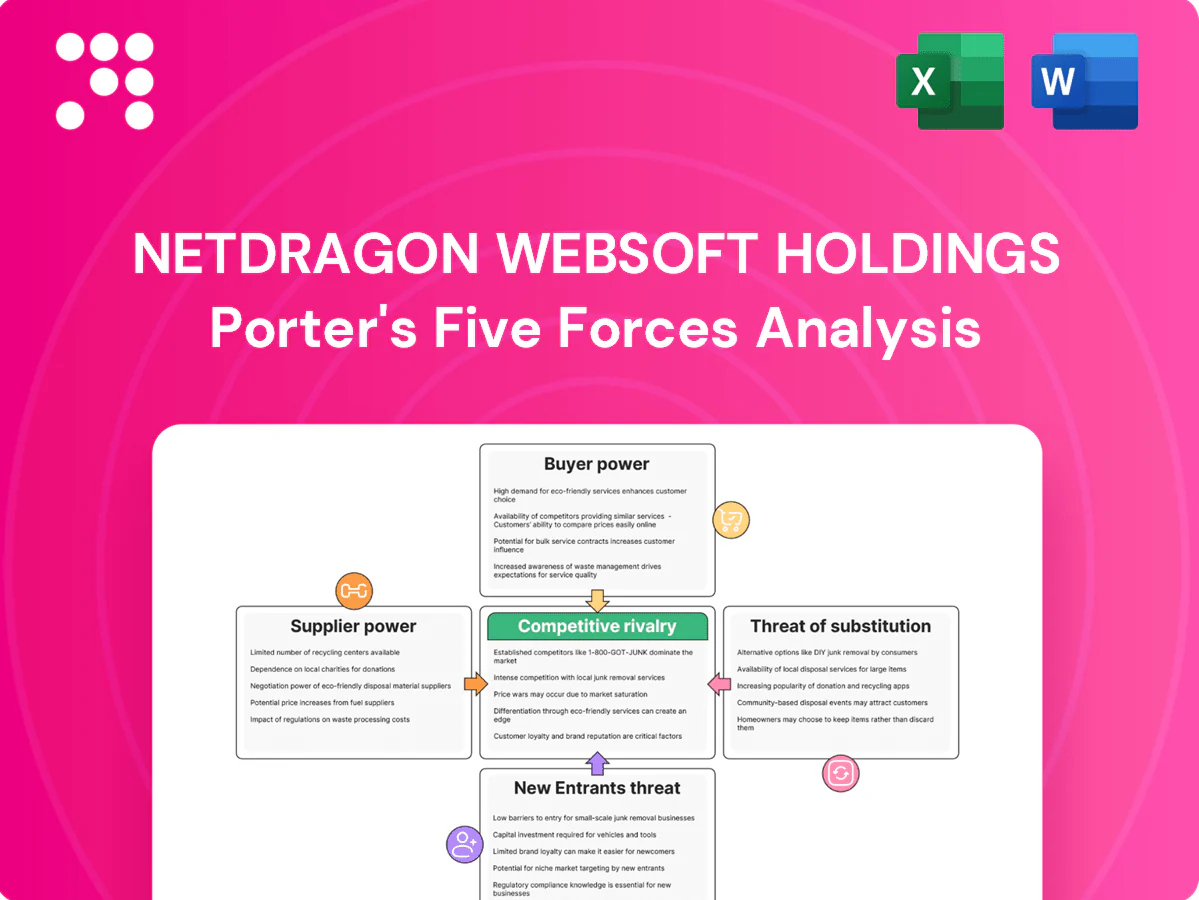
NetDragon Websoft Holdings Porter's Five Forces Analysis

A Must-Have Tool for Decision-Makers
NetDragon Websoft Holdings operates in a dynamic digital education and gaming landscape where supplier leverage, platform power, and rapid tech evolution shape profitability; competition from global game studios and edtech entrants keeps margins under pressure. Unlock the full Porter's Five Forces Analysis to explore NetDragon’s competitive dynamics, market pressures, and strategic advantages in detail.
Suppliers Bargaining Power

Platform and cloud dependence
NetDragon depends on Apple and Google app stores and Chinese Android channels plus cloud vendors for hosting and delivery. Store commissions (up to 30%, 15% for small developers under programs) and sudden policy changes can dent margins and discoverability. Scale improves negotiation leverage but remains limited by platform rules. Diversifying distribution and multi-cloud (AWS ~31%, Azure ~23%, GCP ~10% in 2024) mitigates but does not eliminate exposure.
Game engines and toolchains
Engines like Unity and Unreal heavily shape NetDragon’s development costs and timelines: Unity powers roughly half of mobile games and Unreal’s licensing includes a 5% royalty after the first 1 million USD gross per product, so licensing shifts (Unity’s 2023 runtime fee controversy) can abruptly change cost structures. Building proprietary tech reduces this reliance but requires sustained multi-year R&D and tens of millions in investment, while ecosystem lock-in gives suppliers moderate bargaining power.

Content IP and licensing
Third-party IP can boost user acquisition but raises royalty burdens—licensing fees in games commonly range around 10–20% of gross revenues, increasing content costs. Popular IP holders exert stronger bargaining power due to scarcity and proven user appeal, driving up upfront guarantees and minimums. Developing original IP reduces licensing dependence but increases marketing risk and promotional spend. Net exposure depends on portfolio balance between licensed hits and owned franchises.

Talent and specialized creators
Skilled developers, designers and educational content creators are critical inputs for NetDragon, driving product quality and IP; rising market wages and competition from tech and gaming peers elevate hiring and retention costs. Remote work expands talent pools but intensifies global bidding, increasing total compensation pressure. Strong corporate culture and equity incentives remain key levers to mitigate this supplier-like power.
- Skilled talent = critical input
- Rising wages and peer competition raise costs
- Remote work widens pool, increases bidding
- Culture + stock incentives reduce attrition risk
Hardware and VR ecosystem
VR device makers and component suppliers shape NetDragon’s user reach and performance through SoC, display and tracking quality; fragmented standards and evolving SDKs raise integration overhead and prolong time-to-market, while hardware cycles and pricing directly influence classroom and gaming adoption. Strategic partnerships secure device access but rarely allow NetDragon to dictate terms to major OEMs.
- Supply concentration: OEMs/SoC vendors
- Integration cost: SDK fragmentation
- Adoption driver: hardware cycles/pricing
- Partnership limits: access not pricing power
Suppliers compress margins: app stores 30%/15%, cloud fees and engine royalties.
Suppliers exert moderate-to-high bargaining power: app stores (30%/15% rates) and cloud providers (AWS 31%, Azure 23%, GCP 10% in 2024) constrain margins and distribution. Engine licensors (Unity ~50% mobile; Unreal 5% royalty >$1M) and IP holders (10–20% royalties) raise content costs. Talent, OEMs and VR components add wage, integration and hardware pricing risks, partially mitigated by scale and partnerships.
| Supplier | Key metric (2024) |
|---|---|
| App stores | 30%/15% fees |
| Cloud | AWS 31%, Azure 23%, GCP 10% |
| Engines | Unity ~50% mobile; Unreal 5% royalty |
| IP | Licensing 10–20% |
What is included in the product
 Detailed Word Document
Tailored Porter's Five Forces analysis of NetDragon Websoft Holdings uncovering competitive intensity, buyer and supplier power, threat of new entrants and substitutes, and disruptive digital threats; delivers strategic insights on pricing leverage, market-entry barriers, and avenues to protect and grow NetDragon's market position.

 Customizable Excel Spreadsheet
A clear one-sheet Porter's Five Forces summary for NetDragon Websoft Holdings—customize pressure levels with up-to-date data and visualize strategic intensity with a ready-to-copy spider chart for decks and boardrooms.
Customers Bargaining Power

Player switching ease
Gamers face low switching costs across free-to-play titles, with free-to-play accounting for roughly 90% of mobile game installs in 2024, enabling rapid churn. Content cadence and live-ops quality drive retention: average Day-7 retention hovered around 15% in 2024, so regular events materially reduce defections. Price sensitivity rises when monetization feels aggressive, while strong community and progression systems can raise effective switching barriers.
Institutional education buyers
Institutional buyers run formal RFPs and compliance checks, strengthening their bargaining power; the global edtech market reached about $150 billion in 2024, concentrating buyer leverage. Volume contracts commonly secure discounts up to 20% and strict SLAs. Procurement often involves pilots and 6–12 month sales cycles, and curriculum integration post-deployment modestly raises switching costs, reducing churn.

Global price transparency
Global price transparency from digital storefronts and SaaS models makes NetDragon customers compare pricing and bundles in real time; by 2024 global SaaS revenue exceeded $200 billion, intensifying benchmark-driven buying. Buyers push for bundles, freemium tiers and promo discounts while multi-year deals increasingly hinge on demonstrated outcomes and analytics. Clear ROI narratives and dashboards reduce discount pressure by quantifying value.

Content quality expectations
Players and educators demand polished UX, localized content and enterprise-grade uptime—many platforms target 99.9% availability; failures rapidly trigger churn and negative reviews. Continuous content updates and live ops are necessary to sustain engagement, with McKinsey noting personalization can boost revenues by up to 15%. Data-driven personalization further raises baseline expectations for relevance and responsiveness.
- UX polish: retention impact
- Localization: market entry barrier
- Uptime: 99.9% SLA expectation
- Personalization: +up to 15% revenue (McKinsey)
Network and community influence
Communities amplify word-of-mouth within NetDragon ecosystems, accelerating adoption or defection as guilds, classrooms and teacher forums coordinate preferences and collective switching. Social features anchor users by increasing switching costs but can also spread dissatisfaction rapidly, making community sentiment a direct lever on customer bargaining power. Active community management can dampen abrupt buyer-power swings and preserve monetization.
- Communities amplify word-of-mouth
- Guilds/classrooms coordinate preferences
- Social features increase retention and risk
- Active moderation reduces buyer power swings
High buyer power: 90% F2P; personalization lifts rev +15%
Customers hold elevated bargaining power: 90% of mobile installs were free-to-play in 2024 driving low switching costs and price sensitivity; institutional edtech buyers (global market ~$150B in 2024) secure discounts up to 20% and long sales cycles; strong UX, communities and personalization (McKinsey: +15% revenue) raise switching costs and reduce discount pressure.
| Metric | 2024 |
|---|---|
| F2P mobile share | 90% |
| Day-7 retention | ~15% |
| Edtech market | $150B |
| Typical discount | up to 20% |
| Personalization uplift | +15% |
Preview the Actual Deliverable
NetDragon Websoft Holdings Porter's Five Forces Analysis
This preview shows the exact NetDragon Websoft Holdings Porter's Five Forces Analysis you'll receive upon purchase—fully written and formatted. No samples or placeholders; the file available for download is identical. Use it immediately for research, valuation, or strategy work.

A Must-Have Tool for Decision-Makers
NetDragon Websoft Holdings operates in a dynamic digital education and gaming landscape where supplier leverage, platform power, and rapid tech evolution shape profitability; competition from global game studios and edtech entrants keeps margins under pressure. Unlock the full Porter's Five Forces Analysis to explore NetDragon’s competitive dynamics, market pressures, and strategic advantages in detail.
Suppliers Bargaining Power
Platform and cloud dependence
NetDragon depends on Apple and Google app stores and Chinese Android channels plus cloud vendors for hosting and delivery. Store commissions (up to 30%, 15% for small developers under programs) and sudden policy changes can dent margins and discoverability. Scale improves negotiation leverage but remains limited by platform rules. Diversifying distribution and multi-cloud (AWS ~31%, Azure ~23%, GCP ~10% in 2024) mitigates but does not eliminate exposure.
Game engines and toolchains
Engines like Unity and Unreal heavily shape NetDragon’s development costs and timelines: Unity powers roughly half of mobile games and Unreal’s licensing includes a 5% royalty after the first 1 million USD gross per product, so licensing shifts (Unity’s 2023 runtime fee controversy) can abruptly change cost structures. Building proprietary tech reduces this reliance but requires sustained multi-year R&D and tens of millions in investment, while ecosystem lock-in gives suppliers moderate bargaining power.
Content IP and licensing
Third-party IP can boost user acquisition but raises royalty burdens—licensing fees in games commonly range around 10–20% of gross revenues, increasing content costs. Popular IP holders exert stronger bargaining power due to scarcity and proven user appeal, driving up upfront guarantees and minimums. Developing original IP reduces licensing dependence but increases marketing risk and promotional spend. Net exposure depends on portfolio balance between licensed hits and owned franchises.
Talent and specialized creators
Skilled developers, designers and educational content creators are critical inputs for NetDragon, driving product quality and IP; rising market wages and competition from tech and gaming peers elevate hiring and retention costs. Remote work expands talent pools but intensifies global bidding, increasing total compensation pressure. Strong corporate culture and equity incentives remain key levers to mitigate this supplier-like power.
- Skilled talent = critical input
- Rising wages and peer competition raise costs
- Remote work widens pool, increases bidding
- Culture + stock incentives reduce attrition risk
Hardware and VR ecosystem
VR device makers and component suppliers shape NetDragon’s user reach and performance through SoC, display and tracking quality; fragmented standards and evolving SDKs raise integration overhead and prolong time-to-market, while hardware cycles and pricing directly influence classroom and gaming adoption. Strategic partnerships secure device access but rarely allow NetDragon to dictate terms to major OEMs.
- Supply concentration: OEMs/SoC vendors
- Integration cost: SDK fragmentation
- Adoption driver: hardware cycles/pricing
- Partnership limits: access not pricing power
Suppliers compress margins: app stores 30%/15%, cloud fees and engine royalties.
Suppliers exert moderate-to-high bargaining power: app stores (30%/15% rates) and cloud providers (AWS 31%, Azure 23%, GCP 10% in 2024) constrain margins and distribution. Engine licensors (Unity ~50% mobile; Unreal 5% royalty >$1M) and IP holders (10–20% royalties) raise content costs. Talent, OEMs and VR components add wage, integration and hardware pricing risks, partially mitigated by scale and partnerships.
| Supplier | Key metric (2024) |
|---|---|
| App stores | 30%/15% fees |
| Cloud | AWS 31%, Azure 23%, GCP 10% |
| Engines | Unity ~50% mobile; Unreal 5% royalty |
| IP | Licensing 10–20% |
What is included in the product
Detailed Word Document
Tailored Porter's Five Forces analysis of NetDragon Websoft Holdings uncovering competitive intensity, buyer and supplier power, threat of new entrants and substitutes, and disruptive digital threats; delivers strategic insights on pricing leverage, market-entry barriers, and avenues to protect and grow NetDragon's market position.
Customizable Excel Spreadsheet
A clear one-sheet Porter's Five Forces summary for NetDragon Websoft Holdings—customize pressure levels with up-to-date data and visualize strategic intensity with a ready-to-copy spider chart for decks and boardrooms.
Customers Bargaining Power
Player switching ease
Gamers face low switching costs across free-to-play titles, with free-to-play accounting for roughly 90% of mobile game installs in 2024, enabling rapid churn. Content cadence and live-ops quality drive retention: average Day-7 retention hovered around 15% in 2024, so regular events materially reduce defections. Price sensitivity rises when monetization feels aggressive, while strong community and progression systems can raise effective switching barriers.
Institutional education buyers
Institutional buyers run formal RFPs and compliance checks, strengthening their bargaining power; the global edtech market reached about $150 billion in 2024, concentrating buyer leverage. Volume contracts commonly secure discounts up to 20% and strict SLAs. Procurement often involves pilots and 6–12 month sales cycles, and curriculum integration post-deployment modestly raises switching costs, reducing churn.
Global price transparency
Global price transparency from digital storefronts and SaaS models makes NetDragon customers compare pricing and bundles in real time; by 2024 global SaaS revenue exceeded $200 billion, intensifying benchmark-driven buying. Buyers push for bundles, freemium tiers and promo discounts while multi-year deals increasingly hinge on demonstrated outcomes and analytics. Clear ROI narratives and dashboards reduce discount pressure by quantifying value.
Content quality expectations
Players and educators demand polished UX, localized content and enterprise-grade uptime—many platforms target 99.9% availability; failures rapidly trigger churn and negative reviews. Continuous content updates and live ops are necessary to sustain engagement, with McKinsey noting personalization can boost revenues by up to 15%. Data-driven personalization further raises baseline expectations for relevance and responsiveness.
- UX polish: retention impact
- Localization: market entry barrier
- Uptime: 99.9% SLA expectation
- Personalization: +up to 15% revenue (McKinsey)
Network and community influence
Communities amplify word-of-mouth within NetDragon ecosystems, accelerating adoption or defection as guilds, classrooms and teacher forums coordinate preferences and collective switching. Social features anchor users by increasing switching costs but can also spread dissatisfaction rapidly, making community sentiment a direct lever on customer bargaining power. Active community management can dampen abrupt buyer-power swings and preserve monetization.
- Communities amplify word-of-mouth
- Guilds/classrooms coordinate preferences
- Social features increase retention and risk
- Active moderation reduces buyer power swings
High buyer power: 90% F2P; personalization lifts rev +15%
Customers hold elevated bargaining power: 90% of mobile installs were free-to-play in 2024 driving low switching costs and price sensitivity; institutional edtech buyers (global market ~$150B in 2024) secure discounts up to 20% and long sales cycles; strong UX, communities and personalization (McKinsey: +15% revenue) raise switching costs and reduce discount pressure.
| Metric | 2024 |
|---|---|
| F2P mobile share | 90% |
| Day-7 retention | ~15% |
| Edtech market | $150B |
| Typical discount | up to 20% |
| Personalization uplift | +15% |
Preview the Actual Deliverable
NetDragon Websoft Holdings Porter's Five Forces Analysis
This preview shows the exact NetDragon Websoft Holdings Porter's Five Forces Analysis you'll receive upon purchase—fully written and formatted. No samples or placeholders; the file available for download is identical. Use it immediately for research, valuation, or strategy work.
Original: $10.00
-65%$10.00
$3.50Description
A Must-Have Tool for Decision-Makers
NetDragon Websoft Holdings operates in a dynamic digital education and gaming landscape where supplier leverage, platform power, and rapid tech evolution shape profitability; competition from global game studios and edtech entrants keeps margins under pressure. Unlock the full Porter's Five Forces Analysis to explore NetDragon’s competitive dynamics, market pressures, and strategic advantages in detail.
Suppliers Bargaining Power
Platform and cloud dependence
NetDragon depends on Apple and Google app stores and Chinese Android channels plus cloud vendors for hosting and delivery. Store commissions (up to 30%, 15% for small developers under programs) and sudden policy changes can dent margins and discoverability. Scale improves negotiation leverage but remains limited by platform rules. Diversifying distribution and multi-cloud (AWS ~31%, Azure ~23%, GCP ~10% in 2024) mitigates but does not eliminate exposure.
Game engines and toolchains
Engines like Unity and Unreal heavily shape NetDragon’s development costs and timelines: Unity powers roughly half of mobile games and Unreal’s licensing includes a 5% royalty after the first 1 million USD gross per product, so licensing shifts (Unity’s 2023 runtime fee controversy) can abruptly change cost structures. Building proprietary tech reduces this reliance but requires sustained multi-year R&D and tens of millions in investment, while ecosystem lock-in gives suppliers moderate bargaining power.
Content IP and licensing
Third-party IP can boost user acquisition but raises royalty burdens—licensing fees in games commonly range around 10–20% of gross revenues, increasing content costs. Popular IP holders exert stronger bargaining power due to scarcity and proven user appeal, driving up upfront guarantees and minimums. Developing original IP reduces licensing dependence but increases marketing risk and promotional spend. Net exposure depends on portfolio balance between licensed hits and owned franchises.
Talent and specialized creators
Skilled developers, designers and educational content creators are critical inputs for NetDragon, driving product quality and IP; rising market wages and competition from tech and gaming peers elevate hiring and retention costs. Remote work expands talent pools but intensifies global bidding, increasing total compensation pressure. Strong corporate culture and equity incentives remain key levers to mitigate this supplier-like power.
- Skilled talent = critical input
- Rising wages and peer competition raise costs
- Remote work widens pool, increases bidding
- Culture + stock incentives reduce attrition risk
Hardware and VR ecosystem
VR device makers and component suppliers shape NetDragon’s user reach and performance through SoC, display and tracking quality; fragmented standards and evolving SDKs raise integration overhead and prolong time-to-market, while hardware cycles and pricing directly influence classroom and gaming adoption. Strategic partnerships secure device access but rarely allow NetDragon to dictate terms to major OEMs.
- Supply concentration: OEMs/SoC vendors
- Integration cost: SDK fragmentation
- Adoption driver: hardware cycles/pricing
- Partnership limits: access not pricing power
Suppliers compress margins: app stores 30%/15%, cloud fees and engine royalties.
Suppliers exert moderate-to-high bargaining power: app stores (30%/15% rates) and cloud providers (AWS 31%, Azure 23%, GCP 10% in 2024) constrain margins and distribution. Engine licensors (Unity ~50% mobile; Unreal 5% royalty >$1M) and IP holders (10–20% royalties) raise content costs. Talent, OEMs and VR components add wage, integration and hardware pricing risks, partially mitigated by scale and partnerships.
| Supplier | Key metric (2024) |
|---|---|
| App stores | 30%/15% fees |
| Cloud | AWS 31%, Azure 23%, GCP 10% |
| Engines | Unity ~50% mobile; Unreal 5% royalty |
| IP | Licensing 10–20% |
What is included in the product
Detailed Word Document
Tailored Porter's Five Forces analysis of NetDragon Websoft Holdings uncovering competitive intensity, buyer and supplier power, threat of new entrants and substitutes, and disruptive digital threats; delivers strategic insights on pricing leverage, market-entry barriers, and avenues to protect and grow NetDragon's market position.
Customizable Excel Spreadsheet
A clear one-sheet Porter's Five Forces summary for NetDragon Websoft Holdings—customize pressure levels with up-to-date data and visualize strategic intensity with a ready-to-copy spider chart for decks and boardrooms.
Customers Bargaining Power
Player switching ease
Gamers face low switching costs across free-to-play titles, with free-to-play accounting for roughly 90% of mobile game installs in 2024, enabling rapid churn. Content cadence and live-ops quality drive retention: average Day-7 retention hovered around 15% in 2024, so regular events materially reduce defections. Price sensitivity rises when monetization feels aggressive, while strong community and progression systems can raise effective switching barriers.
Institutional education buyers
Institutional buyers run formal RFPs and compliance checks, strengthening their bargaining power; the global edtech market reached about $150 billion in 2024, concentrating buyer leverage. Volume contracts commonly secure discounts up to 20% and strict SLAs. Procurement often involves pilots and 6–12 month sales cycles, and curriculum integration post-deployment modestly raises switching costs, reducing churn.
Global price transparency
Global price transparency from digital storefronts and SaaS models makes NetDragon customers compare pricing and bundles in real time; by 2024 global SaaS revenue exceeded $200 billion, intensifying benchmark-driven buying. Buyers push for bundles, freemium tiers and promo discounts while multi-year deals increasingly hinge on demonstrated outcomes and analytics. Clear ROI narratives and dashboards reduce discount pressure by quantifying value.
Content quality expectations
Players and educators demand polished UX, localized content and enterprise-grade uptime—many platforms target 99.9% availability; failures rapidly trigger churn and negative reviews. Continuous content updates and live ops are necessary to sustain engagement, with McKinsey noting personalization can boost revenues by up to 15%. Data-driven personalization further raises baseline expectations for relevance and responsiveness.
- UX polish: retention impact
- Localization: market entry barrier
- Uptime: 99.9% SLA expectation
- Personalization: +up to 15% revenue (McKinsey)
Network and community influence
Communities amplify word-of-mouth within NetDragon ecosystems, accelerating adoption or defection as guilds, classrooms and teacher forums coordinate preferences and collective switching. Social features anchor users by increasing switching costs but can also spread dissatisfaction rapidly, making community sentiment a direct lever on customer bargaining power. Active community management can dampen abrupt buyer-power swings and preserve monetization.
- Communities amplify word-of-mouth
- Guilds/classrooms coordinate preferences
- Social features increase retention and risk
- Active moderation reduces buyer power swings
High buyer power: 90% F2P; personalization lifts rev +15%
Customers hold elevated bargaining power: 90% of mobile installs were free-to-play in 2024 driving low switching costs and price sensitivity; institutional edtech buyers (global market ~$150B in 2024) secure discounts up to 20% and long sales cycles; strong UX, communities and personalization (McKinsey: +15% revenue) raise switching costs and reduce discount pressure.
| Metric | 2024 |
|---|---|
| F2P mobile share | 90% |
| Day-7 retention | ~15% |
| Edtech market | $150B |
| Typical discount | up to 20% |
| Personalization uplift | +15% |
Preview the Actual Deliverable
NetDragon Websoft Holdings Porter's Five Forces Analysis
This preview shows the exact NetDragon Websoft Holdings Porter's Five Forces Analysis you'll receive upon purchase—fully written and formatted. No samples or placeholders; the file available for download is identical. Use it immediately for research, valuation, or strategy work.











