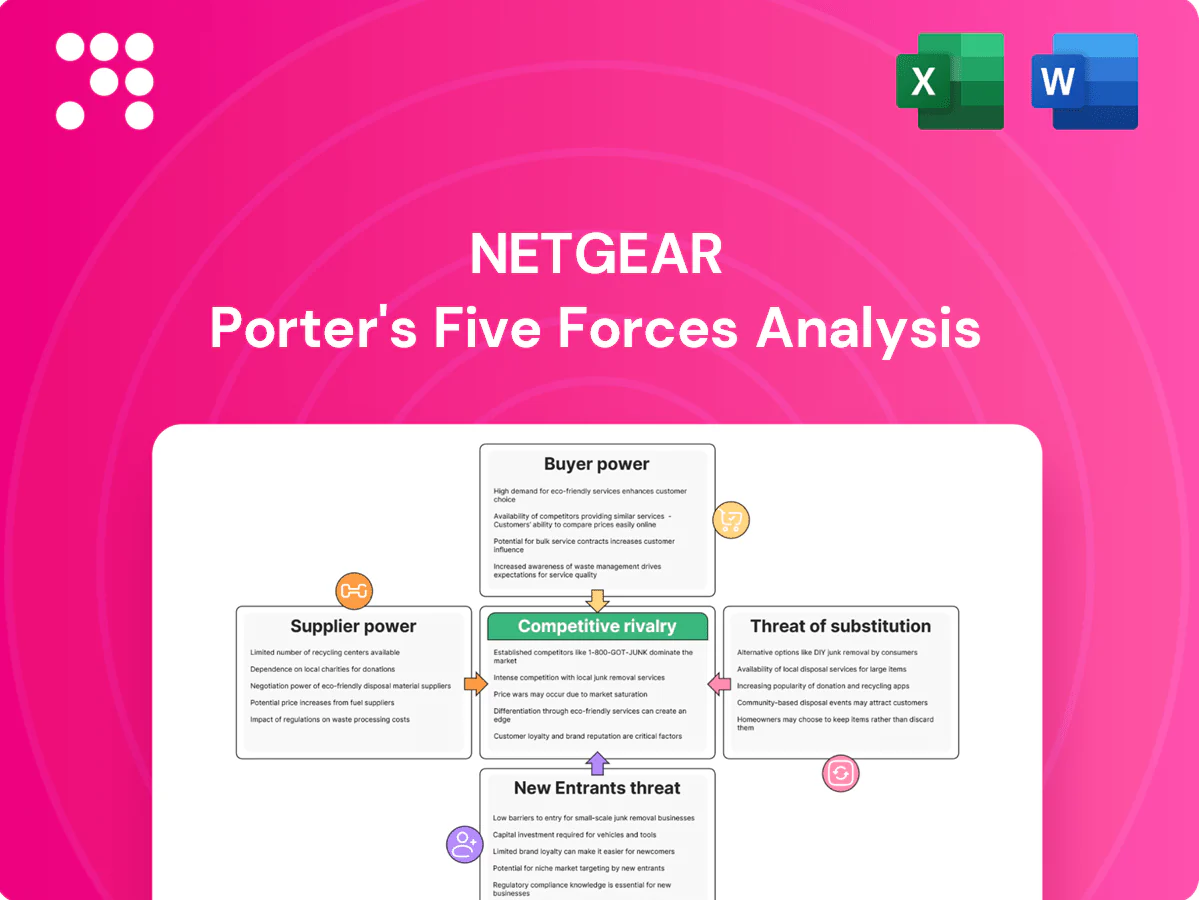
Netgear Porter's Five Forces Analysis

A Must-Have Tool for Decision-Makers
Netgear faces intense competitive rivalry, evolving buyer expectations, and supplier dynamics that shape margin pressure and innovation needs; threat of substitutes and moderate entry barriers further complicate strategy. This brief snapshot only scratches the surface. Unlock the full Porter's Five Forces Analysis to explore Netgear’s competitive dynamics in detail.
Suppliers Bargaining Power

Concentrated chip vendors
Core Wi‑Fi chipsets for NETGEAR come from a concentrated set—Broadcom, Qualcomm, Intel and MediaTek—together accounting for an estimated >85% of access‑point and client chipset supply (IDC 2024), limiting alternatives and raising switching costs and lead times. Vendor roadmaps therefore directly shape NETGEAR’s product timing and feature set. Any supply constraint or pricing move by these vendors can quickly compress NETGEAR’s gross margins.
Contract manufacturing reliance
NETGEAR’s heavy reliance on ODMs/EMS concentrates operational risk, as repeat 2024 industry reports show EMS lead times stretching to 20+ weeks and capacity often favoring larger customers, risking allocation and yield shortfalls for NETGEAR. Critical design-for-manufacture expertise sits with suppliers, increasing dependency and making mid-cycle renegotiation of terms or costs difficult.

Software and firmware inputs
Proprietary SDKs, drivers and security stacks are commonly tied to dominant silicon vendors—Broadcom's data‑center switch ASICs held roughly 60–70% share in 2023–24—so licensing and support terms directly affect development velocity and cost. Security patching and CVE response frequently depend on vendor timelines, extending mean remediation from weeks to months, which strengthens supplier leverage over Netgear.

Logistics and component volatility
Global freight, PCB substrate and memory markets remained cyclical through 2024, with spot-price spikes eroding product gross margins and squeezing Netgear when contract pricing lagged; multi-sourcing mitigates but cannot remove supply shocks. Lead-time variability, often 4–26 weeks, complicates forecasting and forces higher safety inventory.
- Freight volatility
- PCB/substrate cycles
- Memory price swings
- 4–26 week lead-times
Standards and certification gatekeepers
Standards and certification gatekeepers concentrate supplier power for Netgear: compliance with Wi‑Fi Alliance, FCC/CE and regional agencies requires supplier support for radio ICs and reference designs, and delays in supplier-delivered certification packages have stalled product launches; Netgear reported roughly $1.87B revenue in FY2024, increasing the cost of missed windows. Early access to next‑gen standards (Wi‑Fi 7 trial silicon in 2024) was often gated by key RF vendors, creating leverage for preferred suppliers.
- Key facts: Netgear FY2024 revenue ~$1.87B
- Wi‑Fi Alliance membership >900 (2024)
- Certification delays can add weeks to time‑to‑market
Supplier concentration (over 85%) and 20+ weeks EMS lead times squeeze margins for $1.87B firm
Supplier concentration (Broadcom/Qualcomm/Intel/MediaTek >85% of Wi‑Fi chipsets) and ODM/EMS dependence (EMS lead times 20+ weeks) gives suppliers strong leverage, affecting NETGEAR’s timing, features and margins (FY2024 revenue ~$1.87B). Memory/PCB/freight cycles (lead times 4–26 weeks) further raise costs and inventory needs.
| Metric | Value |
|---|---|
| Chipset share | >85% |
| EMS lead time | 20+ weeks |
| FY2024 rev | $1.87B |
What is included in the product
 Detailed Word Document
Uncovers competitive drivers, buyer and supplier influence, threat of substitutes and entry risks specific to Netgear, highlighting disruptive forces, pricing power and strategic defenses.

 Customizable Excel Spreadsheet
A concise Porter's Five Forces one-sheet for Netgear that visualizes competitive pressure with an interactive spider chart, lets you toggle supplier/buyer power and threat levels, and exports clean slides—no macros or finance expertise required.
Customers Bargaining Power

Retail giants’ leverage
Channels like Amazon (≈39% of US e‑commerce in 2024) and Best Buy (FY2024 revenue ≈$46B) plus large distributors dictate terms, placement and promotions, often demanding MDF, price protection and accelerated RMA handling; NETGEAR’s on‑shelf and online visibility hinges on cooperation, so these partners’ scale materially amplifies their bargaining power over NETGEAR.
ISP and MSP customers
ISP and MSP customers buy CPE and networking kit in large volumes and negotiate aggressively, with top-tier contracts often 3–5 years, concentrating pricing risk for vendors. As of 2024 the global managed services market exceeded $250 billion, giving buyers scale leverage and option to dual-source or shift to OEM-branded CPE. Their feature roadmaps frequently shape vendor product priorities.

Price-sensitive consumers/SMBs
End users and SMBs routinely compare throughput, Wi‑Fi standards and price‑per‑feature, turning routers/APs into highly price‑sensitive buys; peak promotions in 2024 commonly offered 30–50% discounts, training buyers to wait for deals. Switching costs for consumer and SMB routers remain modest, easing churn. Prolific reviews and benchmark sites (SmallNetBuilder, TechRadar) increase transparency and intensify price competition.

Low switching frictions
Standards-based interoperability (eg Wi‑Fi protocols) reduces vendor lock-in, while intuitive setup apps and migration tools make brand switching straightforward; Netgear reported $1.38B revenue in FY2023, highlighting large consumer mobility and competitive pressure. Warranty and support vary but rarely block switches, keeping buyer power elevated as consumers chase features and price.
- Standards reduce lock-in
- Setup apps ease migration
- Warranties matter but not prohibitive
- Buyer power remains high
Demand for integrated solutions
Buyers increasingly demand seamless mesh, built-in security and parental controls, with a 2024 survey showing 58% rank integrated features as a top purchase driver. If Netgear value-added services underperform, customers can switch to competitors like eero or Nest; subscription fatigue (rising cancellation rates in 2023–24) nudges some toward cheaper hardware-only options. These preferences constrain pricing power and force tighter bundling of hardware and services.
- 58% prioritize mesh/security (2024 survey)
- Switch risk: eero, Nest
- Subscription fatigue → hardware-only buys
- Impacts pricing and bundling
Channel discounts and MSP contracts concentrate pricing power while buyers keep leverage
Large channels (Amazon ≈39% US e‑commerce 2024; Best Buy FY2024 revenue ≈$46B) and distributors extract MDF, placement and price concessions, amplifying buyer leverage. ISPs/MSPs (global managed services >$250B in 2024) negotiate volume contracts and shape roadmaps, concentrating pricing risk. Consumers/SMBs are price‑sensitive (58% rank integrated mesh/security top driver in 2024), low switching costs keep bargaining power high.
| Metric | 2023–24 Value |
|---|---|
| Amazon US e‑commerce share | ≈39% (2024) |
| Best Buy revenue | ≈$46B (FY2024) |
| Managed services market | >$250B (2024) |
| Netgear revenue | $1.38B (FY2023) |
| Buyers prioritizing mesh/security | 58% (2024 survey) |
Preview Before You Purchase
Netgear Porter's Five Forces Analysis
This preview displays the exact Netgear Porter’s Five Forces Analysis you’ll receive immediately after purchase—no placeholders or samples. The file is fully formatted, ready to download and use, and contains complete assessments of competitive rivalry, supplier and buyer power, threat of entry and substitutes, plus strategic implications. You’ll get this identical, final document instantly after payment.

A Must-Have Tool for Decision-Makers
Netgear faces intense competitive rivalry, evolving buyer expectations, and supplier dynamics that shape margin pressure and innovation needs; threat of substitutes and moderate entry barriers further complicate strategy. This brief snapshot only scratches the surface. Unlock the full Porter's Five Forces Analysis to explore Netgear’s competitive dynamics in detail.
Suppliers Bargaining Power
Concentrated chip vendors
Core Wi‑Fi chipsets for NETGEAR come from a concentrated set—Broadcom, Qualcomm, Intel and MediaTek—together accounting for an estimated >85% of access‑point and client chipset supply (IDC 2024), limiting alternatives and raising switching costs and lead times. Vendor roadmaps therefore directly shape NETGEAR’s product timing and feature set. Any supply constraint or pricing move by these vendors can quickly compress NETGEAR’s gross margins.
Contract manufacturing reliance
NETGEAR’s heavy reliance on ODMs/EMS concentrates operational risk, as repeat 2024 industry reports show EMS lead times stretching to 20+ weeks and capacity often favoring larger customers, risking allocation and yield shortfalls for NETGEAR. Critical design-for-manufacture expertise sits with suppliers, increasing dependency and making mid-cycle renegotiation of terms or costs difficult.
Software and firmware inputs
Proprietary SDKs, drivers and security stacks are commonly tied to dominant silicon vendors—Broadcom's data‑center switch ASICs held roughly 60–70% share in 2023–24—so licensing and support terms directly affect development velocity and cost. Security patching and CVE response frequently depend on vendor timelines, extending mean remediation from weeks to months, which strengthens supplier leverage over Netgear.
Logistics and component volatility
Global freight, PCB substrate and memory markets remained cyclical through 2024, with spot-price spikes eroding product gross margins and squeezing Netgear when contract pricing lagged; multi-sourcing mitigates but cannot remove supply shocks. Lead-time variability, often 4–26 weeks, complicates forecasting and forces higher safety inventory.
- Freight volatility
- PCB/substrate cycles
- Memory price swings
- 4–26 week lead-times
Standards and certification gatekeepers
Standards and certification gatekeepers concentrate supplier power for Netgear: compliance with Wi‑Fi Alliance, FCC/CE and regional agencies requires supplier support for radio ICs and reference designs, and delays in supplier-delivered certification packages have stalled product launches; Netgear reported roughly $1.87B revenue in FY2024, increasing the cost of missed windows. Early access to next‑gen standards (Wi‑Fi 7 trial silicon in 2024) was often gated by key RF vendors, creating leverage for preferred suppliers.
- Key facts: Netgear FY2024 revenue ~$1.87B
- Wi‑Fi Alliance membership >900 (2024)
- Certification delays can add weeks to time‑to‑market
Supplier concentration (over 85%) and 20+ weeks EMS lead times squeeze margins for $1.87B firm
Supplier concentration (Broadcom/Qualcomm/Intel/MediaTek >85% of Wi‑Fi chipsets) and ODM/EMS dependence (EMS lead times 20+ weeks) gives suppliers strong leverage, affecting NETGEAR’s timing, features and margins (FY2024 revenue ~$1.87B). Memory/PCB/freight cycles (lead times 4–26 weeks) further raise costs and inventory needs.
| Metric | Value |
|---|---|
| Chipset share | >85% |
| EMS lead time | 20+ weeks |
| FY2024 rev | $1.87B |
What is included in the product
Detailed Word Document
Uncovers competitive drivers, buyer and supplier influence, threat of substitutes and entry risks specific to Netgear, highlighting disruptive forces, pricing power and strategic defenses.
Customizable Excel Spreadsheet
A concise Porter's Five Forces one-sheet for Netgear that visualizes competitive pressure with an interactive spider chart, lets you toggle supplier/buyer power and threat levels, and exports clean slides—no macros or finance expertise required.
Customers Bargaining Power
Retail giants’ leverage
Channels like Amazon (≈39% of US e‑commerce in 2024) and Best Buy (FY2024 revenue ≈$46B) plus large distributors dictate terms, placement and promotions, often demanding MDF, price protection and accelerated RMA handling; NETGEAR’s on‑shelf and online visibility hinges on cooperation, so these partners’ scale materially amplifies their bargaining power over NETGEAR.
ISP and MSP customers
ISP and MSP customers buy CPE and networking kit in large volumes and negotiate aggressively, with top-tier contracts often 3–5 years, concentrating pricing risk for vendors. As of 2024 the global managed services market exceeded $250 billion, giving buyers scale leverage and option to dual-source or shift to OEM-branded CPE. Their feature roadmaps frequently shape vendor product priorities.
Price-sensitive consumers/SMBs
End users and SMBs routinely compare throughput, Wi‑Fi standards and price‑per‑feature, turning routers/APs into highly price‑sensitive buys; peak promotions in 2024 commonly offered 30–50% discounts, training buyers to wait for deals. Switching costs for consumer and SMB routers remain modest, easing churn. Prolific reviews and benchmark sites (SmallNetBuilder, TechRadar) increase transparency and intensify price competition.
Low switching frictions
Standards-based interoperability (eg Wi‑Fi protocols) reduces vendor lock-in, while intuitive setup apps and migration tools make brand switching straightforward; Netgear reported $1.38B revenue in FY2023, highlighting large consumer mobility and competitive pressure. Warranty and support vary but rarely block switches, keeping buyer power elevated as consumers chase features and price.
- Standards reduce lock-in
- Setup apps ease migration
- Warranties matter but not prohibitive
- Buyer power remains high
Demand for integrated solutions
Buyers increasingly demand seamless mesh, built-in security and parental controls, with a 2024 survey showing 58% rank integrated features as a top purchase driver. If Netgear value-added services underperform, customers can switch to competitors like eero or Nest; subscription fatigue (rising cancellation rates in 2023–24) nudges some toward cheaper hardware-only options. These preferences constrain pricing power and force tighter bundling of hardware and services.
- 58% prioritize mesh/security (2024 survey)
- Switch risk: eero, Nest
- Subscription fatigue → hardware-only buys
- Impacts pricing and bundling
Channel discounts and MSP contracts concentrate pricing power while buyers keep leverage
Large channels (Amazon ≈39% US e‑commerce 2024; Best Buy FY2024 revenue ≈$46B) and distributors extract MDF, placement and price concessions, amplifying buyer leverage. ISPs/MSPs (global managed services >$250B in 2024) negotiate volume contracts and shape roadmaps, concentrating pricing risk. Consumers/SMBs are price‑sensitive (58% rank integrated mesh/security top driver in 2024), low switching costs keep bargaining power high.
| Metric | 2023–24 Value |
|---|---|
| Amazon US e‑commerce share | ≈39% (2024) |
| Best Buy revenue | ≈$46B (FY2024) |
| Managed services market | >$250B (2024) |
| Netgear revenue | $1.38B (FY2023) |
| Buyers prioritizing mesh/security | 58% (2024 survey) |
Preview Before You Purchase
Netgear Porter's Five Forces Analysis
This preview displays the exact Netgear Porter’s Five Forces Analysis you’ll receive immediately after purchase—no placeholders or samples. The file is fully formatted, ready to download and use, and contains complete assessments of competitive rivalry, supplier and buyer power, threat of entry and substitutes, plus strategic implications. You’ll get this identical, final document instantly after payment.
Original: $10.00
-65%$10.00
$3.50Description
A Must-Have Tool for Decision-Makers
Netgear faces intense competitive rivalry, evolving buyer expectations, and supplier dynamics that shape margin pressure and innovation needs; threat of substitutes and moderate entry barriers further complicate strategy. This brief snapshot only scratches the surface. Unlock the full Porter's Five Forces Analysis to explore Netgear’s competitive dynamics in detail.
Suppliers Bargaining Power
Concentrated chip vendors
Core Wi‑Fi chipsets for NETGEAR come from a concentrated set—Broadcom, Qualcomm, Intel and MediaTek—together accounting for an estimated >85% of access‑point and client chipset supply (IDC 2024), limiting alternatives and raising switching costs and lead times. Vendor roadmaps therefore directly shape NETGEAR’s product timing and feature set. Any supply constraint or pricing move by these vendors can quickly compress NETGEAR’s gross margins.
Contract manufacturing reliance
NETGEAR’s heavy reliance on ODMs/EMS concentrates operational risk, as repeat 2024 industry reports show EMS lead times stretching to 20+ weeks and capacity often favoring larger customers, risking allocation and yield shortfalls for NETGEAR. Critical design-for-manufacture expertise sits with suppliers, increasing dependency and making mid-cycle renegotiation of terms or costs difficult.
Software and firmware inputs
Proprietary SDKs, drivers and security stacks are commonly tied to dominant silicon vendors—Broadcom's data‑center switch ASICs held roughly 60–70% share in 2023–24—so licensing and support terms directly affect development velocity and cost. Security patching and CVE response frequently depend on vendor timelines, extending mean remediation from weeks to months, which strengthens supplier leverage over Netgear.
Logistics and component volatility
Global freight, PCB substrate and memory markets remained cyclical through 2024, with spot-price spikes eroding product gross margins and squeezing Netgear when contract pricing lagged; multi-sourcing mitigates but cannot remove supply shocks. Lead-time variability, often 4–26 weeks, complicates forecasting and forces higher safety inventory.
- Freight volatility
- PCB/substrate cycles
- Memory price swings
- 4–26 week lead-times
Standards and certification gatekeepers
Standards and certification gatekeepers concentrate supplier power for Netgear: compliance with Wi‑Fi Alliance, FCC/CE and regional agencies requires supplier support for radio ICs and reference designs, and delays in supplier-delivered certification packages have stalled product launches; Netgear reported roughly $1.87B revenue in FY2024, increasing the cost of missed windows. Early access to next‑gen standards (Wi‑Fi 7 trial silicon in 2024) was often gated by key RF vendors, creating leverage for preferred suppliers.
- Key facts: Netgear FY2024 revenue ~$1.87B
- Wi‑Fi Alliance membership >900 (2024)
- Certification delays can add weeks to time‑to‑market
Supplier concentration (over 85%) and 20+ weeks EMS lead times squeeze margins for $1.87B firm
Supplier concentration (Broadcom/Qualcomm/Intel/MediaTek >85% of Wi‑Fi chipsets) and ODM/EMS dependence (EMS lead times 20+ weeks) gives suppliers strong leverage, affecting NETGEAR’s timing, features and margins (FY2024 revenue ~$1.87B). Memory/PCB/freight cycles (lead times 4–26 weeks) further raise costs and inventory needs.
| Metric | Value |
|---|---|
| Chipset share | >85% |
| EMS lead time | 20+ weeks |
| FY2024 rev | $1.87B |
What is included in the product
Detailed Word Document
Uncovers competitive drivers, buyer and supplier influence, threat of substitutes and entry risks specific to Netgear, highlighting disruptive forces, pricing power and strategic defenses.
Customizable Excel Spreadsheet
A concise Porter's Five Forces one-sheet for Netgear that visualizes competitive pressure with an interactive spider chart, lets you toggle supplier/buyer power and threat levels, and exports clean slides—no macros or finance expertise required.
Customers Bargaining Power
Retail giants’ leverage
Channels like Amazon (≈39% of US e‑commerce in 2024) and Best Buy (FY2024 revenue ≈$46B) plus large distributors dictate terms, placement and promotions, often demanding MDF, price protection and accelerated RMA handling; NETGEAR’s on‑shelf and online visibility hinges on cooperation, so these partners’ scale materially amplifies their bargaining power over NETGEAR.
ISP and MSP customers
ISP and MSP customers buy CPE and networking kit in large volumes and negotiate aggressively, with top-tier contracts often 3–5 years, concentrating pricing risk for vendors. As of 2024 the global managed services market exceeded $250 billion, giving buyers scale leverage and option to dual-source or shift to OEM-branded CPE. Their feature roadmaps frequently shape vendor product priorities.
Price-sensitive consumers/SMBs
End users and SMBs routinely compare throughput, Wi‑Fi standards and price‑per‑feature, turning routers/APs into highly price‑sensitive buys; peak promotions in 2024 commonly offered 30–50% discounts, training buyers to wait for deals. Switching costs for consumer and SMB routers remain modest, easing churn. Prolific reviews and benchmark sites (SmallNetBuilder, TechRadar) increase transparency and intensify price competition.
Low switching frictions
Standards-based interoperability (eg Wi‑Fi protocols) reduces vendor lock-in, while intuitive setup apps and migration tools make brand switching straightforward; Netgear reported $1.38B revenue in FY2023, highlighting large consumer mobility and competitive pressure. Warranty and support vary but rarely block switches, keeping buyer power elevated as consumers chase features and price.
- Standards reduce lock-in
- Setup apps ease migration
- Warranties matter but not prohibitive
- Buyer power remains high
Demand for integrated solutions
Buyers increasingly demand seamless mesh, built-in security and parental controls, with a 2024 survey showing 58% rank integrated features as a top purchase driver. If Netgear value-added services underperform, customers can switch to competitors like eero or Nest; subscription fatigue (rising cancellation rates in 2023–24) nudges some toward cheaper hardware-only options. These preferences constrain pricing power and force tighter bundling of hardware and services.
- 58% prioritize mesh/security (2024 survey)
- Switch risk: eero, Nest
- Subscription fatigue → hardware-only buys
- Impacts pricing and bundling
Channel discounts and MSP contracts concentrate pricing power while buyers keep leverage
Large channels (Amazon ≈39% US e‑commerce 2024; Best Buy FY2024 revenue ≈$46B) and distributors extract MDF, placement and price concessions, amplifying buyer leverage. ISPs/MSPs (global managed services >$250B in 2024) negotiate volume contracts and shape roadmaps, concentrating pricing risk. Consumers/SMBs are price‑sensitive (58% rank integrated mesh/security top driver in 2024), low switching costs keep bargaining power high.
| Metric | 2023–24 Value |
|---|---|
| Amazon US e‑commerce share | ≈39% (2024) |
| Best Buy revenue | ≈$46B (FY2024) |
| Managed services market | >$250B (2024) |
| Netgear revenue | $1.38B (FY2023) |
| Buyers prioritizing mesh/security | 58% (2024 survey) |
Preview Before You Purchase
Netgear Porter's Five Forces Analysis
This preview displays the exact Netgear Porter’s Five Forces Analysis you’ll receive immediately after purchase—no placeholders or samples. The file is fully formatted, ready to download and use, and contains complete assessments of competitive rivalry, supplier and buyer power, threat of entry and substitutes, plus strategic implications. You’ll get this identical, final document instantly after payment.











