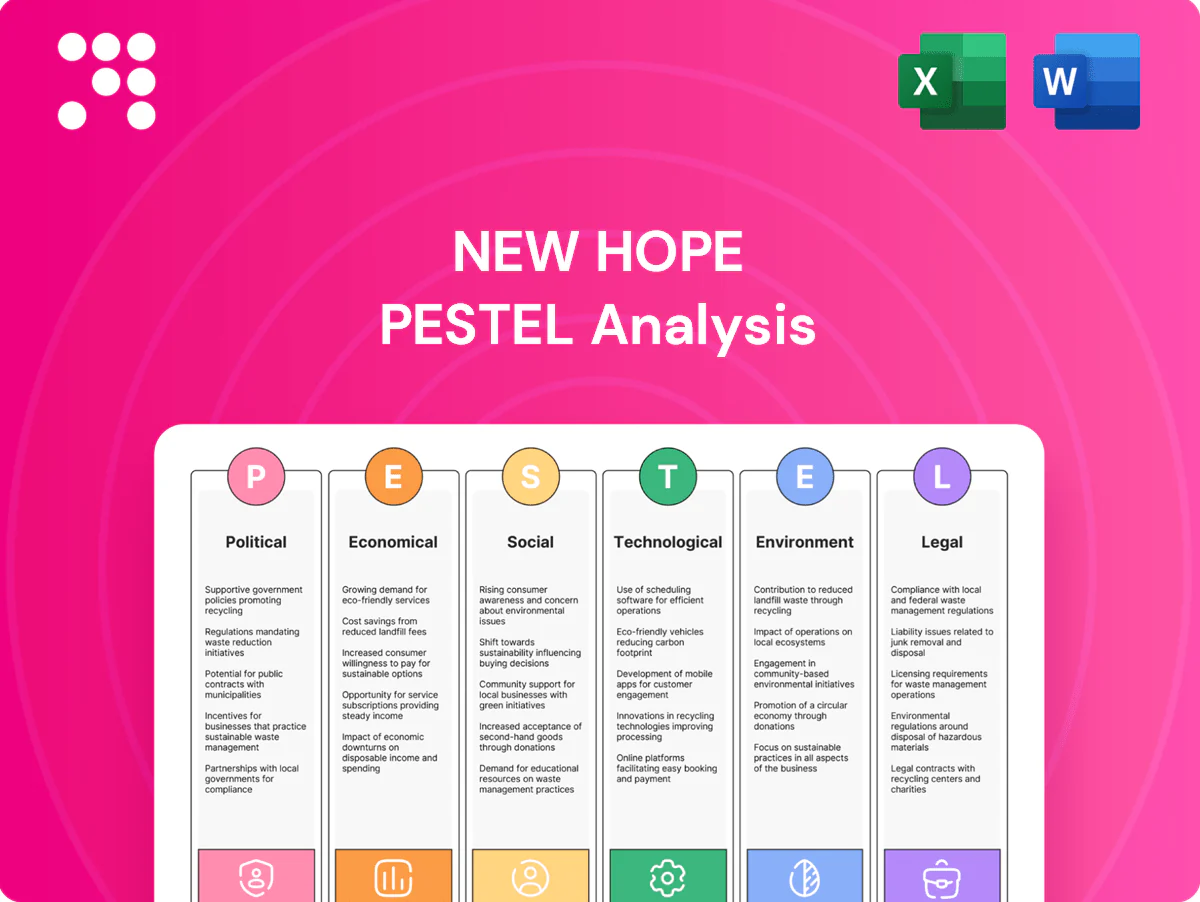
New Hope PESTLE Analysis

Your Shortcut to Market Insight Starts Here
Unlock how political, economic and environmental forces are reshaping New Hope’s strategy and risk profile. Our concise PESTLE highlights regulatory, market and tech trends that matter. Ideal for investors and strategists. Purchase the full analysis for actionable, downloadable insights.
Political factors

Australian energy policy direction
Shifts between pro-resources and decarbonisation agendas materially affect approvals and operating certainty for New Hope, with federal targets of 43% emissions reduction by 2030 and net zero by 2050 tightening coal’s political mandate. Coal still supplies around 60% of Australia’s grid but fiscal moves—including multi‑billion dollar transition funds in recent budgets—indirectly pressure thermal coal. Monitoring elections and policy papers is critical.
State-level mining approvals
Queensland and New South Wales regulators determine licensing and expansion timelines for New Hope, with both states accounting for over 90% of Australia’s coal production, concentrating regulatory impact. Changes in royalty regimes or planning priorities can materially affect project viability and cashflows. Regional development policies often balance hundreds to thousands of jobs against stricter environmental safeguards. Active engagement with state agencies reduces approval risk and timetable uncertainty.

Asia-Pacific trade relations
Export reliance on Asian power generators ties New Hope revenue to diplomatic stability. Tariffs, quotas or informal bans can rapidly redirect trade flows and dent volumes. Strong ties with Japan, South Korea, Taiwan, India and Southeast Asia matter—Asia Pacific accounted for roughly 70% of global coal consumption in 2023 (IEA). Diversified offtake mitigates geopolitical shocks.

Infrastructure and port policy
Government stances on port expansions and rail access directly affect New Hope's throughput; Australia exported about 200 Mt of coal in 2023, so incremental port or rail constraints can materially shift supply flows and FOB costs. Public investment or bottlenecks in logistics corridors change marginal cost curves, while port governance and access pricing remain politically sensitive and can raise export unit costs. Advocacy coalitions of miners and regional councils increasingly shape project approvals and tariff outcomes.
- Port capacity pressure — Australia ~200 Mt coal exports (2023)
- Rail access & investment alter throughput and FOB margins
- Access pricing politically sensitive, affects unit economics
- Industry/regional advocacy drives permitting and tariffs
Carbon pricing and incentives
Adjustments to safeguard mechanisms and carbon credit frameworks raise compliance costs for New Hope as global carbon prices climbed (EU ETS ~€90/t in 2024) and CBAM moves from reporting to pricing from 2026; tighter baselines lift marginal abatement costs. Large clean-tech subsidy programs (US IRA ~USD 369bn) and growing low-carbon finance can crowd capital away from coal projects. International border adjustments will compress thermal coal netbacks for export markets; strategic hedging with offsets and efficiency investments can partially buffer margin impacts.
- EU ETS ~€90/t (2024)
- CBAM pricing phase-in from 2026
- US IRA USD 369bn (clean-energy subsidies)
- Hedging via offsets and efficiency reduces compliance exposure
Net-zero, state permits and exports squeeze coal cashflows; 43% by 2030
Federal net‑zero targets (43% by 2030; net zero 2050) tighten coal’s political mandate while states (QLD/NSW) control permits and royalties, creating material project timing and cashflow risk. Export exposure (Australia ~200 Mt coal exports, Asia ~70% consumption 2023) links revenue to geopolitics and logistics. Carbon regimes (EU ETS ~€90/t 2024; CBAM pricing 2026) and large clean‑energy subsidies shift capital away from coal.
| Metric | Value |
|---|---|
| Aus exports (2023) | ~200 Mt |
| Asia share (2023) | ~70% |
| EU ETS (2024) | €90/t |
What is included in the product
 Detailed Word Document
Explores how macro-environmental forces uniquely affect New Hope across Political, Economic, Social, Technological, Environmental and Legal dimensions, with data-backed trends and actionable, forward-looking insights to identify threats, opportunities and strategic responses for executives, investors and planners.

 Customizable Excel Spreadsheet
A succinct PESTLE snapshot of New Hope, visually segmented by factor for quick reference and easily dropped into presentations or shared across teams to align on external risks and opportunities, with editable notes to tailor insights to region or business line.
Economic factors

Thermal coal price cycles
Newcastle benchmark thermal coal pricing—averaging about US$120/t in 2024 and trading roughly US$85–165/t through H1 2025—directly drives New Hope revenue and capex timing through indexed contracts. Weather, supply disruptions (e.g., Indonesian rains, Australian cyclone seasons) and demand swings from Asia create volatile margins. Hedging policies aim to limit downside while allowing upside capture via collars and futures. Scenario planning across price bands supports operational and capital resilience.
AUD/USD exchange rate
USD-denominated sales versus AUD costs give New Hope strong FX leverage; with AUD/USD trading roughly 0.62–0.70 across 2024–H1 2025 a weaker AUD expanded local margins while a stronger AUD compressed profits. FX hedging programs and natural operational offsets have reduced cash flow volatility, and treasury policy should align hedge tenor with capex schedules and AUD- or USD-denominated debt maturities.

Asian power demand outlook
Coal burn in India (around 1 billion tonnes/year) and rising Southeast Asian thermal demand underpin New Hope offtake, while efficiency upgrades and rapid renewables additions in both markets may moderate volume growth; seasonal monsoon and hydropower variability (El Niño impacts) shift dispatch patterns, and long‑term contracts help smooth cyclical exposure.

Inflation and input costs
Inflation and rising input costs—diesel, explosives, labor and maintenance—have pressured New Hope’s unit costs, with Australia CPI around 3.9% in 2024 and diesel spot volatility increasing operating expenditures. Supply-chain tightness elevated parts and contractor rates, while productivity programs and automation have partially offset inflationary impact and procurement strategies lock in critical inputs.
- Diesel volatility
- Explosives & maintenance up
- Labor cost pressure
- Automation offsets
- Procurement hedges
Diversification cash flows
New Hope’s agriculture and port investments supply ancillary cash flows that widen income sources beyond coal, lowering earnings volatility; management reports these assets partially decouple revenues from coal price cycles, supporting more stable EBITDA through market swings. Capital allocation discipline targets accretive diversification and regular portfolio reviews to reweight assets across cycles.
- Ancillary income from agriculture and port assets
- Partial correlation with coal cycles improves stability
- Capital allocation focused on accretive diversification
- Regular portfolio reviews optimize returns over cycles
Net-zero, state permits and exports squeeze coal cashflows; 43% by 2030
Newcastle thermal coal ~US$120/t in 2024 (H1 2025 trading ~US$85–165/t) drives revenue and capex timing. AUD/USD ~0.62–0.70 in 2024–H1 2025 amplified margins; AU CPI ~3.9% in 2024 raised unit costs. India coal burn ~1.0bn t/yr underpins demand while renewables and efficiency cap long‑run growth.
| Metric | 2024/ H1 2025 |
|---|---|
| Newcastle price | ~US$120/t; H1 2025 US$85–165/t |
| AUD/USD | 0.62–0.70 |
| AU CPI | 3.9% (2024) |
| India coal burn | ~1.0bn t/yr |
Preview the Actual Deliverable
New Hope PESTLE Analysis
The preview shown here is the exact New Hope PESTLE Analysis you’ll receive after purchase—fully formatted and ready to use. The content, structure, and layout visible are the final version with no placeholders or teasers. After checkout you’ll instantly download this same professionally structured document for immediate use.

Your Shortcut to Market Insight Starts Here
Unlock how political, economic and environmental forces are reshaping New Hope’s strategy and risk profile. Our concise PESTLE highlights regulatory, market and tech trends that matter. Ideal for investors and strategists. Purchase the full analysis for actionable, downloadable insights.
Political factors
Australian energy policy direction
Shifts between pro-resources and decarbonisation agendas materially affect approvals and operating certainty for New Hope, with federal targets of 43% emissions reduction by 2030 and net zero by 2050 tightening coal’s political mandate. Coal still supplies around 60% of Australia’s grid but fiscal moves—including multi‑billion dollar transition funds in recent budgets—indirectly pressure thermal coal. Monitoring elections and policy papers is critical.
State-level mining approvals
Queensland and New South Wales regulators determine licensing and expansion timelines for New Hope, with both states accounting for over 90% of Australia’s coal production, concentrating regulatory impact. Changes in royalty regimes or planning priorities can materially affect project viability and cashflows. Regional development policies often balance hundreds to thousands of jobs against stricter environmental safeguards. Active engagement with state agencies reduces approval risk and timetable uncertainty.
Asia-Pacific trade relations
Export reliance on Asian power generators ties New Hope revenue to diplomatic stability. Tariffs, quotas or informal bans can rapidly redirect trade flows and dent volumes. Strong ties with Japan, South Korea, Taiwan, India and Southeast Asia matter—Asia Pacific accounted for roughly 70% of global coal consumption in 2023 (IEA). Diversified offtake mitigates geopolitical shocks.
Infrastructure and port policy
Government stances on port expansions and rail access directly affect New Hope's throughput; Australia exported about 200 Mt of coal in 2023, so incremental port or rail constraints can materially shift supply flows and FOB costs. Public investment or bottlenecks in logistics corridors change marginal cost curves, while port governance and access pricing remain politically sensitive and can raise export unit costs. Advocacy coalitions of miners and regional councils increasingly shape project approvals and tariff outcomes.
- Port capacity pressure — Australia ~200 Mt coal exports (2023)
- Rail access & investment alter throughput and FOB margins
- Access pricing politically sensitive, affects unit economics
- Industry/regional advocacy drives permitting and tariffs
Carbon pricing and incentives
Adjustments to safeguard mechanisms and carbon credit frameworks raise compliance costs for New Hope as global carbon prices climbed (EU ETS ~€90/t in 2024) and CBAM moves from reporting to pricing from 2026; tighter baselines lift marginal abatement costs. Large clean-tech subsidy programs (US IRA ~USD 369bn) and growing low-carbon finance can crowd capital away from coal projects. International border adjustments will compress thermal coal netbacks for export markets; strategic hedging with offsets and efficiency investments can partially buffer margin impacts.
- EU ETS ~€90/t (2024)
- CBAM pricing phase-in from 2026
- US IRA USD 369bn (clean-energy subsidies)
- Hedging via offsets and efficiency reduces compliance exposure
Net-zero, state permits and exports squeeze coal cashflows; 43% by 2030
Federal net‑zero targets (43% by 2030; net zero 2050) tighten coal’s political mandate while states (QLD/NSW) control permits and royalties, creating material project timing and cashflow risk. Export exposure (Australia ~200 Mt coal exports, Asia ~70% consumption 2023) links revenue to geopolitics and logistics. Carbon regimes (EU ETS ~€90/t 2024; CBAM pricing 2026) and large clean‑energy subsidies shift capital away from coal.
| Metric | Value |
|---|---|
| Aus exports (2023) | ~200 Mt |
| Asia share (2023) | ~70% |
| EU ETS (2024) | €90/t |
What is included in the product
Detailed Word Document
Explores how macro-environmental forces uniquely affect New Hope across Political, Economic, Social, Technological, Environmental and Legal dimensions, with data-backed trends and actionable, forward-looking insights to identify threats, opportunities and strategic responses for executives, investors and planners.
Customizable Excel Spreadsheet
A succinct PESTLE snapshot of New Hope, visually segmented by factor for quick reference and easily dropped into presentations or shared across teams to align on external risks and opportunities, with editable notes to tailor insights to region or business line.
Economic factors
Thermal coal price cycles
Newcastle benchmark thermal coal pricing—averaging about US$120/t in 2024 and trading roughly US$85–165/t through H1 2025—directly drives New Hope revenue and capex timing through indexed contracts. Weather, supply disruptions (e.g., Indonesian rains, Australian cyclone seasons) and demand swings from Asia create volatile margins. Hedging policies aim to limit downside while allowing upside capture via collars and futures. Scenario planning across price bands supports operational and capital resilience.
AUD/USD exchange rate
USD-denominated sales versus AUD costs give New Hope strong FX leverage; with AUD/USD trading roughly 0.62–0.70 across 2024–H1 2025 a weaker AUD expanded local margins while a stronger AUD compressed profits. FX hedging programs and natural operational offsets have reduced cash flow volatility, and treasury policy should align hedge tenor with capex schedules and AUD- or USD-denominated debt maturities.
Asian power demand outlook
Coal burn in India (around 1 billion tonnes/year) and rising Southeast Asian thermal demand underpin New Hope offtake, while efficiency upgrades and rapid renewables additions in both markets may moderate volume growth; seasonal monsoon and hydropower variability (El Niño impacts) shift dispatch patterns, and long‑term contracts help smooth cyclical exposure.
Inflation and input costs
Inflation and rising input costs—diesel, explosives, labor and maintenance—have pressured New Hope’s unit costs, with Australia CPI around 3.9% in 2024 and diesel spot volatility increasing operating expenditures. Supply-chain tightness elevated parts and contractor rates, while productivity programs and automation have partially offset inflationary impact and procurement strategies lock in critical inputs.
- Diesel volatility
- Explosives & maintenance up
- Labor cost pressure
- Automation offsets
- Procurement hedges
Diversification cash flows
New Hope’s agriculture and port investments supply ancillary cash flows that widen income sources beyond coal, lowering earnings volatility; management reports these assets partially decouple revenues from coal price cycles, supporting more stable EBITDA through market swings. Capital allocation discipline targets accretive diversification and regular portfolio reviews to reweight assets across cycles.
- Ancillary income from agriculture and port assets
- Partial correlation with coal cycles improves stability
- Capital allocation focused on accretive diversification
- Regular portfolio reviews optimize returns over cycles
Net-zero, state permits and exports squeeze coal cashflows; 43% by 2030
Newcastle thermal coal ~US$120/t in 2024 (H1 2025 trading ~US$85–165/t) drives revenue and capex timing. AUD/USD ~0.62–0.70 in 2024–H1 2025 amplified margins; AU CPI ~3.9% in 2024 raised unit costs. India coal burn ~1.0bn t/yr underpins demand while renewables and efficiency cap long‑run growth.
| Metric | 2024/ H1 2025 |
|---|---|
| Newcastle price | ~US$120/t; H1 2025 US$85–165/t |
| AUD/USD | 0.62–0.70 |
| AU CPI | 3.9% (2024) |
| India coal burn | ~1.0bn t/yr |
Preview the Actual Deliverable
New Hope PESTLE Analysis
The preview shown here is the exact New Hope PESTLE Analysis you’ll receive after purchase—fully formatted and ready to use. The content, structure, and layout visible are the final version with no placeholders or teasers. After checkout you’ll instantly download this same professionally structured document for immediate use.
Original: $10.00
-65%$10.00
$3.50Description
Your Shortcut to Market Insight Starts Here
Unlock how political, economic and environmental forces are reshaping New Hope’s strategy and risk profile. Our concise PESTLE highlights regulatory, market and tech trends that matter. Ideal for investors and strategists. Purchase the full analysis for actionable, downloadable insights.
Political factors
Australian energy policy direction
Shifts between pro-resources and decarbonisation agendas materially affect approvals and operating certainty for New Hope, with federal targets of 43% emissions reduction by 2030 and net zero by 2050 tightening coal’s political mandate. Coal still supplies around 60% of Australia’s grid but fiscal moves—including multi‑billion dollar transition funds in recent budgets—indirectly pressure thermal coal. Monitoring elections and policy papers is critical.
State-level mining approvals
Queensland and New South Wales regulators determine licensing and expansion timelines for New Hope, with both states accounting for over 90% of Australia’s coal production, concentrating regulatory impact. Changes in royalty regimes or planning priorities can materially affect project viability and cashflows. Regional development policies often balance hundreds to thousands of jobs against stricter environmental safeguards. Active engagement with state agencies reduces approval risk and timetable uncertainty.
Asia-Pacific trade relations
Export reliance on Asian power generators ties New Hope revenue to diplomatic stability. Tariffs, quotas or informal bans can rapidly redirect trade flows and dent volumes. Strong ties with Japan, South Korea, Taiwan, India and Southeast Asia matter—Asia Pacific accounted for roughly 70% of global coal consumption in 2023 (IEA). Diversified offtake mitigates geopolitical shocks.
Infrastructure and port policy
Government stances on port expansions and rail access directly affect New Hope's throughput; Australia exported about 200 Mt of coal in 2023, so incremental port or rail constraints can materially shift supply flows and FOB costs. Public investment or bottlenecks in logistics corridors change marginal cost curves, while port governance and access pricing remain politically sensitive and can raise export unit costs. Advocacy coalitions of miners and regional councils increasingly shape project approvals and tariff outcomes.
- Port capacity pressure — Australia ~200 Mt coal exports (2023)
- Rail access & investment alter throughput and FOB margins
- Access pricing politically sensitive, affects unit economics
- Industry/regional advocacy drives permitting and tariffs
Carbon pricing and incentives
Adjustments to safeguard mechanisms and carbon credit frameworks raise compliance costs for New Hope as global carbon prices climbed (EU ETS ~€90/t in 2024) and CBAM moves from reporting to pricing from 2026; tighter baselines lift marginal abatement costs. Large clean-tech subsidy programs (US IRA ~USD 369bn) and growing low-carbon finance can crowd capital away from coal projects. International border adjustments will compress thermal coal netbacks for export markets; strategic hedging with offsets and efficiency investments can partially buffer margin impacts.
- EU ETS ~€90/t (2024)
- CBAM pricing phase-in from 2026
- US IRA USD 369bn (clean-energy subsidies)
- Hedging via offsets and efficiency reduces compliance exposure
Net-zero, state permits and exports squeeze coal cashflows; 43% by 2030
Federal net‑zero targets (43% by 2030; net zero 2050) tighten coal’s political mandate while states (QLD/NSW) control permits and royalties, creating material project timing and cashflow risk. Export exposure (Australia ~200 Mt coal exports, Asia ~70% consumption 2023) links revenue to geopolitics and logistics. Carbon regimes (EU ETS ~€90/t 2024; CBAM pricing 2026) and large clean‑energy subsidies shift capital away from coal.
| Metric | Value |
|---|---|
| Aus exports (2023) | ~200 Mt |
| Asia share (2023) | ~70% |
| EU ETS (2024) | €90/t |
What is included in the product
Detailed Word Document
Explores how macro-environmental forces uniquely affect New Hope across Political, Economic, Social, Technological, Environmental and Legal dimensions, with data-backed trends and actionable, forward-looking insights to identify threats, opportunities and strategic responses for executives, investors and planners.
Customizable Excel Spreadsheet
A succinct PESTLE snapshot of New Hope, visually segmented by factor for quick reference and easily dropped into presentations or shared across teams to align on external risks and opportunities, with editable notes to tailor insights to region or business line.
Economic factors
Thermal coal price cycles
Newcastle benchmark thermal coal pricing—averaging about US$120/t in 2024 and trading roughly US$85–165/t through H1 2025—directly drives New Hope revenue and capex timing through indexed contracts. Weather, supply disruptions (e.g., Indonesian rains, Australian cyclone seasons) and demand swings from Asia create volatile margins. Hedging policies aim to limit downside while allowing upside capture via collars and futures. Scenario planning across price bands supports operational and capital resilience.
AUD/USD exchange rate
USD-denominated sales versus AUD costs give New Hope strong FX leverage; with AUD/USD trading roughly 0.62–0.70 across 2024–H1 2025 a weaker AUD expanded local margins while a stronger AUD compressed profits. FX hedging programs and natural operational offsets have reduced cash flow volatility, and treasury policy should align hedge tenor with capex schedules and AUD- or USD-denominated debt maturities.
Asian power demand outlook
Coal burn in India (around 1 billion tonnes/year) and rising Southeast Asian thermal demand underpin New Hope offtake, while efficiency upgrades and rapid renewables additions in both markets may moderate volume growth; seasonal monsoon and hydropower variability (El Niño impacts) shift dispatch patterns, and long‑term contracts help smooth cyclical exposure.
Inflation and input costs
Inflation and rising input costs—diesel, explosives, labor and maintenance—have pressured New Hope’s unit costs, with Australia CPI around 3.9% in 2024 and diesel spot volatility increasing operating expenditures. Supply-chain tightness elevated parts and contractor rates, while productivity programs and automation have partially offset inflationary impact and procurement strategies lock in critical inputs.
- Diesel volatility
- Explosives & maintenance up
- Labor cost pressure
- Automation offsets
- Procurement hedges
Diversification cash flows
New Hope’s agriculture and port investments supply ancillary cash flows that widen income sources beyond coal, lowering earnings volatility; management reports these assets partially decouple revenues from coal price cycles, supporting more stable EBITDA through market swings. Capital allocation discipline targets accretive diversification and regular portfolio reviews to reweight assets across cycles.
- Ancillary income from agriculture and port assets
- Partial correlation with coal cycles improves stability
- Capital allocation focused on accretive diversification
- Regular portfolio reviews optimize returns over cycles
Net-zero, state permits and exports squeeze coal cashflows; 43% by 2030
Newcastle thermal coal ~US$120/t in 2024 (H1 2025 trading ~US$85–165/t) drives revenue and capex timing. AUD/USD ~0.62–0.70 in 2024–H1 2025 amplified margins; AU CPI ~3.9% in 2024 raised unit costs. India coal burn ~1.0bn t/yr underpins demand while renewables and efficiency cap long‑run growth.
| Metric | 2024/ H1 2025 |
|---|---|
| Newcastle price | ~US$120/t; H1 2025 US$85–165/t |
| AUD/USD | 0.62–0.70 |
| AU CPI | 3.9% (2024) |
| India coal burn | ~1.0bn t/yr |
Preview the Actual Deliverable
New Hope PESTLE Analysis
The preview shown here is the exact New Hope PESTLE Analysis you’ll receive after purchase—fully formatted and ready to use. The content, structure, and layout visible are the final version with no placeholders or teasers. After checkout you’ll instantly download this same professionally structured document for immediate use.











