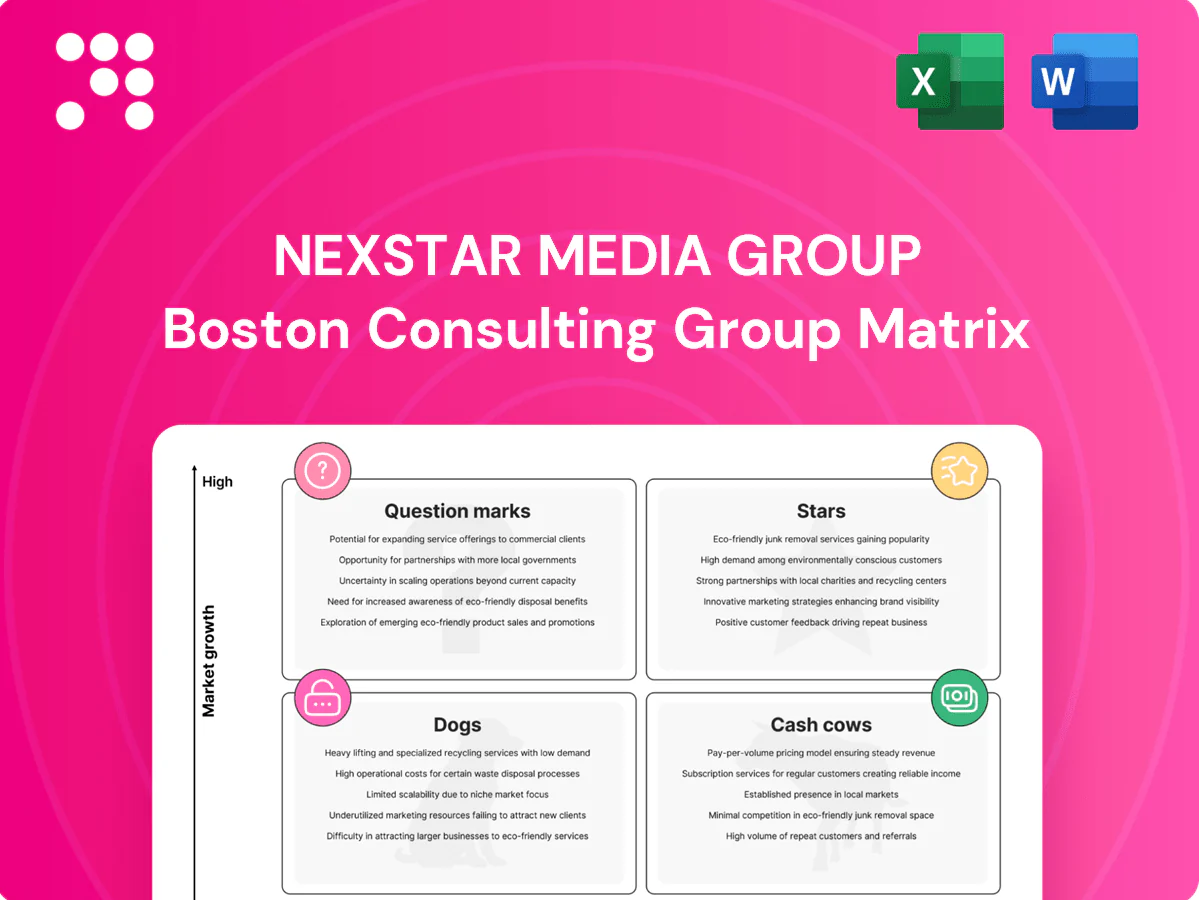
Nexstar Media Group Boston Consulting Group Matrix

Actionable Strategy Starts Here
Nexstar Media Group’s BCG Matrix preview highlights where their broadcast and digital assets land—some clear Stars, a couple of Cash Cows, and a few Question Marks worth watching. Want the full picture with quadrant-by-quadrant placement, hard data and actionable recommendations? Purchase the complete BCG Matrix for a Word report and Excel summary that lets you decide where to invest, divest, or double down—fast.
Stars

Political ad engine
Election cycles exploded U.S. political ad spend to roughly 14 billion dollars in 2024, and Nexstar’s local footprint—about 197 stations reaching ~62% of U.S. TV households—owns that reach with high share in key markets and premium news adjacencies. Intensify sales ops and inventory packaging to monetize peak demand; when the cycle cools, that muscle memory sustains issue and advocacy buys.
Cross‑platform local news
Local news still dominates in‑market and Nexstar’s stations reach about 115 million US TV households (≈38%), even as audiences shift to CTV and mobile — CTV ad spend topped roughly $19 billion in 2023. By selling the whole bundle — broadcast plus digital — Nexstar keeps share high as the advertising pie expands. Continue investing in talent, short clips and push alerts to protect reach; the halo boosts premium CPMs and advertiser loyalty.

CTV/OTT ad bundles
Connected TV inventory is surging—US CTV ad spend reached roughly $21 billion in 2024—while Nexstar’s scale (about 197 local stations across ~115 markets) gives it supply control and geo-precise reach. Scale plus geo precision drives high share in this hot category. Continued investment in unified frequency capping and cross-platform measurement preserves yield and keeps churn low.

LIV Golf on The CW
First-mover broadcast carriage via Nexstar's CW (rights deal announced Oct 2023) establishes category leadership in a fast-growing niche; CW reaches about 75% of US TV households, accelerating audience build as sponsors test premium inventory and local tie-ins. Sustained ratings momentum can convert the niche into a platform.
- Stars: LIV on CW
- Reach: ~75% US households
- Edge: first-mover carriage
- Opportunity: sponsor testing, local shoulder content
Data‑driven sales
Data-driven sales: audience targeting and attribution are table stakes and Nexstar leverages real scale—owning 197 TV stations and reaching about 112 million TV households in 2024—letting marketers pay up for proof, not promises. Keep enhancing first-party data and post-campaign reporting to protect CPMs while the addressable advertising category grows fast.
- Scale: 197 stations, ~112M households (2024)
- Value: marketers pay for measurable ROI
- Priority: strengthen 1st-party data
- Defensive: post-campaign reporting preserves price
First-mover premium TV: test sponsorships, local shoulder content, unified measurement
Stars: LIV on CW is a first‑mover premium inventory with ~75% household reach, leveraging Nexstar’s 197 stations (~62% reach) to capture elevated 2024 political spend (~$14B) and surging CTV demand (~$21B). Prioritize sponsorship tests, local shoulder content and unified measurement to convert trial into sustained CPM premium.
| Metric | Value (2024) |
|---|---|
| Stations | 197 |
| Household reach (CW) | ~75% |
| Political ad spend | ~$14B |
| CTV ad spend | ~$21B |
What is included in the product
 Detailed Word Document
BCG Matrix analysis of Nexstar: identifies Stars, Cash Cows, Question Marks, Dogs with investment, hold, or divest recommendations.

 Customizable Excel Spreadsheet
One-page Nexstar BCG matrix placing each station in a quadrant for quick invest/divest decisions, export-ready for C-level decks.
Cash Cows

Retransmission fees
Retransmission fees are a large, stable, negotiated cash cow for Nexstar, providing multi-hundred-million-dollar annual cash flow in 2024 with strong leverage versus distributors.
They exhibit low growth but high predictability and margins, so management focuses on maintaining distribution posture and minimizing churn.
Cash generated funds strategic investments and riskier growth bets across the company.
Core local spot ads
Core local spot ads are mature but durable, with auto, healthcare, retail and legal categories keeping stations cash-positive. Nexstar owns about 197 TV stations and reaches roughly 115 million TV households (2024), letting rates hold when news leads and events stack. Tight inventory management across that footprint boosts yield. No heroics needed—just blocking and tackling to sustain cash flow.

Antenna TV & Rewind TV
Antenna TV and Rewind TV function as Nexstar cash cows, delivering classic-programming reach to roughly 70 million US TV households (Nexstar 2024 distribution data), generating steady viewership at low programming cost. CPMs sit in the low single digits while contribution margins remain high, so optimize carriage deals and schedule library rotation to lift yield. Reinvest small promotional spend to sustain audience and ad rate resilience.

Syndication & library sales
Syndication and library sales are classic cash cows for Nexstar, with long‑tail content generating recurring licensing checks while requiring minimal new spend; Nexstar reported $6.9 billion total revenue in 2023, underscoring scale for distribution leverage. Smart packaging for FAST and international windows magnifies margins, letting the archive do the heavy lifting and sustain high-margin cash flow.
- Long‑tail licensing: recurring revenue
- Low incremental cost: high margins
- FAST/international packaging: revenue upside
- Archive monetization: scalable cash flow
News sponsorships
News sponsorships sit as cash cows for Nexstar: fixed on-air positions tied to trusted local brands and repeat buyers, driving high renewal rates and simple fulfillment; Nexstar’s scale—about 197 stations reaching roughly 39% of US TV households in 2024—keeps category exclusivity tight and delivers predictable cash quarter after quarter.
- fixed-positions
- trusted-brands
- high-renewal-rates
- predictable-quarterly-cash
Retransmission fees drive high-margin cash flow; $6.9B revenue (2023)
Retransmission fees, core local spot ads, Antenna/Rewind and syndication deliver high-margin, low-growth cash flow for Nexstar in 2024; retrans fees provide multi-hundred-million annual cash flow. Nexstar owns ~197 stations, reaches ~115M TV households (2024) and reported $6.9B revenue in 2023, funding strategic investments and M&A.
| Metric | Value |
|---|---|
| Stations | ~197 |
| Reach (2024) | ~115M HH |
| 2023 Revenue | $6.9B |
| Retrans fees | Multi-$100M (2024) |
What You See Is What You Get
Nexstar Media Group BCG Matrix
The file you're previewing is the exact Nexstar Media Group BCG Matrix report you'll receive after purchase—no watermarks, no demo content. It's fully formatted, market-backed, and ready to edit, print, or present. Buy once and download immediately; what you see is the final, analysis-ready document crafted by strategy pros.

Actionable Strategy Starts Here
Nexstar Media Group’s BCG Matrix preview highlights where their broadcast and digital assets land—some clear Stars, a couple of Cash Cows, and a few Question Marks worth watching. Want the full picture with quadrant-by-quadrant placement, hard data and actionable recommendations? Purchase the complete BCG Matrix for a Word report and Excel summary that lets you decide where to invest, divest, or double down—fast.
Stars
Political ad engine
Election cycles exploded U.S. political ad spend to roughly 14 billion dollars in 2024, and Nexstar’s local footprint—about 197 stations reaching ~62% of U.S. TV households—owns that reach with high share in key markets and premium news adjacencies. Intensify sales ops and inventory packaging to monetize peak demand; when the cycle cools, that muscle memory sustains issue and advocacy buys.
Cross‑platform local news
Local news still dominates in‑market and Nexstar’s stations reach about 115 million US TV households (≈38%), even as audiences shift to CTV and mobile — CTV ad spend topped roughly $19 billion in 2023. By selling the whole bundle — broadcast plus digital — Nexstar keeps share high as the advertising pie expands. Continue investing in talent, short clips and push alerts to protect reach; the halo boosts premium CPMs and advertiser loyalty.
CTV/OTT ad bundles
Connected TV inventory is surging—US CTV ad spend reached roughly $21 billion in 2024—while Nexstar’s scale (about 197 local stations across ~115 markets) gives it supply control and geo-precise reach. Scale plus geo precision drives high share in this hot category. Continued investment in unified frequency capping and cross-platform measurement preserves yield and keeps churn low.
LIV Golf on The CW
First-mover broadcast carriage via Nexstar's CW (rights deal announced Oct 2023) establishes category leadership in a fast-growing niche; CW reaches about 75% of US TV households, accelerating audience build as sponsors test premium inventory and local tie-ins. Sustained ratings momentum can convert the niche into a platform.
- Stars: LIV on CW
- Reach: ~75% US households
- Edge: first-mover carriage
- Opportunity: sponsor testing, local shoulder content
Data‑driven sales
Data-driven sales: audience targeting and attribution are table stakes and Nexstar leverages real scale—owning 197 TV stations and reaching about 112 million TV households in 2024—letting marketers pay up for proof, not promises. Keep enhancing first-party data and post-campaign reporting to protect CPMs while the addressable advertising category grows fast.
- Scale: 197 stations, ~112M households (2024)
- Value: marketers pay for measurable ROI
- Priority: strengthen 1st-party data
- Defensive: post-campaign reporting preserves price
First-mover premium TV: test sponsorships, local shoulder content, unified measurement
Stars: LIV on CW is a first‑mover premium inventory with ~75% household reach, leveraging Nexstar’s 197 stations (~62% reach) to capture elevated 2024 political spend (~$14B) and surging CTV demand (~$21B). Prioritize sponsorship tests, local shoulder content and unified measurement to convert trial into sustained CPM premium.
| Metric | Value (2024) |
|---|---|
| Stations | 197 |
| Household reach (CW) | ~75% |
| Political ad spend | ~$14B |
| CTV ad spend | ~$21B |
What is included in the product
Detailed Word Document
BCG Matrix analysis of Nexstar: identifies Stars, Cash Cows, Question Marks, Dogs with investment, hold, or divest recommendations.
Customizable Excel Spreadsheet
One-page Nexstar BCG matrix placing each station in a quadrant for quick invest/divest decisions, export-ready for C-level decks.
Cash Cows
Retransmission fees
Retransmission fees are a large, stable, negotiated cash cow for Nexstar, providing multi-hundred-million-dollar annual cash flow in 2024 with strong leverage versus distributors.
They exhibit low growth but high predictability and margins, so management focuses on maintaining distribution posture and minimizing churn.
Cash generated funds strategic investments and riskier growth bets across the company.
Core local spot ads
Core local spot ads are mature but durable, with auto, healthcare, retail and legal categories keeping stations cash-positive. Nexstar owns about 197 TV stations and reaches roughly 115 million TV households (2024), letting rates hold when news leads and events stack. Tight inventory management across that footprint boosts yield. No heroics needed—just blocking and tackling to sustain cash flow.
Antenna TV & Rewind TV
Antenna TV and Rewind TV function as Nexstar cash cows, delivering classic-programming reach to roughly 70 million US TV households (Nexstar 2024 distribution data), generating steady viewership at low programming cost. CPMs sit in the low single digits while contribution margins remain high, so optimize carriage deals and schedule library rotation to lift yield. Reinvest small promotional spend to sustain audience and ad rate resilience.
Syndication & library sales
Syndication and library sales are classic cash cows for Nexstar, with long‑tail content generating recurring licensing checks while requiring minimal new spend; Nexstar reported $6.9 billion total revenue in 2023, underscoring scale for distribution leverage. Smart packaging for FAST and international windows magnifies margins, letting the archive do the heavy lifting and sustain high-margin cash flow.
- Long‑tail licensing: recurring revenue
- Low incremental cost: high margins
- FAST/international packaging: revenue upside
- Archive monetization: scalable cash flow
News sponsorships
News sponsorships sit as cash cows for Nexstar: fixed on-air positions tied to trusted local brands and repeat buyers, driving high renewal rates and simple fulfillment; Nexstar’s scale—about 197 stations reaching roughly 39% of US TV households in 2024—keeps category exclusivity tight and delivers predictable cash quarter after quarter.
- fixed-positions
- trusted-brands
- high-renewal-rates
- predictable-quarterly-cash
Retransmission fees drive high-margin cash flow; $6.9B revenue (2023)
Retransmission fees, core local spot ads, Antenna/Rewind and syndication deliver high-margin, low-growth cash flow for Nexstar in 2024; retrans fees provide multi-hundred-million annual cash flow. Nexstar owns ~197 stations, reaches ~115M TV households (2024) and reported $6.9B revenue in 2023, funding strategic investments and M&A.
| Metric | Value |
|---|---|
| Stations | ~197 |
| Reach (2024) | ~115M HH |
| 2023 Revenue | $6.9B |
| Retrans fees | Multi-$100M (2024) |
What You See Is What You Get
Nexstar Media Group BCG Matrix
The file you're previewing is the exact Nexstar Media Group BCG Matrix report you'll receive after purchase—no watermarks, no demo content. It's fully formatted, market-backed, and ready to edit, print, or present. Buy once and download immediately; what you see is the final, analysis-ready document crafted by strategy pros.
Original: $10.00
-65%$10.00
$3.50Description
Actionable Strategy Starts Here
Nexstar Media Group’s BCG Matrix preview highlights where their broadcast and digital assets land—some clear Stars, a couple of Cash Cows, and a few Question Marks worth watching. Want the full picture with quadrant-by-quadrant placement, hard data and actionable recommendations? Purchase the complete BCG Matrix for a Word report and Excel summary that lets you decide where to invest, divest, or double down—fast.
Stars
Political ad engine
Election cycles exploded U.S. political ad spend to roughly 14 billion dollars in 2024, and Nexstar’s local footprint—about 197 stations reaching ~62% of U.S. TV households—owns that reach with high share in key markets and premium news adjacencies. Intensify sales ops and inventory packaging to monetize peak demand; when the cycle cools, that muscle memory sustains issue and advocacy buys.
Cross‑platform local news
Local news still dominates in‑market and Nexstar’s stations reach about 115 million US TV households (≈38%), even as audiences shift to CTV and mobile — CTV ad spend topped roughly $19 billion in 2023. By selling the whole bundle — broadcast plus digital — Nexstar keeps share high as the advertising pie expands. Continue investing in talent, short clips and push alerts to protect reach; the halo boosts premium CPMs and advertiser loyalty.
CTV/OTT ad bundles
Connected TV inventory is surging—US CTV ad spend reached roughly $21 billion in 2024—while Nexstar’s scale (about 197 local stations across ~115 markets) gives it supply control and geo-precise reach. Scale plus geo precision drives high share in this hot category. Continued investment in unified frequency capping and cross-platform measurement preserves yield and keeps churn low.
LIV Golf on The CW
First-mover broadcast carriage via Nexstar's CW (rights deal announced Oct 2023) establishes category leadership in a fast-growing niche; CW reaches about 75% of US TV households, accelerating audience build as sponsors test premium inventory and local tie-ins. Sustained ratings momentum can convert the niche into a platform.
- Stars: LIV on CW
- Reach: ~75% US households
- Edge: first-mover carriage
- Opportunity: sponsor testing, local shoulder content
Data‑driven sales
Data-driven sales: audience targeting and attribution are table stakes and Nexstar leverages real scale—owning 197 TV stations and reaching about 112 million TV households in 2024—letting marketers pay up for proof, not promises. Keep enhancing first-party data and post-campaign reporting to protect CPMs while the addressable advertising category grows fast.
- Scale: 197 stations, ~112M households (2024)
- Value: marketers pay for measurable ROI
- Priority: strengthen 1st-party data
- Defensive: post-campaign reporting preserves price
First-mover premium TV: test sponsorships, local shoulder content, unified measurement
Stars: LIV on CW is a first‑mover premium inventory with ~75% household reach, leveraging Nexstar’s 197 stations (~62% reach) to capture elevated 2024 political spend (~$14B) and surging CTV demand (~$21B). Prioritize sponsorship tests, local shoulder content and unified measurement to convert trial into sustained CPM premium.
| Metric | Value (2024) |
|---|---|
| Stations | 197 |
| Household reach (CW) | ~75% |
| Political ad spend | ~$14B |
| CTV ad spend | ~$21B |
What is included in the product
Detailed Word Document
BCG Matrix analysis of Nexstar: identifies Stars, Cash Cows, Question Marks, Dogs with investment, hold, or divest recommendations.
Customizable Excel Spreadsheet
One-page Nexstar BCG matrix placing each station in a quadrant for quick invest/divest decisions, export-ready for C-level decks.
Cash Cows
Retransmission fees
Retransmission fees are a large, stable, negotiated cash cow for Nexstar, providing multi-hundred-million-dollar annual cash flow in 2024 with strong leverage versus distributors.
They exhibit low growth but high predictability and margins, so management focuses on maintaining distribution posture and minimizing churn.
Cash generated funds strategic investments and riskier growth bets across the company.
Core local spot ads
Core local spot ads are mature but durable, with auto, healthcare, retail and legal categories keeping stations cash-positive. Nexstar owns about 197 TV stations and reaches roughly 115 million TV households (2024), letting rates hold when news leads and events stack. Tight inventory management across that footprint boosts yield. No heroics needed—just blocking and tackling to sustain cash flow.
Antenna TV & Rewind TV
Antenna TV and Rewind TV function as Nexstar cash cows, delivering classic-programming reach to roughly 70 million US TV households (Nexstar 2024 distribution data), generating steady viewership at low programming cost. CPMs sit in the low single digits while contribution margins remain high, so optimize carriage deals and schedule library rotation to lift yield. Reinvest small promotional spend to sustain audience and ad rate resilience.
Syndication & library sales
Syndication and library sales are classic cash cows for Nexstar, with long‑tail content generating recurring licensing checks while requiring minimal new spend; Nexstar reported $6.9 billion total revenue in 2023, underscoring scale for distribution leverage. Smart packaging for FAST and international windows magnifies margins, letting the archive do the heavy lifting and sustain high-margin cash flow.
- Long‑tail licensing: recurring revenue
- Low incremental cost: high margins
- FAST/international packaging: revenue upside
- Archive monetization: scalable cash flow
News sponsorships
News sponsorships sit as cash cows for Nexstar: fixed on-air positions tied to trusted local brands and repeat buyers, driving high renewal rates and simple fulfillment; Nexstar’s scale—about 197 stations reaching roughly 39% of US TV households in 2024—keeps category exclusivity tight and delivers predictable cash quarter after quarter.
- fixed-positions
- trusted-brands
- high-renewal-rates
- predictable-quarterly-cash
Retransmission fees drive high-margin cash flow; $6.9B revenue (2023)
Retransmission fees, core local spot ads, Antenna/Rewind and syndication deliver high-margin, low-growth cash flow for Nexstar in 2024; retrans fees provide multi-hundred-million annual cash flow. Nexstar owns ~197 stations, reaches ~115M TV households (2024) and reported $6.9B revenue in 2023, funding strategic investments and M&A.
| Metric | Value |
|---|---|
| Stations | ~197 |
| Reach (2024) | ~115M HH |
| 2023 Revenue | $6.9B |
| Retrans fees | Multi-$100M (2024) |
What You See Is What You Get
Nexstar Media Group BCG Matrix
The file you're previewing is the exact Nexstar Media Group BCG Matrix report you'll receive after purchase—no watermarks, no demo content. It's fully formatted, market-backed, and ready to edit, print, or present. Buy once and download immediately; what you see is the final, analysis-ready document crafted by strategy pros.











