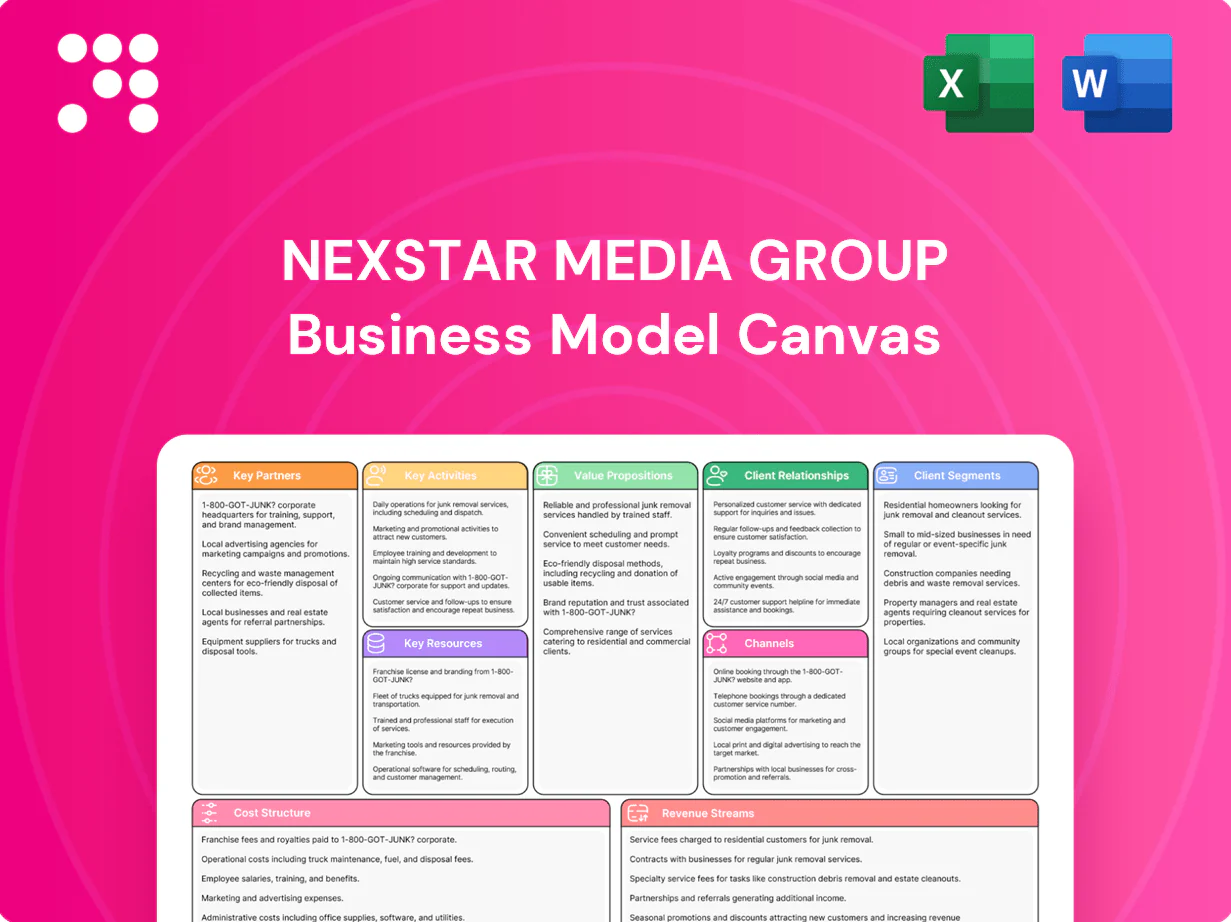
Nexstar Media Group Business Model Canvas

Local Media Business Model Canvas: Strategy, Revenue & Partnership Snapshot
Unlock the full strategic blueprint behind Nexstar Media Group with our Business Model Canvas. This concise, downloadable canvas maps value propositions, revenue streams, partnerships and cost structure to show how Nexstar scales and monetizes local media. Ideal for investors, strategists and founders—purchase the full Word/Excel canvas to benchmark, adapt, and act.
Partnerships

Network and content affiliates
Partnerships with major networks and studios secure prime-time programming and syndicated content for Nexstar’s local stations and its 75%‑owned CW, leveraging deals that balance license fees with audience draw and ad yield. As of 2024 Nexstar owns 197 TV stations in 112 markets reaching about 39% of US TV households. Long‑term affiliate agreements underpin schedule stability and national ad integration, with coordination ensuring brand standards and promotional alignment.
Distribution and carriage partners
MVPDs, vMVPDs and OTA partners extend Nexstar’s reach—Nexstar’s station group covers roughly 39% of U.S. TV households in 2024—while generating significant retransmission and carriage fees that underpin affiliate economics.
Carriage negotiations focus on maximizing revenue, penetration and packaging; partnerships govern channel placement, authentication and blackout management, with technical coordination ensuring signal quality and regulatory compliance.

Sports leagues and rights holders
Sports leagues and rights holders supply live-event programming that drives appointment viewing across Nexstar’s 200+ local TV stations and The CW, helping reach about 115 million US TV households. Agreements cover league packages, team-specific local rights and shoulder-content deals that expand programming depth. These rights create high-CPM ad inventory and boost affiliate carriage value, while co-marketing with leagues increases tune-in and fan engagement.

Advertising agencies and ad-tech platforms
Advertising agencies aggregate national demand for Nexstar, while ad-tech partners enable programmatic and addressable sales across linear and digital, improving yield and scale. Data partnerships enhance targeting and cross-platform measurement, linking set-top and CTV signals with first-party audience insights. Workflow integrations streamline trafficking and reporting, and preferred-status agreements secure better pricing and fill for national buys.
- Agencies: national demand aggregation
- Ad-tech: programmatic/addressable enablement
- Data: targeting & measurement
- Integrations: trafficking & reporting
- Preferred deals: pricing & fill
Technology, measurement, and data vendors
Nexstar partners with cloud, CDN, CMS, ATS, and analytics providers to enable multi-platform delivery and programmatic monetization, leveraging a 2024 CDN market (~27 billion USD) to scale reach. Measurement partners Nielsen and Comscore validate audience currency and campaign outcomes for agency buying. Identity and privacy vendors enable compliant data activation while joint roadmaps reduce latency, improve uptime, and accelerate feature velocity.
- Cloud/CDN: scale & latency
- Measurement: Nielsen/Comscore currency
- Identity/privacy: compliant activation
- Joint roadmaps: uptime & feature velocity
Partnerships power monetization: 197 stations in 112 markets
Key partnerships with networks, MVPDs/vMVPDs, sports rights holders, agencies and ad‑tech/data vendors secure content, carriage and monetization for Nexstar (197 stations in 112 markets; ~39% US TV households in 2024; 75% owner of The CW), driving retrans/carriage fees, high‑CPM live sports inventory and programmatic yield.
| Partner | Role | 2024 Metric |
|---|---|---|
| Stations/Networks | Content/affiliates | 197 stations; 112 markets |
| Distribution | Carriage/retrans | ~39% US TV households |
| Ad/Data/CDN | Monetization/measurement | CDN market ~$27B; Nielsen/Comscore |
What is included in the product
 Detailed Word Document
A concise, investor-ready Business Model Canvas for Nexstar Media Group outlining customer segments, channels, value propositions, revenue streams, key partners, activities, resources, cost structure and governance. Ideal for presentations—includes competitive advantages and linked SWOT insights to support strategic and financing decisions.

 Customizable Excel Spreadsheet
High-level, editable Business Model Canvas for Nexstar Media Group that condenses broadcast and digital strategy into a one-page snapshot, saving hours of structuring while enabling quick team collaboration and board-ready summaries.
Activities

Local news gathering and production
Local news—daily newscasts, investigative journalism and weather coverage—anchor Nexstar’s community relevance; as of 2024 Nexstar operates about 200 TV stations across roughly 120 U.S. markets. Field reporting, live shots and tight newsroom cycles enable rapid turnaround while editorial standards and compliance are enforced consistently. Breaking news operations produce measurable audience and ad demand spikes, often driving multi‑fold uplifts in linear and digital ratings.
National network programming and scheduling
Curating prime-time slates, promos, and strategic lead-ins drives reach and ratings across Nexstar’s portfolio, leveraging the company’s 197 owned or operated stations to maximize local-to-national audience flow. Cross-promotion aligns NewsNation, The CW (acquired in 2022) and local inventory to lift daypart yield and ad CPMs. Continuous performance analytics (real-time A/B testing and Nielsen metrics) enable rapid schedule adjustments to protect share and revenue.

Multi-platform distribution and streaming
Nexstar leverages linear broadcast, cable, OTT apps and FAST channels to extend reach across local stations, The CW and NewsNation; the company reported $4.53 billion revenue in 2023 per its 10-K. Encoding, CDN delivery and platform-specific rights windows are managed centrally. Authentication and server-side ad insertion are coordinated across environments, while QA and device certification preserve UX across dozens of device profiles.

Advertising sales and yield management
Local and national sales teams at Nexstar sell spot, sponsorships and bundled digital packages while programmatic pipes handle remnant and targeted demand; Nexstar reported total revenue of roughly $6.2B in 2023 with digital share rising into 2024.
Pricing, pacing and frequency caps drive eCPM optimization and post-campaign analytics feed renewals and upsell opportunities.
- Spot, sponsorships, digital bundles
- Programmatic remnant/targeting
- CPM/pacing/frequency caps
- Analytics for renewals
Regulatory, compliance, and spectrum management
- Stations: 197 in 113 markets
- Key controls: FCC licenses, public files, political ad rules
- Standards: EAS, closed captions, accessibility
- Risk reduction: audits and training
Local TV group: 197 stations, $6.2B 2023 fuel ad spikes
Local news, investigative reporting and weather anchor Nexstar across 197 stations in 113 U.S. markets (2024), producing audience and ad demand spikes. Programming, cross-promotion (The CW, NewsNation) and real-time scheduling analytics optimize CPMs and daypart yield. Multi-platform distribution (linear, OTT, FAST) and centralized ad tech supported roughly $6.2B revenue in 2023 with digital share rising into 2024.
| Metric | Value |
|---|---|
| Stations | 197 |
| Markets | 113 |
| Revenue (2023) | $6.2B |
| 2024 digital trend | Rising share |
Full Document Unlocks After Purchase
Business Model Canvas
The document you're previewing is the actual Nexstar Media Group Business Model Canvas, not a mockup. When you purchase, you'll receive this exact file—complete, editable and formatted—available in Word and Excel. No hidden sections or placeholders; what you see is what you'll download.

Local Media Business Model Canvas: Strategy, Revenue & Partnership Snapshot
Unlock the full strategic blueprint behind Nexstar Media Group with our Business Model Canvas. This concise, downloadable canvas maps value propositions, revenue streams, partnerships and cost structure to show how Nexstar scales and monetizes local media. Ideal for investors, strategists and founders—purchase the full Word/Excel canvas to benchmark, adapt, and act.
Partnerships
Network and content affiliates
Partnerships with major networks and studios secure prime-time programming and syndicated content for Nexstar’s local stations and its 75%‑owned CW, leveraging deals that balance license fees with audience draw and ad yield. As of 2024 Nexstar owns 197 TV stations in 112 markets reaching about 39% of US TV households. Long‑term affiliate agreements underpin schedule stability and national ad integration, with coordination ensuring brand standards and promotional alignment.
Distribution and carriage partners
MVPDs, vMVPDs and OTA partners extend Nexstar’s reach—Nexstar’s station group covers roughly 39% of U.S. TV households in 2024—while generating significant retransmission and carriage fees that underpin affiliate economics.
Carriage negotiations focus on maximizing revenue, penetration and packaging; partnerships govern channel placement, authentication and blackout management, with technical coordination ensuring signal quality and regulatory compliance.
Sports leagues and rights holders
Sports leagues and rights holders supply live-event programming that drives appointment viewing across Nexstar’s 200+ local TV stations and The CW, helping reach about 115 million US TV households. Agreements cover league packages, team-specific local rights and shoulder-content deals that expand programming depth. These rights create high-CPM ad inventory and boost affiliate carriage value, while co-marketing with leagues increases tune-in and fan engagement.
Advertising agencies and ad-tech platforms
Advertising agencies aggregate national demand for Nexstar, while ad-tech partners enable programmatic and addressable sales across linear and digital, improving yield and scale. Data partnerships enhance targeting and cross-platform measurement, linking set-top and CTV signals with first-party audience insights. Workflow integrations streamline trafficking and reporting, and preferred-status agreements secure better pricing and fill for national buys.
- Agencies: national demand aggregation
- Ad-tech: programmatic/addressable enablement
- Data: targeting & measurement
- Integrations: trafficking & reporting
- Preferred deals: pricing & fill
Technology, measurement, and data vendors
Nexstar partners with cloud, CDN, CMS, ATS, and analytics providers to enable multi-platform delivery and programmatic monetization, leveraging a 2024 CDN market (~27 billion USD) to scale reach. Measurement partners Nielsen and Comscore validate audience currency and campaign outcomes for agency buying. Identity and privacy vendors enable compliant data activation while joint roadmaps reduce latency, improve uptime, and accelerate feature velocity.
- Cloud/CDN: scale & latency
- Measurement: Nielsen/Comscore currency
- Identity/privacy: compliant activation
- Joint roadmaps: uptime & feature velocity
Partnerships power monetization: 197 stations in 112 markets
Key partnerships with networks, MVPDs/vMVPDs, sports rights holders, agencies and ad‑tech/data vendors secure content, carriage and monetization for Nexstar (197 stations in 112 markets; ~39% US TV households in 2024; 75% owner of The CW), driving retrans/carriage fees, high‑CPM live sports inventory and programmatic yield.
| Partner | Role | 2024 Metric |
|---|---|---|
| Stations/Networks | Content/affiliates | 197 stations; 112 markets |
| Distribution | Carriage/retrans | ~39% US TV households |
| Ad/Data/CDN | Monetization/measurement | CDN market ~$27B; Nielsen/Comscore |
What is included in the product
Detailed Word Document
A concise, investor-ready Business Model Canvas for Nexstar Media Group outlining customer segments, channels, value propositions, revenue streams, key partners, activities, resources, cost structure and governance. Ideal for presentations—includes competitive advantages and linked SWOT insights to support strategic and financing decisions.
Customizable Excel Spreadsheet
High-level, editable Business Model Canvas for Nexstar Media Group that condenses broadcast and digital strategy into a one-page snapshot, saving hours of structuring while enabling quick team collaboration and board-ready summaries.
Activities
Local news gathering and production
Local news—daily newscasts, investigative journalism and weather coverage—anchor Nexstar’s community relevance; as of 2024 Nexstar operates about 200 TV stations across roughly 120 U.S. markets. Field reporting, live shots and tight newsroom cycles enable rapid turnaround while editorial standards and compliance are enforced consistently. Breaking news operations produce measurable audience and ad demand spikes, often driving multi‑fold uplifts in linear and digital ratings.
National network programming and scheduling
Curating prime-time slates, promos, and strategic lead-ins drives reach and ratings across Nexstar’s portfolio, leveraging the company’s 197 owned or operated stations to maximize local-to-national audience flow. Cross-promotion aligns NewsNation, The CW (acquired in 2022) and local inventory to lift daypart yield and ad CPMs. Continuous performance analytics (real-time A/B testing and Nielsen metrics) enable rapid schedule adjustments to protect share and revenue.
Multi-platform distribution and streaming
Nexstar leverages linear broadcast, cable, OTT apps and FAST channels to extend reach across local stations, The CW and NewsNation; the company reported $4.53 billion revenue in 2023 per its 10-K. Encoding, CDN delivery and platform-specific rights windows are managed centrally. Authentication and server-side ad insertion are coordinated across environments, while QA and device certification preserve UX across dozens of device profiles.
Advertising sales and yield management
Local and national sales teams at Nexstar sell spot, sponsorships and bundled digital packages while programmatic pipes handle remnant and targeted demand; Nexstar reported total revenue of roughly $6.2B in 2023 with digital share rising into 2024.
Pricing, pacing and frequency caps drive eCPM optimization and post-campaign analytics feed renewals and upsell opportunities.
- Spot, sponsorships, digital bundles
- Programmatic remnant/targeting
- CPM/pacing/frequency caps
- Analytics for renewals
Regulatory, compliance, and spectrum management
- Stations: 197 in 113 markets
- Key controls: FCC licenses, public files, political ad rules
- Standards: EAS, closed captions, accessibility
- Risk reduction: audits and training
Local TV group: 197 stations, $6.2B 2023 fuel ad spikes
Local news, investigative reporting and weather anchor Nexstar across 197 stations in 113 U.S. markets (2024), producing audience and ad demand spikes. Programming, cross-promotion (The CW, NewsNation) and real-time scheduling analytics optimize CPMs and daypart yield. Multi-platform distribution (linear, OTT, FAST) and centralized ad tech supported roughly $6.2B revenue in 2023 with digital share rising into 2024.
| Metric | Value |
|---|---|
| Stations | 197 |
| Markets | 113 |
| Revenue (2023) | $6.2B |
| 2024 digital trend | Rising share |
Full Document Unlocks After Purchase
Business Model Canvas
The document you're previewing is the actual Nexstar Media Group Business Model Canvas, not a mockup. When you purchase, you'll receive this exact file—complete, editable and formatted—available in Word and Excel. No hidden sections or placeholders; what you see is what you'll download.
Original: $10.00
-65%$10.00
$3.50Description
Local Media Business Model Canvas: Strategy, Revenue & Partnership Snapshot
Unlock the full strategic blueprint behind Nexstar Media Group with our Business Model Canvas. This concise, downloadable canvas maps value propositions, revenue streams, partnerships and cost structure to show how Nexstar scales and monetizes local media. Ideal for investors, strategists and founders—purchase the full Word/Excel canvas to benchmark, adapt, and act.
Partnerships
Network and content affiliates
Partnerships with major networks and studios secure prime-time programming and syndicated content for Nexstar’s local stations and its 75%‑owned CW, leveraging deals that balance license fees with audience draw and ad yield. As of 2024 Nexstar owns 197 TV stations in 112 markets reaching about 39% of US TV households. Long‑term affiliate agreements underpin schedule stability and national ad integration, with coordination ensuring brand standards and promotional alignment.
Distribution and carriage partners
MVPDs, vMVPDs and OTA partners extend Nexstar’s reach—Nexstar’s station group covers roughly 39% of U.S. TV households in 2024—while generating significant retransmission and carriage fees that underpin affiliate economics.
Carriage negotiations focus on maximizing revenue, penetration and packaging; partnerships govern channel placement, authentication and blackout management, with technical coordination ensuring signal quality and regulatory compliance.
Sports leagues and rights holders
Sports leagues and rights holders supply live-event programming that drives appointment viewing across Nexstar’s 200+ local TV stations and The CW, helping reach about 115 million US TV households. Agreements cover league packages, team-specific local rights and shoulder-content deals that expand programming depth. These rights create high-CPM ad inventory and boost affiliate carriage value, while co-marketing with leagues increases tune-in and fan engagement.
Advertising agencies and ad-tech platforms
Advertising agencies aggregate national demand for Nexstar, while ad-tech partners enable programmatic and addressable sales across linear and digital, improving yield and scale. Data partnerships enhance targeting and cross-platform measurement, linking set-top and CTV signals with first-party audience insights. Workflow integrations streamline trafficking and reporting, and preferred-status agreements secure better pricing and fill for national buys.
- Agencies: national demand aggregation
- Ad-tech: programmatic/addressable enablement
- Data: targeting & measurement
- Integrations: trafficking & reporting
- Preferred deals: pricing & fill
Technology, measurement, and data vendors
Nexstar partners with cloud, CDN, CMS, ATS, and analytics providers to enable multi-platform delivery and programmatic monetization, leveraging a 2024 CDN market (~27 billion USD) to scale reach. Measurement partners Nielsen and Comscore validate audience currency and campaign outcomes for agency buying. Identity and privacy vendors enable compliant data activation while joint roadmaps reduce latency, improve uptime, and accelerate feature velocity.
- Cloud/CDN: scale & latency
- Measurement: Nielsen/Comscore currency
- Identity/privacy: compliant activation
- Joint roadmaps: uptime & feature velocity
Partnerships power monetization: 197 stations in 112 markets
Key partnerships with networks, MVPDs/vMVPDs, sports rights holders, agencies and ad‑tech/data vendors secure content, carriage and monetization for Nexstar (197 stations in 112 markets; ~39% US TV households in 2024; 75% owner of The CW), driving retrans/carriage fees, high‑CPM live sports inventory and programmatic yield.
| Partner | Role | 2024 Metric |
|---|---|---|
| Stations/Networks | Content/affiliates | 197 stations; 112 markets |
| Distribution | Carriage/retrans | ~39% US TV households |
| Ad/Data/CDN | Monetization/measurement | CDN market ~$27B; Nielsen/Comscore |
What is included in the product
Detailed Word Document
A concise, investor-ready Business Model Canvas for Nexstar Media Group outlining customer segments, channels, value propositions, revenue streams, key partners, activities, resources, cost structure and governance. Ideal for presentations—includes competitive advantages and linked SWOT insights to support strategic and financing decisions.
Customizable Excel Spreadsheet
High-level, editable Business Model Canvas for Nexstar Media Group that condenses broadcast and digital strategy into a one-page snapshot, saving hours of structuring while enabling quick team collaboration and board-ready summaries.
Activities
Local news gathering and production
Local news—daily newscasts, investigative journalism and weather coverage—anchor Nexstar’s community relevance; as of 2024 Nexstar operates about 200 TV stations across roughly 120 U.S. markets. Field reporting, live shots and tight newsroom cycles enable rapid turnaround while editorial standards and compliance are enforced consistently. Breaking news operations produce measurable audience and ad demand spikes, often driving multi‑fold uplifts in linear and digital ratings.
National network programming and scheduling
Curating prime-time slates, promos, and strategic lead-ins drives reach and ratings across Nexstar’s portfolio, leveraging the company’s 197 owned or operated stations to maximize local-to-national audience flow. Cross-promotion aligns NewsNation, The CW (acquired in 2022) and local inventory to lift daypart yield and ad CPMs. Continuous performance analytics (real-time A/B testing and Nielsen metrics) enable rapid schedule adjustments to protect share and revenue.
Multi-platform distribution and streaming
Nexstar leverages linear broadcast, cable, OTT apps and FAST channels to extend reach across local stations, The CW and NewsNation; the company reported $4.53 billion revenue in 2023 per its 10-K. Encoding, CDN delivery and platform-specific rights windows are managed centrally. Authentication and server-side ad insertion are coordinated across environments, while QA and device certification preserve UX across dozens of device profiles.
Advertising sales and yield management
Local and national sales teams at Nexstar sell spot, sponsorships and bundled digital packages while programmatic pipes handle remnant and targeted demand; Nexstar reported total revenue of roughly $6.2B in 2023 with digital share rising into 2024.
Pricing, pacing and frequency caps drive eCPM optimization and post-campaign analytics feed renewals and upsell opportunities.
- Spot, sponsorships, digital bundles
- Programmatic remnant/targeting
- CPM/pacing/frequency caps
- Analytics for renewals
Regulatory, compliance, and spectrum management
- Stations: 197 in 113 markets
- Key controls: FCC licenses, public files, political ad rules
- Standards: EAS, closed captions, accessibility
- Risk reduction: audits and training
Local TV group: 197 stations, $6.2B 2023 fuel ad spikes
Local news, investigative reporting and weather anchor Nexstar across 197 stations in 113 U.S. markets (2024), producing audience and ad demand spikes. Programming, cross-promotion (The CW, NewsNation) and real-time scheduling analytics optimize CPMs and daypart yield. Multi-platform distribution (linear, OTT, FAST) and centralized ad tech supported roughly $6.2B revenue in 2023 with digital share rising into 2024.
| Metric | Value |
|---|---|
| Stations | 197 |
| Markets | 113 |
| Revenue (2023) | $6.2B |
| 2024 digital trend | Rising share |
Full Document Unlocks After Purchase
Business Model Canvas
The document you're previewing is the actual Nexstar Media Group Business Model Canvas, not a mockup. When you purchase, you'll receive this exact file—complete, editable and formatted—available in Word and Excel. No hidden sections or placeholders; what you see is what you'll download.











