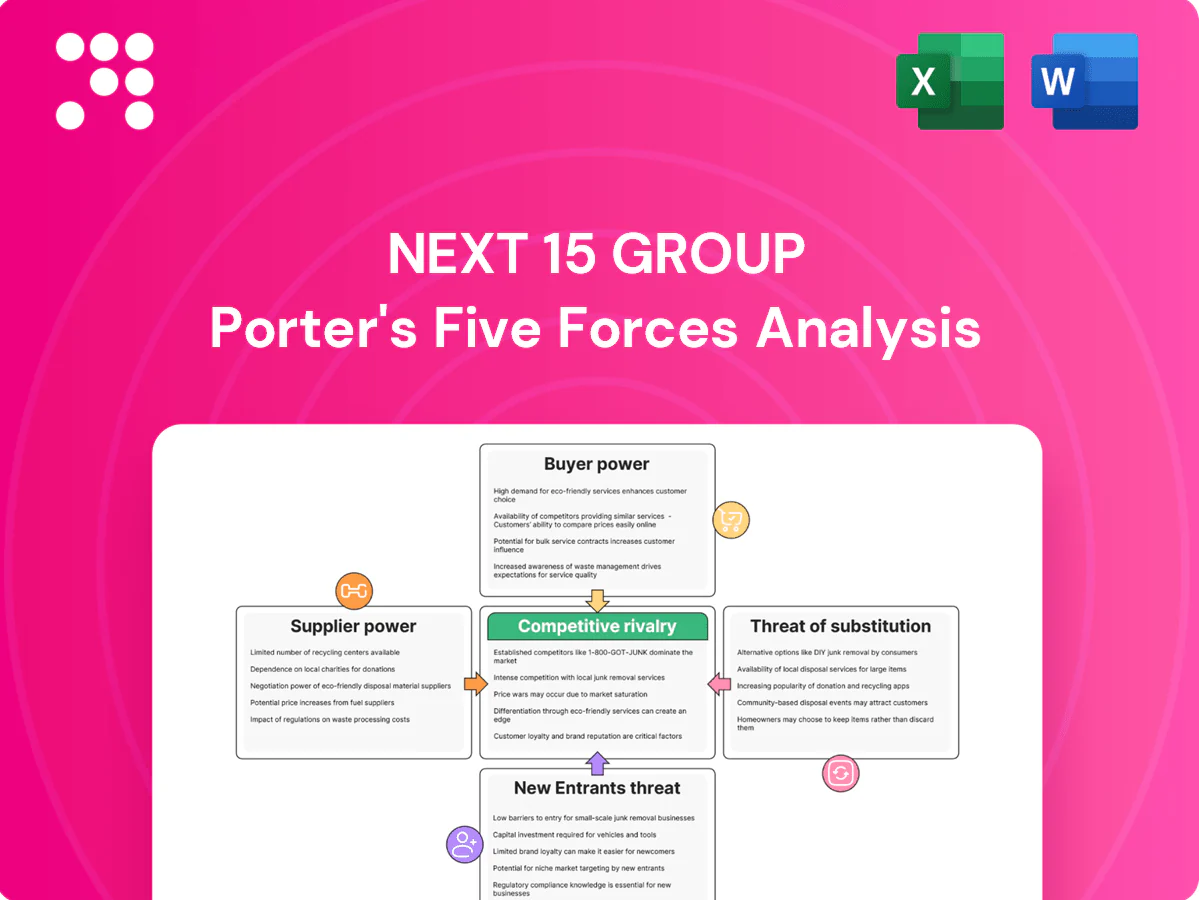
Next 15 Group Porter's Five Forces Analysis

Go Beyond the Preview—Access the Full Strategic Report
This snapshot outlines Next 15 Group’s competitive landscape across supplier power, buyer influence, rivalry, and threats from entrants and substitutes. It highlights key pressures on margins and growth but omits force-by-force detail and visuals. Unlock the full Porter's Five Forces Analysis for ratings, data-driven implications and a consultant-grade report to inform investment or strategy.
Suppliers Bargaining Power

Dependence on skilled talent
Creative, strategy, data and engineering talent are primary inputs, giving high-performing staff leverage on wages and flexibility in agency groups like Next 15. Scarcity in AI, martech and analytics increases switching costs as specialized skills are hard to replace. Robust retention programs and culture reduce churn, but freelancers and recruiters amplify supplier power. Geographic diversification helps, yet local market shortages still constrain capacity.
Platform and data ecosystem reliance
Dependence on platforms and data ecosystems—notably Adobe, Salesforce, Google (Alphabet reported $224.5B in ad revenue in 2023), and Meta (ad revenue $116.6B in 2023)—creates pricing and access risk for Next 15; API, privacy or fee changes can ripple through delivery models. Preferred partnership tiers mitigate but rarely remove vendor lock-in. Ongoing martech consolidation further concentrates supplier power and bargaining leverage.

Media inventory and ad-tech intermediaries
Media owners and SSP/DSP partners shape costs, data access and campaign performance; in 2024 Google and Meta accounted for over 50% of global digital ad spend, skewing supplier power to large platforms. Supply-path optimization can curb intermediary take-rates but bargaining remains uneven. Changes to auction mechanics or identity solutions in 2024 can materially impact margins. Negotiated volume deals lower fees but demand scale.

AI tools and model providers
Reliance on foundation models and AI SaaS concentrates supplier power: pricing, licensing and evolving compliance (eg EU AI Act developments in 2024) can inflate costs and force workflow rework as rapid model versioning demands retraining and integration spend; IP indemnities and data‑residency clauses vary across providers; building internal models reduces vendor dependence but increases capital expenditure and operational risk.
Research panels and third-party data
- Concentration: high supplier leverage
- 2024: GDPR limits alternative data
- Multi-sourcing: resilience vs complexity
- First-party data: reduces supplier power
Supplier power squeezes margins: scarce AI talent, platforms hold over 50% of spend
Supplier power is high: scarce AI/martech talent raises wages and switching costs. Major platforms concentrate pricing—Google ad rev $224.5B (2023) and Meta $116.6B (2023); together >50% digital ad spend (2024)—squeezing margins. Foundation models and panel providers centralize control; first-party data/internal models reduce dependence but raise capex.
| Supplier | 2023/24 data |
|---|---|
| $224.5B ad rev (2023) | |
| Meta | $116.6B ad rev (2023) |
| Regulation | GDPR enforcement tightened (2024) |
What is included in the product
 Detailed Word Document
Tailored Porter's Five Forces analysis for Next 15 Group highlighting competitive rivalry, buyer and supplier power, threat of substitutes and new entrants, and identifying disruptive forces and strategic protections.

 Customizable Excel Spreadsheet
A concise Porter's Five Forces snapshot for Next 15 Group—instantly highlights competitive intensity, client/supplier leverage, threat of substitutes and new entrants, and bargaining power to guide strategic decisions and investor analysis.
Customers Bargaining Power

Large enterprise clients
Large enterprise clients in 2024 demand volume-based discounts and stringent SLAs, leveraging multi-year, multi-market scopes to raise switching costs while preserving procurement leverage; consolidation into global rosters intensifies price pressure and drives agencies to accept performance-linked fees that transfer measurable revenue risk onto the agency.
Multi-agency competitive pitches
Frequent multi-agency RFPs let clients benchmark fees across holding groups, increasing buyer leverage and pressuring margins as pitch costs are sunk and unrecoverable. For Next 15, strong credentials and case studies shift decisions away from pure price-driven selection. Specialization and proprietary IP sustain rate cards by creating defensible differentiation.

Moderate switching costs
Process knowledge and data integrations create friction for customers, yet standard tools and APIs make transitions manageable, so buyers typically pursue phased migrations to cut risk and squeeze margin. Embedding Next 15 teams and owning data pipelines increases stickiness by aligning workflows and reducing operational disruption. However, contractual portability of creative and data assets preserves buyer options and limits long-term lock-in.

Measurement and ROI scrutiny
- Attribution rigour: MMM/MTA driving outcome fees
- Buyer trade-off: brand spend traded for performance
- Proof points: clean-room incrementality justifies premiums
- Transparency risk: dashboards expose underperformance
In-housing trend
- 2024 trend: more brands in-house
- Agency imperative: strategy, complex builds, surge
- Hybrid/co-location reduces risk
- Analytics gaps prevent complete replacement
Buyers wield leverage in 2024: outcome fees, MMM/MTA and in-housing squeeze agency margins
Buyers exert high leverage in 2024: outcome-based fees and MMM/MTA adoption push agencies toward performance-linked pricing, compressing margins. Multi-agency RFPs and global rosters enable benchmarking and cost-squeezing; Next 15 offsets with specialization, IP and data integrations that raise switching costs. In-housing rose in 2024, forcing agencies to focus on complex tech and surge capacity.
| Metric | 2024 |
|---|---|
| In-housing rise | 45% of brands reported increased in-housing |
| Outcome fees | ~30% of contracts include performance links |
What You See Is What You Get
Next 15 Group Porter's Five Forces Analysis
This preview is the exact Next 15 Group Porter's Five Forces Analysis you’ll receive—no placeholders or samples. The file shown is the final, fully formatted document ready for immediate download after purchase. Expect the same comprehensive analysis and professional layout upon payment.

Go Beyond the Preview—Access the Full Strategic Report
This snapshot outlines Next 15 Group’s competitive landscape across supplier power, buyer influence, rivalry, and threats from entrants and substitutes. It highlights key pressures on margins and growth but omits force-by-force detail and visuals. Unlock the full Porter's Five Forces Analysis for ratings, data-driven implications and a consultant-grade report to inform investment or strategy.
Suppliers Bargaining Power
Dependence on skilled talent
Creative, strategy, data and engineering talent are primary inputs, giving high-performing staff leverage on wages and flexibility in agency groups like Next 15. Scarcity in AI, martech and analytics increases switching costs as specialized skills are hard to replace. Robust retention programs and culture reduce churn, but freelancers and recruiters amplify supplier power. Geographic diversification helps, yet local market shortages still constrain capacity.
Platform and data ecosystem reliance
Dependence on platforms and data ecosystems—notably Adobe, Salesforce, Google (Alphabet reported $224.5B in ad revenue in 2023), and Meta (ad revenue $116.6B in 2023)—creates pricing and access risk for Next 15; API, privacy or fee changes can ripple through delivery models. Preferred partnership tiers mitigate but rarely remove vendor lock-in. Ongoing martech consolidation further concentrates supplier power and bargaining leverage.
Media inventory and ad-tech intermediaries
Media owners and SSP/DSP partners shape costs, data access and campaign performance; in 2024 Google and Meta accounted for over 50% of global digital ad spend, skewing supplier power to large platforms. Supply-path optimization can curb intermediary take-rates but bargaining remains uneven. Changes to auction mechanics or identity solutions in 2024 can materially impact margins. Negotiated volume deals lower fees but demand scale.
AI tools and model providers
Reliance on foundation models and AI SaaS concentrates supplier power: pricing, licensing and evolving compliance (eg EU AI Act developments in 2024) can inflate costs and force workflow rework as rapid model versioning demands retraining and integration spend; IP indemnities and data‑residency clauses vary across providers; building internal models reduces vendor dependence but increases capital expenditure and operational risk.
Research panels and third-party data
- Concentration: high supplier leverage
- 2024: GDPR limits alternative data
- Multi-sourcing: resilience vs complexity
- First-party data: reduces supplier power
Supplier power squeezes margins: scarce AI talent, platforms hold over 50% of spend
Supplier power is high: scarce AI/martech talent raises wages and switching costs. Major platforms concentrate pricing—Google ad rev $224.5B (2023) and Meta $116.6B (2023); together >50% digital ad spend (2024)—squeezing margins. Foundation models and panel providers centralize control; first-party data/internal models reduce dependence but raise capex.
| Supplier | 2023/24 data |
|---|---|
| $224.5B ad rev (2023) | |
| Meta | $116.6B ad rev (2023) |
| Regulation | GDPR enforcement tightened (2024) |
What is included in the product
Detailed Word Document
Tailored Porter's Five Forces analysis for Next 15 Group highlighting competitive rivalry, buyer and supplier power, threat of substitutes and new entrants, and identifying disruptive forces and strategic protections.
Customizable Excel Spreadsheet
A concise Porter's Five Forces snapshot for Next 15 Group—instantly highlights competitive intensity, client/supplier leverage, threat of substitutes and new entrants, and bargaining power to guide strategic decisions and investor analysis.
Customers Bargaining Power
Large enterprise clients
Large enterprise clients in 2024 demand volume-based discounts and stringent SLAs, leveraging multi-year, multi-market scopes to raise switching costs while preserving procurement leverage; consolidation into global rosters intensifies price pressure and drives agencies to accept performance-linked fees that transfer measurable revenue risk onto the agency.
Multi-agency competitive pitches
Frequent multi-agency RFPs let clients benchmark fees across holding groups, increasing buyer leverage and pressuring margins as pitch costs are sunk and unrecoverable. For Next 15, strong credentials and case studies shift decisions away from pure price-driven selection. Specialization and proprietary IP sustain rate cards by creating defensible differentiation.
Moderate switching costs
Process knowledge and data integrations create friction for customers, yet standard tools and APIs make transitions manageable, so buyers typically pursue phased migrations to cut risk and squeeze margin. Embedding Next 15 teams and owning data pipelines increases stickiness by aligning workflows and reducing operational disruption. However, contractual portability of creative and data assets preserves buyer options and limits long-term lock-in.
Measurement and ROI scrutiny
- Attribution rigour: MMM/MTA driving outcome fees
- Buyer trade-off: brand spend traded for performance
- Proof points: clean-room incrementality justifies premiums
- Transparency risk: dashboards expose underperformance
In-housing trend
- 2024 trend: more brands in-house
- Agency imperative: strategy, complex builds, surge
- Hybrid/co-location reduces risk
- Analytics gaps prevent complete replacement
Buyers wield leverage in 2024: outcome fees, MMM/MTA and in-housing squeeze agency margins
Buyers exert high leverage in 2024: outcome-based fees and MMM/MTA adoption push agencies toward performance-linked pricing, compressing margins. Multi-agency RFPs and global rosters enable benchmarking and cost-squeezing; Next 15 offsets with specialization, IP and data integrations that raise switching costs. In-housing rose in 2024, forcing agencies to focus on complex tech and surge capacity.
| Metric | 2024 |
|---|---|
| In-housing rise | 45% of brands reported increased in-housing |
| Outcome fees | ~30% of contracts include performance links |
What You See Is What You Get
Next 15 Group Porter's Five Forces Analysis
This preview is the exact Next 15 Group Porter's Five Forces Analysis you’ll receive—no placeholders or samples. The file shown is the final, fully formatted document ready for immediate download after purchase. Expect the same comprehensive analysis and professional layout upon payment.
Original: $10.00
-65%$10.00
$3.50Description
Go Beyond the Preview—Access the Full Strategic Report
This snapshot outlines Next 15 Group’s competitive landscape across supplier power, buyer influence, rivalry, and threats from entrants and substitutes. It highlights key pressures on margins and growth but omits force-by-force detail and visuals. Unlock the full Porter's Five Forces Analysis for ratings, data-driven implications and a consultant-grade report to inform investment or strategy.
Suppliers Bargaining Power
Dependence on skilled talent
Creative, strategy, data and engineering talent are primary inputs, giving high-performing staff leverage on wages and flexibility in agency groups like Next 15. Scarcity in AI, martech and analytics increases switching costs as specialized skills are hard to replace. Robust retention programs and culture reduce churn, but freelancers and recruiters amplify supplier power. Geographic diversification helps, yet local market shortages still constrain capacity.
Platform and data ecosystem reliance
Dependence on platforms and data ecosystems—notably Adobe, Salesforce, Google (Alphabet reported $224.5B in ad revenue in 2023), and Meta (ad revenue $116.6B in 2023)—creates pricing and access risk for Next 15; API, privacy or fee changes can ripple through delivery models. Preferred partnership tiers mitigate but rarely remove vendor lock-in. Ongoing martech consolidation further concentrates supplier power and bargaining leverage.
Media inventory and ad-tech intermediaries
Media owners and SSP/DSP partners shape costs, data access and campaign performance; in 2024 Google and Meta accounted for over 50% of global digital ad spend, skewing supplier power to large platforms. Supply-path optimization can curb intermediary take-rates but bargaining remains uneven. Changes to auction mechanics or identity solutions in 2024 can materially impact margins. Negotiated volume deals lower fees but demand scale.
AI tools and model providers
Reliance on foundation models and AI SaaS concentrates supplier power: pricing, licensing and evolving compliance (eg EU AI Act developments in 2024) can inflate costs and force workflow rework as rapid model versioning demands retraining and integration spend; IP indemnities and data‑residency clauses vary across providers; building internal models reduces vendor dependence but increases capital expenditure and operational risk.
Research panels and third-party data
- Concentration: high supplier leverage
- 2024: GDPR limits alternative data
- Multi-sourcing: resilience vs complexity
- First-party data: reduces supplier power
Supplier power squeezes margins: scarce AI talent, platforms hold over 50% of spend
Supplier power is high: scarce AI/martech talent raises wages and switching costs. Major platforms concentrate pricing—Google ad rev $224.5B (2023) and Meta $116.6B (2023); together >50% digital ad spend (2024)—squeezing margins. Foundation models and panel providers centralize control; first-party data/internal models reduce dependence but raise capex.
| Supplier | 2023/24 data |
|---|---|
| $224.5B ad rev (2023) | |
| Meta | $116.6B ad rev (2023) |
| Regulation | GDPR enforcement tightened (2024) |
What is included in the product
Detailed Word Document
Tailored Porter's Five Forces analysis for Next 15 Group highlighting competitive rivalry, buyer and supplier power, threat of substitutes and new entrants, and identifying disruptive forces and strategic protections.
Customizable Excel Spreadsheet
A concise Porter's Five Forces snapshot for Next 15 Group—instantly highlights competitive intensity, client/supplier leverage, threat of substitutes and new entrants, and bargaining power to guide strategic decisions and investor analysis.
Customers Bargaining Power
Large enterprise clients
Large enterprise clients in 2024 demand volume-based discounts and stringent SLAs, leveraging multi-year, multi-market scopes to raise switching costs while preserving procurement leverage; consolidation into global rosters intensifies price pressure and drives agencies to accept performance-linked fees that transfer measurable revenue risk onto the agency.
Multi-agency competitive pitches
Frequent multi-agency RFPs let clients benchmark fees across holding groups, increasing buyer leverage and pressuring margins as pitch costs are sunk and unrecoverable. For Next 15, strong credentials and case studies shift decisions away from pure price-driven selection. Specialization and proprietary IP sustain rate cards by creating defensible differentiation.
Moderate switching costs
Process knowledge and data integrations create friction for customers, yet standard tools and APIs make transitions manageable, so buyers typically pursue phased migrations to cut risk and squeeze margin. Embedding Next 15 teams and owning data pipelines increases stickiness by aligning workflows and reducing operational disruption. However, contractual portability of creative and data assets preserves buyer options and limits long-term lock-in.
Measurement and ROI scrutiny
- Attribution rigour: MMM/MTA driving outcome fees
- Buyer trade-off: brand spend traded for performance
- Proof points: clean-room incrementality justifies premiums
- Transparency risk: dashboards expose underperformance
In-housing trend
- 2024 trend: more brands in-house
- Agency imperative: strategy, complex builds, surge
- Hybrid/co-location reduces risk
- Analytics gaps prevent complete replacement
Buyers wield leverage in 2024: outcome fees, MMM/MTA and in-housing squeeze agency margins
Buyers exert high leverage in 2024: outcome-based fees and MMM/MTA adoption push agencies toward performance-linked pricing, compressing margins. Multi-agency RFPs and global rosters enable benchmarking and cost-squeezing; Next 15 offsets with specialization, IP and data integrations that raise switching costs. In-housing rose in 2024, forcing agencies to focus on complex tech and surge capacity.
| Metric | 2024 |
|---|---|
| In-housing rise | 45% of brands reported increased in-housing |
| Outcome fees | ~30% of contracts include performance links |
What You See Is What You Get
Next 15 Group Porter's Five Forces Analysis
This preview is the exact Next 15 Group Porter's Five Forces Analysis you’ll receive—no placeholders or samples. The file shown is the final, fully formatted document ready for immediate download after purchase. Expect the same comprehensive analysis and professional layout upon payment.











