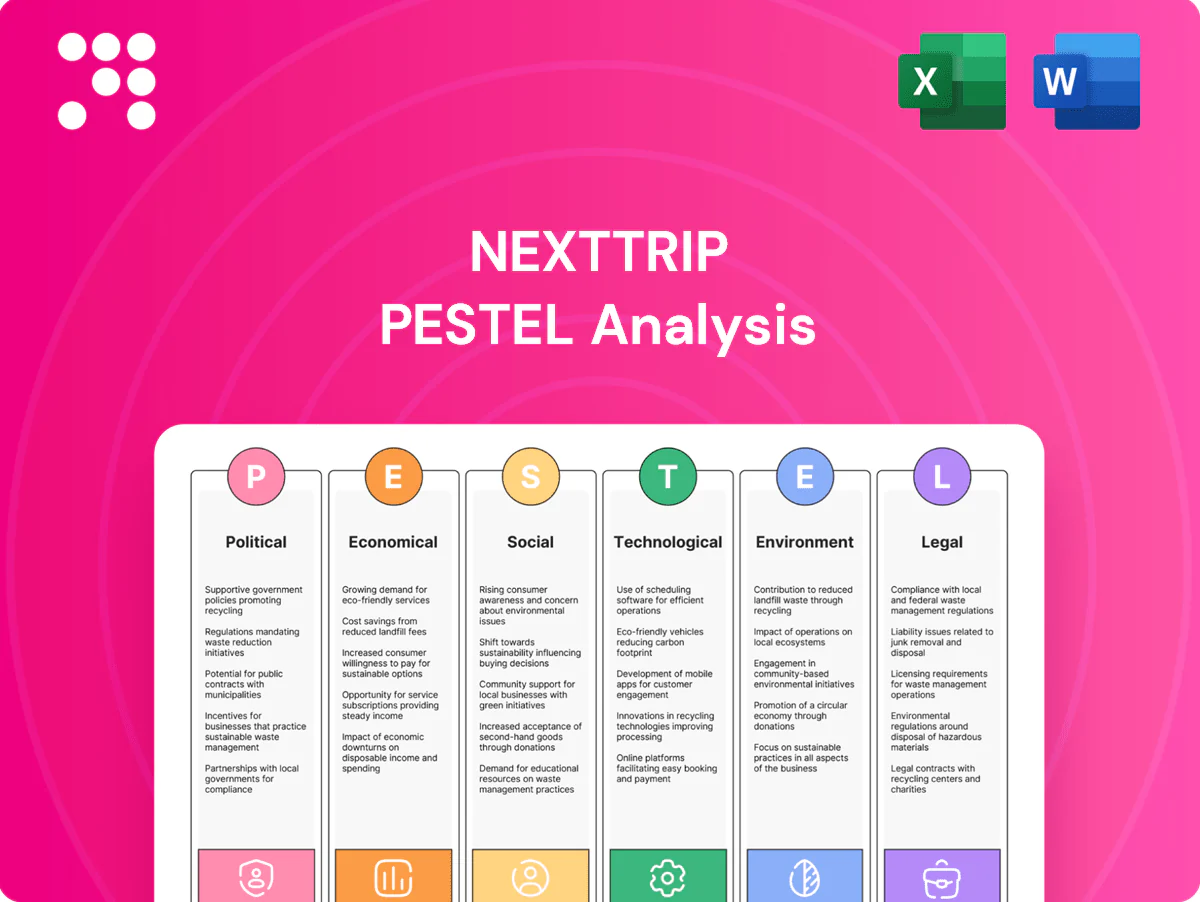
NextTrip PESTLE Analysis

Your Competitive Advantage Starts with This Report
Gain strategic advantage with our NextTrip PESTLE analysis—concise, data-driven and focused on political, economic, social, technological, legal and environmental forces. Ideal for investors and strategists, it reveals risks and opportunities shaping NextTrip's trajectory. Purchase the full report for instant, actionable intelligence.
Political factors

Cross-border travel policies
Shifting visa regimes, entry bans and evolving health rules (IATA: international RPKs ~88% of 2019 by 2024) change demand by corridor, so NextTrip must update inventory and traveler messaging in real time; integrations with GDSs and suppliers need geo-policy flags to prevent failed bookings, while proactive monitoring and automated alerts can cut cancellations and support contacts by up to 30%.
Government tourism incentives
Government tourism incentives and destination marketing have driven strong returns, with UNWTO reporting international tourist arrivals recovered to about 92% of 2019 levels in 2023, fueling regional spikes. NextTrip can target promotions and reweight inventory to capture uplift, while B2B partners often request custom packaging for funded routes. Tight ROI tracking links campaigns to conversion and ADR changes to validate spend.

Geopolitical instability risk
Conflicts and sanctions routinely disrupt airspace, routes, and supplier reliability, with IATA reporting global air traffic recovered to about 94% of 2019 levels in 2024, making reroutes more disruptive to demand and costs. NextTrip uses dynamic re-routing and blackout logic to preserve user experience during closures. A built-in risk score drives content suppression and targeted insurance upsell. Prewritten communication templates reduce churn by ensuring timely traveler notifications.

Data sovereignty mandates
Jurisdictions increasingly require local data residency and processing; non-compliance can trigger GDPR fines up to 4% of global turnover and PIPL penalties up to 50 million CNY or 5% of annual revenue. NextTrip’s architecture must support regional hosting and routing and contracts should embed localization clauses and audit rights to avoid partner loss and regulatory sanctions.
- Local residency: GDPR 4% turnover, PIPL 50M CNY/5% revenue
- Architecture: regional hosting + routing
- Contracts: data localization + audit rights
- Risk: fines, lost partners, enforcement escalation
Public infrastructure investment
Airport expansions and rail upgrades alter capacity and schedules, driven by the US 2021 Infrastructure Investment and Jobs Act totaling 1.2 trillion and including about 66 billion for rail improvements, creating new lanes for carriers and intermodal links. NextTrip can onboard new carriers and intermodal options faster than rivals; timely integrations improve availability and search relevance. Forecast-based traffic models guide API scaling and cache strategy to reduce timeout and stale results.
- Onboarding speed: competitive advantage
- Inventory relevance: timely integrations
- Scaling: forecasts inform API and cache sizing
Geo-policy flags, dynamic re-routing & regional hosting to navigate political, data risks
Political risks—changing visa/health rules (IATA: international RPKs ~88% of 2019 by 2024) and sanctions—shift demand by corridor and raise reroute costs (IATA: global traffic ~94% of 2019 in 2024), so NextTrip must enable geo-policy flags, dynamic re-routing and real-time messaging. Data laws (GDPR 4% turnover; PIPL 50M CNY/5% revenue) force regional hosting and contract clauses.
| Metric | 2023–24 |
|---|---|
| Intl RPKs | ~88% (2024) |
| Intl arrivals | ~92% (2023) |
| Air traffic | ~94% (2024) |
| GDPR/PIPL | 4% turnover / 50M CNY or 5% |
What is included in the product
 Detailed Word Document
Explores how Political, Economic, Social, Technological, Environmental and Legal forces uniquely affect NextTrip, with data-backed, region- and industry-specific insights and forward-looking scenarios. Designed for executives and investors to identify risks, opportunities and actionable strategies ready for decks and plans.

 Customizable Excel Spreadsheet
Cleanly summarized and visually segmented by PESTLE categories, the NextTrip PESTLE Analysis relieves meeting prep pain points by providing an easily shareable, editable summary that can be dropped into presentations or planning sessions for rapid alignment across teams.
Economic factors

Travel demand elasticity
Macro cycles and disposable income shifts strongly drive booking volumes: IATA data showed 2024 passenger demand roughly 102% of 2019 levels, reflecting income-led recovery in many markets. Price elasticity varies by segment and channel, with leisure more price-sensitive than business; OTA channels display higher short-term elasticity. NextTrip can optimize markups and bundling to stabilize take rates, using elasticity models to time promos and adjust inventory mix.
FX and cross-currency exposure
Multi-currency pricing directly affects conversion and margins as FX markets average about 7.5 trillion USD/day (BIS), with the US dollar involved in ~88% of trades, so passthrough and fees can swing margins by 3–5%. Volatility raises supplier costs and shifts consumer perception—recent heightened FX moves in 2023–24 increased price-change notifications and churn. Hedging programs and smart rounding keep displayed prices stable while reconciliation demands robust FX rate governance, clear cut-off times, and audit trails to avoid P&L leakage.

Airfare and hotel ADR cycles
Mid-2024 IATA data showed passenger demand recovered to roughly 2019 levels, and ancillary revenue now represents about 15% of airline income, so capacity shifts and rate management materially alter commissions and net rates. NextTrip should diversify suppliers to maintain depth across carriers and hotel chains to avoid single-source margin shocks. Implementing real-time yield rules can steer traffic to higher-margin SKUs and dynamic ADR windows (peak-to-trough swings often 10–25%) increase yield control. Granular reporting across channels pinpoints profitability and supports rapid repricing.

Corporate T&E budgets
Corporate T&E budgets drive B2B bookings that must align with enterprise travel policies and constrained budgets; global business travel pre-COVID was about 1.4 trillion USD in 2019 and GBTA noted recovery to roughly 85% of 2019 levels by 2023. Economic slowdowns compress managed travel while SMB segments tend to rebound earlier. NextTrip can enforce policy controls, surface negotiated content and provide analytics to quantify travel ROI.
- Policy-aligned bookings
- Negotiated fares & content
- Analytics to justify ROI
- SMB rebound earlier than enterprise
Cost of capital and burn
NextTrip's SaaS growth hinges on tight CAC and lean infrastructure spend to protect margins; with US policy rates around 5.25–5.50% in 2024–25, higher rates shorten runway and constrain M&A options. Prioritize high-LTV cohorts and automation to lower unit costs, and shift toward usage-based pricing to better align costs with revenue.
- Fed funds ~5.25–5.50% (2024–25)
- LTV:CAC target ~3x
- CAC payback ≤12 months
- Cloud infra often 20–30% of early ARR
- Usage-based pricing aligns cost/revenue
Geo-policy flags, dynamic re-routing & regional hosting to navigate political, data risks
Demand ~102% of 2019 (IATA 2024); leisure price-sensitive, OTAs higher elasticity; use elasticity-led promos and bundling. FX volatility (7.5T USD/day; USD in ~88% trades) can swing margins 3–5%—hedge and govern rates. Ancillaries ~15% of airline revenue; diversify suppliers, real-time yield rules, dynamic ADR. Fed funds ~5.25–5.50% (2024–25); target LTV:CAC ~3x, CAC payback ≤12m.
| Metric | Value |
|---|---|
| Passenger demand | ~102% of 2019 |
| FX turnover | 7.5T USD/day (USD ~88%) |
| Ancillary rev | ~15% |
| Fed funds | 5.25–5.50% |
| LTV:CAC | ~3x |
Preview the Actual Deliverable
NextTrip PESTLE Analysis
The preview of the NextTrip PESTLE Analysis is the exact, fully formatted document you’ll receive after purchase—professionally structured and ready to use. What you see here is the final file, with complete content and layout delivered immediately upon checkout.

Your Competitive Advantage Starts with This Report
Gain strategic advantage with our NextTrip PESTLE analysis—concise, data-driven and focused on political, economic, social, technological, legal and environmental forces. Ideal for investors and strategists, it reveals risks and opportunities shaping NextTrip's trajectory. Purchase the full report for instant, actionable intelligence.
Political factors
Cross-border travel policies
Shifting visa regimes, entry bans and evolving health rules (IATA: international RPKs ~88% of 2019 by 2024) change demand by corridor, so NextTrip must update inventory and traveler messaging in real time; integrations with GDSs and suppliers need geo-policy flags to prevent failed bookings, while proactive monitoring and automated alerts can cut cancellations and support contacts by up to 30%.
Government tourism incentives
Government tourism incentives and destination marketing have driven strong returns, with UNWTO reporting international tourist arrivals recovered to about 92% of 2019 levels in 2023, fueling regional spikes. NextTrip can target promotions and reweight inventory to capture uplift, while B2B partners often request custom packaging for funded routes. Tight ROI tracking links campaigns to conversion and ADR changes to validate spend.
Geopolitical instability risk
Conflicts and sanctions routinely disrupt airspace, routes, and supplier reliability, with IATA reporting global air traffic recovered to about 94% of 2019 levels in 2024, making reroutes more disruptive to demand and costs. NextTrip uses dynamic re-routing and blackout logic to preserve user experience during closures. A built-in risk score drives content suppression and targeted insurance upsell. Prewritten communication templates reduce churn by ensuring timely traveler notifications.
Data sovereignty mandates
Jurisdictions increasingly require local data residency and processing; non-compliance can trigger GDPR fines up to 4% of global turnover and PIPL penalties up to 50 million CNY or 5% of annual revenue. NextTrip’s architecture must support regional hosting and routing and contracts should embed localization clauses and audit rights to avoid partner loss and regulatory sanctions.
- Local residency: GDPR 4% turnover, PIPL 50M CNY/5% revenue
- Architecture: regional hosting + routing
- Contracts: data localization + audit rights
- Risk: fines, lost partners, enforcement escalation
Public infrastructure investment
Airport expansions and rail upgrades alter capacity and schedules, driven by the US 2021 Infrastructure Investment and Jobs Act totaling 1.2 trillion and including about 66 billion for rail improvements, creating new lanes for carriers and intermodal links. NextTrip can onboard new carriers and intermodal options faster than rivals; timely integrations improve availability and search relevance. Forecast-based traffic models guide API scaling and cache strategy to reduce timeout and stale results.
- Onboarding speed: competitive advantage
- Inventory relevance: timely integrations
- Scaling: forecasts inform API and cache sizing
Geo-policy flags, dynamic re-routing & regional hosting to navigate political, data risks
Political risks—changing visa/health rules (IATA: international RPKs ~88% of 2019 by 2024) and sanctions—shift demand by corridor and raise reroute costs (IATA: global traffic ~94% of 2019 in 2024), so NextTrip must enable geo-policy flags, dynamic re-routing and real-time messaging. Data laws (GDPR 4% turnover; PIPL 50M CNY/5% revenue) force regional hosting and contract clauses.
| Metric | 2023–24 |
|---|---|
| Intl RPKs | ~88% (2024) |
| Intl arrivals | ~92% (2023) |
| Air traffic | ~94% (2024) |
| GDPR/PIPL | 4% turnover / 50M CNY or 5% |
What is included in the product
Detailed Word Document
Explores how Political, Economic, Social, Technological, Environmental and Legal forces uniquely affect NextTrip, with data-backed, region- and industry-specific insights and forward-looking scenarios. Designed for executives and investors to identify risks, opportunities and actionable strategies ready for decks and plans.
Customizable Excel Spreadsheet
Cleanly summarized and visually segmented by PESTLE categories, the NextTrip PESTLE Analysis relieves meeting prep pain points by providing an easily shareable, editable summary that can be dropped into presentations or planning sessions for rapid alignment across teams.
Economic factors
Travel demand elasticity
Macro cycles and disposable income shifts strongly drive booking volumes: IATA data showed 2024 passenger demand roughly 102% of 2019 levels, reflecting income-led recovery in many markets. Price elasticity varies by segment and channel, with leisure more price-sensitive than business; OTA channels display higher short-term elasticity. NextTrip can optimize markups and bundling to stabilize take rates, using elasticity models to time promos and adjust inventory mix.
FX and cross-currency exposure
Multi-currency pricing directly affects conversion and margins as FX markets average about 7.5 trillion USD/day (BIS), with the US dollar involved in ~88% of trades, so passthrough and fees can swing margins by 3–5%. Volatility raises supplier costs and shifts consumer perception—recent heightened FX moves in 2023–24 increased price-change notifications and churn. Hedging programs and smart rounding keep displayed prices stable while reconciliation demands robust FX rate governance, clear cut-off times, and audit trails to avoid P&L leakage.
Airfare and hotel ADR cycles
Mid-2024 IATA data showed passenger demand recovered to roughly 2019 levels, and ancillary revenue now represents about 15% of airline income, so capacity shifts and rate management materially alter commissions and net rates. NextTrip should diversify suppliers to maintain depth across carriers and hotel chains to avoid single-source margin shocks. Implementing real-time yield rules can steer traffic to higher-margin SKUs and dynamic ADR windows (peak-to-trough swings often 10–25%) increase yield control. Granular reporting across channels pinpoints profitability and supports rapid repricing.
Corporate T&E budgets
Corporate T&E budgets drive B2B bookings that must align with enterprise travel policies and constrained budgets; global business travel pre-COVID was about 1.4 trillion USD in 2019 and GBTA noted recovery to roughly 85% of 2019 levels by 2023. Economic slowdowns compress managed travel while SMB segments tend to rebound earlier. NextTrip can enforce policy controls, surface negotiated content and provide analytics to quantify travel ROI.
- Policy-aligned bookings
- Negotiated fares & content
- Analytics to justify ROI
- SMB rebound earlier than enterprise
Cost of capital and burn
NextTrip's SaaS growth hinges on tight CAC and lean infrastructure spend to protect margins; with US policy rates around 5.25–5.50% in 2024–25, higher rates shorten runway and constrain M&A options. Prioritize high-LTV cohorts and automation to lower unit costs, and shift toward usage-based pricing to better align costs with revenue.
- Fed funds ~5.25–5.50% (2024–25)
- LTV:CAC target ~3x
- CAC payback ≤12 months
- Cloud infra often 20–30% of early ARR
- Usage-based pricing aligns cost/revenue
Geo-policy flags, dynamic re-routing & regional hosting to navigate political, data risks
Demand ~102% of 2019 (IATA 2024); leisure price-sensitive, OTAs higher elasticity; use elasticity-led promos and bundling. FX volatility (7.5T USD/day; USD in ~88% trades) can swing margins 3–5%—hedge and govern rates. Ancillaries ~15% of airline revenue; diversify suppliers, real-time yield rules, dynamic ADR. Fed funds ~5.25–5.50% (2024–25); target LTV:CAC ~3x, CAC payback ≤12m.
| Metric | Value |
|---|---|
| Passenger demand | ~102% of 2019 |
| FX turnover | 7.5T USD/day (USD ~88%) |
| Ancillary rev | ~15% |
| Fed funds | 5.25–5.50% |
| LTV:CAC | ~3x |
Preview the Actual Deliverable
NextTrip PESTLE Analysis
The preview of the NextTrip PESTLE Analysis is the exact, fully formatted document you’ll receive after purchase—professionally structured and ready to use. What you see here is the final file, with complete content and layout delivered immediately upon checkout.
Original: $10.00
-65%$10.00
$3.50Description
Your Competitive Advantage Starts with This Report
Gain strategic advantage with our NextTrip PESTLE analysis—concise, data-driven and focused on political, economic, social, technological, legal and environmental forces. Ideal for investors and strategists, it reveals risks and opportunities shaping NextTrip's trajectory. Purchase the full report for instant, actionable intelligence.
Political factors
Cross-border travel policies
Shifting visa regimes, entry bans and evolving health rules (IATA: international RPKs ~88% of 2019 by 2024) change demand by corridor, so NextTrip must update inventory and traveler messaging in real time; integrations with GDSs and suppliers need geo-policy flags to prevent failed bookings, while proactive monitoring and automated alerts can cut cancellations and support contacts by up to 30%.
Government tourism incentives
Government tourism incentives and destination marketing have driven strong returns, with UNWTO reporting international tourist arrivals recovered to about 92% of 2019 levels in 2023, fueling regional spikes. NextTrip can target promotions and reweight inventory to capture uplift, while B2B partners often request custom packaging for funded routes. Tight ROI tracking links campaigns to conversion and ADR changes to validate spend.
Geopolitical instability risk
Conflicts and sanctions routinely disrupt airspace, routes, and supplier reliability, with IATA reporting global air traffic recovered to about 94% of 2019 levels in 2024, making reroutes more disruptive to demand and costs. NextTrip uses dynamic re-routing and blackout logic to preserve user experience during closures. A built-in risk score drives content suppression and targeted insurance upsell. Prewritten communication templates reduce churn by ensuring timely traveler notifications.
Data sovereignty mandates
Jurisdictions increasingly require local data residency and processing; non-compliance can trigger GDPR fines up to 4% of global turnover and PIPL penalties up to 50 million CNY or 5% of annual revenue. NextTrip’s architecture must support regional hosting and routing and contracts should embed localization clauses and audit rights to avoid partner loss and regulatory sanctions.
- Local residency: GDPR 4% turnover, PIPL 50M CNY/5% revenue
- Architecture: regional hosting + routing
- Contracts: data localization + audit rights
- Risk: fines, lost partners, enforcement escalation
Public infrastructure investment
Airport expansions and rail upgrades alter capacity and schedules, driven by the US 2021 Infrastructure Investment and Jobs Act totaling 1.2 trillion and including about 66 billion for rail improvements, creating new lanes for carriers and intermodal links. NextTrip can onboard new carriers and intermodal options faster than rivals; timely integrations improve availability and search relevance. Forecast-based traffic models guide API scaling and cache strategy to reduce timeout and stale results.
- Onboarding speed: competitive advantage
- Inventory relevance: timely integrations
- Scaling: forecasts inform API and cache sizing
Geo-policy flags, dynamic re-routing & regional hosting to navigate political, data risks
Political risks—changing visa/health rules (IATA: international RPKs ~88% of 2019 by 2024) and sanctions—shift demand by corridor and raise reroute costs (IATA: global traffic ~94% of 2019 in 2024), so NextTrip must enable geo-policy flags, dynamic re-routing and real-time messaging. Data laws (GDPR 4% turnover; PIPL 50M CNY/5% revenue) force regional hosting and contract clauses.
| Metric | 2023–24 |
|---|---|
| Intl RPKs | ~88% (2024) |
| Intl arrivals | ~92% (2023) |
| Air traffic | ~94% (2024) |
| GDPR/PIPL | 4% turnover / 50M CNY or 5% |
What is included in the product
Detailed Word Document
Explores how Political, Economic, Social, Technological, Environmental and Legal forces uniquely affect NextTrip, with data-backed, region- and industry-specific insights and forward-looking scenarios. Designed for executives and investors to identify risks, opportunities and actionable strategies ready for decks and plans.
Customizable Excel Spreadsheet
Cleanly summarized and visually segmented by PESTLE categories, the NextTrip PESTLE Analysis relieves meeting prep pain points by providing an easily shareable, editable summary that can be dropped into presentations or planning sessions for rapid alignment across teams.
Economic factors
Travel demand elasticity
Macro cycles and disposable income shifts strongly drive booking volumes: IATA data showed 2024 passenger demand roughly 102% of 2019 levels, reflecting income-led recovery in many markets. Price elasticity varies by segment and channel, with leisure more price-sensitive than business; OTA channels display higher short-term elasticity. NextTrip can optimize markups and bundling to stabilize take rates, using elasticity models to time promos and adjust inventory mix.
FX and cross-currency exposure
Multi-currency pricing directly affects conversion and margins as FX markets average about 7.5 trillion USD/day (BIS), with the US dollar involved in ~88% of trades, so passthrough and fees can swing margins by 3–5%. Volatility raises supplier costs and shifts consumer perception—recent heightened FX moves in 2023–24 increased price-change notifications and churn. Hedging programs and smart rounding keep displayed prices stable while reconciliation demands robust FX rate governance, clear cut-off times, and audit trails to avoid P&L leakage.
Airfare and hotel ADR cycles
Mid-2024 IATA data showed passenger demand recovered to roughly 2019 levels, and ancillary revenue now represents about 15% of airline income, so capacity shifts and rate management materially alter commissions and net rates. NextTrip should diversify suppliers to maintain depth across carriers and hotel chains to avoid single-source margin shocks. Implementing real-time yield rules can steer traffic to higher-margin SKUs and dynamic ADR windows (peak-to-trough swings often 10–25%) increase yield control. Granular reporting across channels pinpoints profitability and supports rapid repricing.
Corporate T&E budgets
Corporate T&E budgets drive B2B bookings that must align with enterprise travel policies and constrained budgets; global business travel pre-COVID was about 1.4 trillion USD in 2019 and GBTA noted recovery to roughly 85% of 2019 levels by 2023. Economic slowdowns compress managed travel while SMB segments tend to rebound earlier. NextTrip can enforce policy controls, surface negotiated content and provide analytics to quantify travel ROI.
- Policy-aligned bookings
- Negotiated fares & content
- Analytics to justify ROI
- SMB rebound earlier than enterprise
Cost of capital and burn
NextTrip's SaaS growth hinges on tight CAC and lean infrastructure spend to protect margins; with US policy rates around 5.25–5.50% in 2024–25, higher rates shorten runway and constrain M&A options. Prioritize high-LTV cohorts and automation to lower unit costs, and shift toward usage-based pricing to better align costs with revenue.
- Fed funds ~5.25–5.50% (2024–25)
- LTV:CAC target ~3x
- CAC payback ≤12 months
- Cloud infra often 20–30% of early ARR
- Usage-based pricing aligns cost/revenue
Geo-policy flags, dynamic re-routing & regional hosting to navigate political, data risks
Demand ~102% of 2019 (IATA 2024); leisure price-sensitive, OTAs higher elasticity; use elasticity-led promos and bundling. FX volatility (7.5T USD/day; USD in ~88% trades) can swing margins 3–5%—hedge and govern rates. Ancillaries ~15% of airline revenue; diversify suppliers, real-time yield rules, dynamic ADR. Fed funds ~5.25–5.50% (2024–25); target LTV:CAC ~3x, CAC payback ≤12m.
| Metric | Value |
|---|---|
| Passenger demand | ~102% of 2019 |
| FX turnover | 7.5T USD/day (USD ~88%) |
| Ancillary rev | ~15% |
| Fed funds | 5.25–5.50% |
| LTV:CAC | ~3x |
Preview the Actual Deliverable
NextTrip PESTLE Analysis
The preview of the NextTrip PESTLE Analysis is the exact, fully formatted document you’ll receive after purchase—professionally structured and ready to use. What you see here is the final file, with complete content and layout delivered immediately upon checkout.











