NFI Industries Porter's Five Forces Analysis

From Overview to Strategy Blueprint
NFI Industries faces moderate supplier power and high buyer expectations in a crowded logistics market. Rivalry and substitute threats intensify margin pressure, while barriers to entry keep new competitors limited. This brief snapshot only scratches the surface. Unlock the full Porter's Five Forces Analysis to explore NFI Industries’s competitive dynamics, market pressures, and strategic advantages in detail.
Suppliers Bargaining Power

Fuel and energy volatility
Diesel and energy suppliers exert indirect power over NFI through price swings that materially raise operating costs; 2024 saw tightened markets after OPEC+ production adjustments, amplifying volatility. Fuel surcharges mitigate some cost but often miss timing mismatches and full spikes. Long-term hedging and fuel-efficiency programs cut exposure, yet suppliers keep leverage during sudden shocks as refining capacity and geopolitics constrain supply.
Equipment OEMs and leasing capacity
Truck, trailer and chassis OEMs plus lessors dictate delivery lead times, specs and pricing; industry lead times remain elevated in 2024 at roughly 6–12 months due to capacity and supply-chain constraints. When order books fill or credit tightens, procurement leverage shifts to suppliers, raising unit costs and wait times. Standardization and multi-sourcing lower risk, yet long replacement cycles and tightening ZEV/emissions mandates (California ACT and federal pushes through 2030s) keep dependence high. Maintenance-parts shortages and aftermarket concentration further amplify supplier leverage.

Ports, railroads, and terminal operators
Ports, ocean terminals and six U.S. Class I railroads — which together operate over 140,000 route miles — act as chokepoints with few substitutes on key corridors, so access, slot allocations, dwell policies and terminal fees directly shape NFI’s service reliability and costs. Supplier leverage spikes during congestion, compressing lead times and raising demurrage/warping charges. Long-term contracts mitigate some exposure, but multi-year infrastructure scarcity keeps their bargaining power elevated.

Labor markets and unions
Labor availability shapes supplier power at NFI: U.S. warehousing employment exceeded 1 million jobs in 2024 (BLS), and tight markets plus high-profile work actions raise wage demands and disruption risk, especially in unionized pockets where negotiated raises materially increase operating cost.
- Driver availability strains capacity
- Warehouse wages up y/y, pressure on margins
- Union segments = higher pay + disruption risk
- Training and automation mitigate but do not remove exposure
- Regional labor gaps create uneven leverage
Technology vendors and real estate owners
Technology vendors (TMS/WMS) and Class A industrial landlords exert switching-cost power over NFI: multi-year TMS/WMS contracts and mission-critical integrations with carriers reduce churn, while coastal/metro Class A vacancy rates remained tight in 2024 (commonly under 6%), increasing dependency on scarce space and driving higher rent escalation.
- Multi-year TMS/WMS contracts: 3–7 years
- Lease escalators commonly 3–5% annually
- Class A vacancy near ports often <6% (2024)
- Vendor diversification and owned real estate partially mitigate leverage
Logistics suppliers hold leverage over NFI amid fuel shocks, OEM lead times and tight labor
Suppliers wield elevated leverage over NFI via fuel volatility (2024 OPEC+ tightening), OEM lead times ~6–12 months, chokepoint ports/Class I rail (140,000 route miles), and tight labor (U.S. warehousing >1M jobs). Long-term TMS/WMS contracts (3–7 yrs) and coastal Class A vacancy <6% sustain switching costs; hedging, multi-sourcing and owned real estate partially mitigate.
| Metric | 2024 |
|---|---|
| OEM lead times | 6–12 months |
| Route miles (Class I) | 140,000 |
| Warehousing jobs (US) | >1,000,000 |
| Class A vacancy | <6% |
| TMS/WMS terms | 3–7 yrs |
What is included in the product
 Detailed Word Document
Uncovers key drivers of competition, customer influence, supplier power, and market entry risks tailored to NFI Industries, identifying substitutes, disruptive threats, and pricing pressures that affect profitability and market share.

 Customizable Excel Spreadsheet
A concise one-sheet Porter's Five Forces for NFI Industries—instantly highlight competitive pressures, prioritize strategic responses, and export a clean radar chart for decks or scenario tabs to ease boardroom decision-making.
Customers Bargaining Power

Large shippers with scale RFPs
Enterprise shippers aggregate high volumes through scale RFPs, forcing competitive bids and rate concessions across hundreds of lanes. They can shift lanes among providers to optimize cost and service, increasing pressure on margin. Multi-year bids (commonly 2–5 years) increase visibility but institutionalize price pressure. Performance scorecards intensify accountability and switching threats via service KPIs.
Service bundling and network scope
Customers seeking end-to-end solutions negotiate bundle discounts and cross-selling raises stickiness, yet buyers use broader scope to push for better pricing; the global 3PL market reached about $1.3 trillion in 2024, making scale a major bargaining lever. Global coverage and modal optionality are table stakes in negotiations, and failure to offer breadth weakens pricing power and margin resilience.

Commoditized lanes and low differentiation
On commoditized standard lanes service becomes price-led and interchangeable, as seen in 2024 when spot-market activity kept procurement focused on cost rather than capability. Buyers face minimal switching costs when basic KPIs are met by multiple providers, and spot markets amplify price transparency and downward pressure. To resist discounting, differentiation must come from measurable reliability, end-to-end visibility, and bundled value-added services.

Data, visibility, and KPI commitments
In 2024 shippers demand real-time tracking, EDI/API fidelity, and granular analytics, pushing NFI to embed high-frequency telemetry and data lakes into operations. SLA penalties and continuous improvement targets transfer cost and performance risk to the provider, while rigorous reporting creates buyer oversight and renegotiation leverage. Superior data capabilities help retain clients but also raise future expectations.
- Real-time visibility
- SLA-driven risk
- Reporting = leverage
- Data = retention + higher bar
Contracting terms and seasonality
- Volume variability: leverage point for buyers
- Peak surcharges: focal negotiation item
- Index-linked rates/mini-bids: buyer tools
- Capacity reservations/dynamic pricing: provider counters
Enterprise shippers drive price pressure; multiyear bids and SLAs reshape logistics
Enterprise shippers drive hard price pressure via scale RFPs and lane-switching; multi-year bids (commonly 2–5 years) institutionalize bargaining and performance scorecards raise switching threats. Commoditized lanes and 2024 spot-market dynamics prioritize cost over capability, while demand for real-time visibility and SLAs shifts risk onto providers. Buyers leverage volume variability and index-linked rates; providers counter with capacity reservations and dynamic pricing.
| Metric | 2024 Data |
|---|---|
| Global 3PL market | $1.3 trillion |
| Common contract length | 2–5 years |
Preview the Actual Deliverable
NFI Industries Porter's Five Forces Analysis
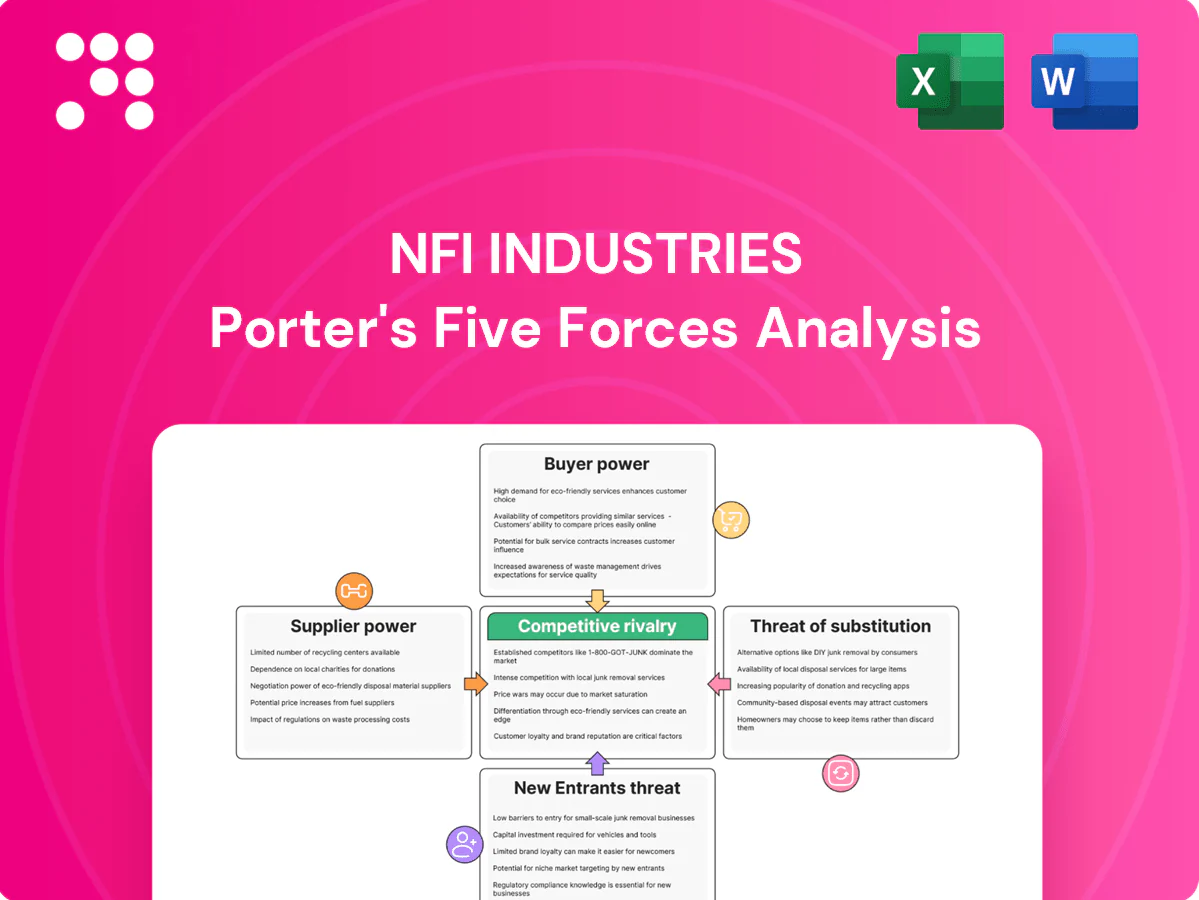
This preview shows the exact NFI Industries Porter's Five Forces analysis you'll receive upon purchase—no placeholders or samples. It is the complete, professionally formatted report with supplier, buyer, competitive rivalry, threat of entry, and substitute assessments. Instant download and ready for use.

From Overview to Strategy Blueprint
NFI Industries faces moderate supplier power and high buyer expectations in a crowded logistics market. Rivalry and substitute threats intensify margin pressure, while barriers to entry keep new competitors limited. This brief snapshot only scratches the surface. Unlock the full Porter's Five Forces Analysis to explore NFI Industries’s competitive dynamics, market pressures, and strategic advantages in detail.
Suppliers Bargaining Power
Fuel and energy volatility
Diesel and energy suppliers exert indirect power over NFI through price swings that materially raise operating costs; 2024 saw tightened markets after OPEC+ production adjustments, amplifying volatility. Fuel surcharges mitigate some cost but often miss timing mismatches and full spikes. Long-term hedging and fuel-efficiency programs cut exposure, yet suppliers keep leverage during sudden shocks as refining capacity and geopolitics constrain supply.
Equipment OEMs and leasing capacity
Truck, trailer and chassis OEMs plus lessors dictate delivery lead times, specs and pricing; industry lead times remain elevated in 2024 at roughly 6–12 months due to capacity and supply-chain constraints. When order books fill or credit tightens, procurement leverage shifts to suppliers, raising unit costs and wait times. Standardization and multi-sourcing lower risk, yet long replacement cycles and tightening ZEV/emissions mandates (California ACT and federal pushes through 2030s) keep dependence high. Maintenance-parts shortages and aftermarket concentration further amplify supplier leverage.
Ports, railroads, and terminal operators
Ports, ocean terminals and six U.S. Class I railroads — which together operate over 140,000 route miles — act as chokepoints with few substitutes on key corridors, so access, slot allocations, dwell policies and terminal fees directly shape NFI’s service reliability and costs. Supplier leverage spikes during congestion, compressing lead times and raising demurrage/warping charges. Long-term contracts mitigate some exposure, but multi-year infrastructure scarcity keeps their bargaining power elevated.
Labor markets and unions
Labor availability shapes supplier power at NFI: U.S. warehousing employment exceeded 1 million jobs in 2024 (BLS), and tight markets plus high-profile work actions raise wage demands and disruption risk, especially in unionized pockets where negotiated raises materially increase operating cost.
- Driver availability strains capacity
- Warehouse wages up y/y, pressure on margins
- Union segments = higher pay + disruption risk
- Training and automation mitigate but do not remove exposure
- Regional labor gaps create uneven leverage
Technology vendors and real estate owners
Technology vendors (TMS/WMS) and Class A industrial landlords exert switching-cost power over NFI: multi-year TMS/WMS contracts and mission-critical integrations with carriers reduce churn, while coastal/metro Class A vacancy rates remained tight in 2024 (commonly under 6%), increasing dependency on scarce space and driving higher rent escalation.
- Multi-year TMS/WMS contracts: 3–7 years
- Lease escalators commonly 3–5% annually
- Class A vacancy near ports often <6% (2024)
- Vendor diversification and owned real estate partially mitigate leverage
Logistics suppliers hold leverage over NFI amid fuel shocks, OEM lead times and tight labor
Suppliers wield elevated leverage over NFI via fuel volatility (2024 OPEC+ tightening), OEM lead times ~6–12 months, chokepoint ports/Class I rail (140,000 route miles), and tight labor (U.S. warehousing >1M jobs). Long-term TMS/WMS contracts (3–7 yrs) and coastal Class A vacancy <6% sustain switching costs; hedging, multi-sourcing and owned real estate partially mitigate.
| Metric | 2024 |
|---|---|
| OEM lead times | 6–12 months |
| Route miles (Class I) | 140,000 |
| Warehousing jobs (US) | >1,000,000 |
| Class A vacancy | <6% |
| TMS/WMS terms | 3–7 yrs |
What is included in the product
Detailed Word Document
Uncovers key drivers of competition, customer influence, supplier power, and market entry risks tailored to NFI Industries, identifying substitutes, disruptive threats, and pricing pressures that affect profitability and market share.
Customizable Excel Spreadsheet
A concise one-sheet Porter's Five Forces for NFI Industries—instantly highlight competitive pressures, prioritize strategic responses, and export a clean radar chart for decks or scenario tabs to ease boardroom decision-making.
Customers Bargaining Power
Large shippers with scale RFPs
Enterprise shippers aggregate high volumes through scale RFPs, forcing competitive bids and rate concessions across hundreds of lanes. They can shift lanes among providers to optimize cost and service, increasing pressure on margin. Multi-year bids (commonly 2–5 years) increase visibility but institutionalize price pressure. Performance scorecards intensify accountability and switching threats via service KPIs.
Service bundling and network scope
Customers seeking end-to-end solutions negotiate bundle discounts and cross-selling raises stickiness, yet buyers use broader scope to push for better pricing; the global 3PL market reached about $1.3 trillion in 2024, making scale a major bargaining lever. Global coverage and modal optionality are table stakes in negotiations, and failure to offer breadth weakens pricing power and margin resilience.
Commoditized lanes and low differentiation
On commoditized standard lanes service becomes price-led and interchangeable, as seen in 2024 when spot-market activity kept procurement focused on cost rather than capability. Buyers face minimal switching costs when basic KPIs are met by multiple providers, and spot markets amplify price transparency and downward pressure. To resist discounting, differentiation must come from measurable reliability, end-to-end visibility, and bundled value-added services.
Data, visibility, and KPI commitments
In 2024 shippers demand real-time tracking, EDI/API fidelity, and granular analytics, pushing NFI to embed high-frequency telemetry and data lakes into operations. SLA penalties and continuous improvement targets transfer cost and performance risk to the provider, while rigorous reporting creates buyer oversight and renegotiation leverage. Superior data capabilities help retain clients but also raise future expectations.
- Real-time visibility
- SLA-driven risk
- Reporting = leverage
- Data = retention + higher bar
Contracting terms and seasonality
- Volume variability: leverage point for buyers
- Peak surcharges: focal negotiation item
- Index-linked rates/mini-bids: buyer tools
- Capacity reservations/dynamic pricing: provider counters
Enterprise shippers drive price pressure; multiyear bids and SLAs reshape logistics
Enterprise shippers drive hard price pressure via scale RFPs and lane-switching; multi-year bids (commonly 2–5 years) institutionalize bargaining and performance scorecards raise switching threats. Commoditized lanes and 2024 spot-market dynamics prioritize cost over capability, while demand for real-time visibility and SLAs shifts risk onto providers. Buyers leverage volume variability and index-linked rates; providers counter with capacity reservations and dynamic pricing.
| Metric | 2024 Data |
|---|---|
| Global 3PL market | $1.3 trillion |
| Common contract length | 2–5 years |
Preview the Actual Deliverable
NFI Industries Porter's Five Forces Analysis
This preview shows the exact NFI Industries Porter's Five Forces analysis you'll receive upon purchase—no placeholders or samples. It is the complete, professionally formatted report with supplier, buyer, competitive rivalry, threat of entry, and substitute assessments. Instant download and ready for use.
Original: $10.00
-65%$10.00
$3.50Description
From Overview to Strategy Blueprint
NFI Industries faces moderate supplier power and high buyer expectations in a crowded logistics market. Rivalry and substitute threats intensify margin pressure, while barriers to entry keep new competitors limited. This brief snapshot only scratches the surface. Unlock the full Porter's Five Forces Analysis to explore NFI Industries’s competitive dynamics, market pressures, and strategic advantages in detail.
Suppliers Bargaining Power
Fuel and energy volatility
Diesel and energy suppliers exert indirect power over NFI through price swings that materially raise operating costs; 2024 saw tightened markets after OPEC+ production adjustments, amplifying volatility. Fuel surcharges mitigate some cost but often miss timing mismatches and full spikes. Long-term hedging and fuel-efficiency programs cut exposure, yet suppliers keep leverage during sudden shocks as refining capacity and geopolitics constrain supply.
Equipment OEMs and leasing capacity
Truck, trailer and chassis OEMs plus lessors dictate delivery lead times, specs and pricing; industry lead times remain elevated in 2024 at roughly 6–12 months due to capacity and supply-chain constraints. When order books fill or credit tightens, procurement leverage shifts to suppliers, raising unit costs and wait times. Standardization and multi-sourcing lower risk, yet long replacement cycles and tightening ZEV/emissions mandates (California ACT and federal pushes through 2030s) keep dependence high. Maintenance-parts shortages and aftermarket concentration further amplify supplier leverage.
Ports, railroads, and terminal operators
Ports, ocean terminals and six U.S. Class I railroads — which together operate over 140,000 route miles — act as chokepoints with few substitutes on key corridors, so access, slot allocations, dwell policies and terminal fees directly shape NFI’s service reliability and costs. Supplier leverage spikes during congestion, compressing lead times and raising demurrage/warping charges. Long-term contracts mitigate some exposure, but multi-year infrastructure scarcity keeps their bargaining power elevated.
Labor markets and unions
Labor availability shapes supplier power at NFI: U.S. warehousing employment exceeded 1 million jobs in 2024 (BLS), and tight markets plus high-profile work actions raise wage demands and disruption risk, especially in unionized pockets where negotiated raises materially increase operating cost.
- Driver availability strains capacity
- Warehouse wages up y/y, pressure on margins
- Union segments = higher pay + disruption risk
- Training and automation mitigate but do not remove exposure
- Regional labor gaps create uneven leverage
Technology vendors and real estate owners
Technology vendors (TMS/WMS) and Class A industrial landlords exert switching-cost power over NFI: multi-year TMS/WMS contracts and mission-critical integrations with carriers reduce churn, while coastal/metro Class A vacancy rates remained tight in 2024 (commonly under 6%), increasing dependency on scarce space and driving higher rent escalation.
- Multi-year TMS/WMS contracts: 3–7 years
- Lease escalators commonly 3–5% annually
- Class A vacancy near ports often <6% (2024)
- Vendor diversification and owned real estate partially mitigate leverage
Logistics suppliers hold leverage over NFI amid fuel shocks, OEM lead times and tight labor
Suppliers wield elevated leverage over NFI via fuel volatility (2024 OPEC+ tightening), OEM lead times ~6–12 months, chokepoint ports/Class I rail (140,000 route miles), and tight labor (U.S. warehousing >1M jobs). Long-term TMS/WMS contracts (3–7 yrs) and coastal Class A vacancy <6% sustain switching costs; hedging, multi-sourcing and owned real estate partially mitigate.
| Metric | 2024 |
|---|---|
| OEM lead times | 6–12 months |
| Route miles (Class I) | 140,000 |
| Warehousing jobs (US) | >1,000,000 |
| Class A vacancy | <6% |
| TMS/WMS terms | 3–7 yrs |
What is included in the product
Detailed Word Document
Uncovers key drivers of competition, customer influence, supplier power, and market entry risks tailored to NFI Industries, identifying substitutes, disruptive threats, and pricing pressures that affect profitability and market share.
Customizable Excel Spreadsheet
A concise one-sheet Porter's Five Forces for NFI Industries—instantly highlight competitive pressures, prioritize strategic responses, and export a clean radar chart for decks or scenario tabs to ease boardroom decision-making.
Customers Bargaining Power
Large shippers with scale RFPs
Enterprise shippers aggregate high volumes through scale RFPs, forcing competitive bids and rate concessions across hundreds of lanes. They can shift lanes among providers to optimize cost and service, increasing pressure on margin. Multi-year bids (commonly 2–5 years) increase visibility but institutionalize price pressure. Performance scorecards intensify accountability and switching threats via service KPIs.
Service bundling and network scope
Customers seeking end-to-end solutions negotiate bundle discounts and cross-selling raises stickiness, yet buyers use broader scope to push for better pricing; the global 3PL market reached about $1.3 trillion in 2024, making scale a major bargaining lever. Global coverage and modal optionality are table stakes in negotiations, and failure to offer breadth weakens pricing power and margin resilience.
Commoditized lanes and low differentiation
On commoditized standard lanes service becomes price-led and interchangeable, as seen in 2024 when spot-market activity kept procurement focused on cost rather than capability. Buyers face minimal switching costs when basic KPIs are met by multiple providers, and spot markets amplify price transparency and downward pressure. To resist discounting, differentiation must come from measurable reliability, end-to-end visibility, and bundled value-added services.
Data, visibility, and KPI commitments
In 2024 shippers demand real-time tracking, EDI/API fidelity, and granular analytics, pushing NFI to embed high-frequency telemetry and data lakes into operations. SLA penalties and continuous improvement targets transfer cost and performance risk to the provider, while rigorous reporting creates buyer oversight and renegotiation leverage. Superior data capabilities help retain clients but also raise future expectations.
- Real-time visibility
- SLA-driven risk
- Reporting = leverage
- Data = retention + higher bar
Contracting terms and seasonality
- Volume variability: leverage point for buyers
- Peak surcharges: focal negotiation item
- Index-linked rates/mini-bids: buyer tools
- Capacity reservations/dynamic pricing: provider counters
Enterprise shippers drive price pressure; multiyear bids and SLAs reshape logistics
Enterprise shippers drive hard price pressure via scale RFPs and lane-switching; multi-year bids (commonly 2–5 years) institutionalize bargaining and performance scorecards raise switching threats. Commoditized lanes and 2024 spot-market dynamics prioritize cost over capability, while demand for real-time visibility and SLAs shifts risk onto providers. Buyers leverage volume variability and index-linked rates; providers counter with capacity reservations and dynamic pricing.
| Metric | 2024 Data |
|---|---|
| Global 3PL market | $1.3 trillion |
| Common contract length | 2–5 years |
Preview the Actual Deliverable
NFI Industries Porter's Five Forces Analysis
This preview shows the exact NFI Industries Porter's Five Forces analysis you'll receive upon purchase—no placeholders or samples. It is the complete, professionally formatted report with supplier, buyer, competitive rivalry, threat of entry, and substitute assessments. Instant download and ready for use.











