Newmark Business Model Canvas

Business Model Canvas Playbook: Section-by-section guide for investors and advisors
Unlock Newmark’s strategic playbook with the full Business Model Canvas — a concise, section-by-section breakdown of value propositions, revenue streams, partnerships, and cost structure. Ideal for entrepreneurs, advisors, and investors seeking actionable insights, the downloadable Word and Excel files are ready for benchmarking or investor decks. Purchase the complete canvas to replicate proven tactics and spot growth opportunities fast.
Partnerships

Institutional investors and REITs
Partnerships with REITs, pension funds and private equity deliver steady deal flow and co-marketing leverage, tapping into over $1.2 trillion of institutional real estate capital in 2024 and enabling faster capital matching and credible execution.
Lenders and capital sources
Strategic ties with banks, debt funds, agencies and insurers expand financing options and tap the roughly $1.3 trillion CMBS and institutional debt market in 2024. Preferential access and pipeline visibility yield tighter pricing and higher certainty of close, often improving bids by several basis points. Co-developing financing structures with partners enhances competitiveness on complex, structured deals. Continuous dialogue informs market spreads and underwriting standards in real time.

Property owners and developers
Owner and developer alliances seed leasing, sales and project advisory mandates, with Newmark engaging partners early in 2024 to shape design, tenant mix and exit strategies. Early engagement aligns capital and planning, shortening approvals and time-to-lease. Repeat partnerships reduce transaction friction and cycle time while joint marketing amplifies asset visibility to targeted occupiers and investors.

PropTech and data providers
Collaborations with PropTech and data providers such as CoStar, Reonomy, and Yardi elevate Newmark’s research and execution quality by feeding normalized datasets and advanced analytics into advisory workflows. API integrations streamline valuation models, comp sets, and pipeline tracking, cutting manual reconciliation and enabling faster reporting. Co-innovation with vendors differentiates service delivery at scale.
- Data partners: CoStar, Reonomy, Yardi
- Benefits: faster valuations, standardized comps
- Impact: reduced time-to-insight, improved client reporting
Legal, architectural, and engineering firms
Institutional partnerships unlock $1.2T equity, $1.3T debt and cut due diligence 25%
Partnerships with REITs, pension funds and private equity supply steady deal flow, tapping >$1.2T institutional real estate capital in 2024 and improving capital match and execution.
Bank, debt fund and insurer ties access ~$1.3T CMBS/institutional debt (2024), tightening pricing and certainty of close.
PropTech, legal and AEC partners speed valuations, underwriting and development—industry due diligence times down ~25% (2024).
| Partner type | 2024 metric |
|---|---|
| Institutional capital | $1.2T |
| Debt market | $1.3T |
| Due diligence speed | -25% |
What is included in the product
 Detailed Word Document
A comprehensive, pre-written Newmark Business Model Canvas that maps customer segments, value propositions, channels, and revenue streams with real-world operational detail. Ideal for investor presentations, strategic planning, and competitive analysis.

 Customizable Excel Spreadsheet
High-level, editable canvas that condenses Newmark’s strategy into a one-page snapshot, saving hours of formatting and enabling quick team collaboration and side-by-side comparisons.
Activities

Leasing advisory and tenant rep
Prospecting, site selection, and negotiation drive occupancy outcomes, with US office vacancy around 15% in 2024 and urban submarkets showing wide dispersion. Benchmarking rents and concessions — average concessions near 2 months in 2024 — informs entry pricing and incentive strategy. Deal structuring balances flexibility and cost control through term length and CPI-linked escalations. Post-execution support ensures smooth move-in and renewal planning, reducing downtime and churn.
Capital markets brokerage
Marketing, underwriting, and executing property sales are core to Newmark capital markets brokerage, which facilitated roughly $48 billion of transaction volume in 2024; debt and equity placement matched assets with optimal capital structures and pricing. Investor targeting leveraged global distribution and in-house research covering 40+ markets to pinpoint buyers. Robust transaction management preserved timelines and 95% closing certainty on marketed assets.

Valuation and advisory
Rigor in appraisal, feasibility, and portfolio analytics underpins decisions, following IVS and USPAP standards to ensure defensibility. Scenario modeling quantifies risk and return across stress cases, commonly used for deals exceeding $10M. Independent opinions support audits, financing, and M&A, meeting institutional due-diligence requirements.

Property and facilities management
Day-to-day operations focus on optimizing NOI and tenant satisfaction through lease enforcement, facilities uptime and responsive service; predictive/preventive maintenance programs cut repair costs and downtime—industry studies show predictive maintenance can lower maintenance costs by up to 40% and extend asset life.
Vendor management and preventive maintenance reduce lifecycle costs; ESG and energy optimization (ENERGY STAR buildings use 35% less energy and emit 35% fewer GHGs per EPA) elevate asset performance, while transparent reporting strengthens owner oversight and decision speed.
- NOI optimization
- Preventive/predictive maintenance (≤40% cost reduction)
- Energy/ESG (ENERGY STAR: −35% energy & GHG)
- Transparent reporting & owner oversight
Market research and insights
Market research synthesizes comps, absorption, and pipeline data to shape leasing and disposition strategy; forecasts refine pricing and timing while thought leadership drives client acquisition and retention. Real-time dashboards surface KPIs—occupancy, leasing velocity, and NOI—enabling rapid tactical shifts and capital allocation decisions. Reports inform deal-level underwriting and portfolio rebalancing.
- Comps-driven pricing
- Absorption informs timing
- Pipeline flags supply risk
- Forecasts guide bids
- Thought leadership boosts retention
- Dashboards: real-time KPIs
Leasing + ops lift occupancy; US vacancy ~15%, capital markets $48B
Prospecting, leasing and deal execution drive occupancy (US office vacancy ~15%, concessions ~2 months) and flexibility via term/CPI escalation. Capital markets closed ~$48B in 2024 with ~95% closing certainty. Ops focus on NOI, predictive maintenance (≤40% cost cut) and ENERGY STAR savings (−35% energy/GHG).
| Metric | 2024 |
|---|---|
| US office vacancy | ~15% |
| Avg concessions | ~2 months |
| Transaction volume | $48B |
| Closing certainty | ~95% |
| Predictive maintenance | ≤40% cost cut |
| ENERGY STAR impact | −35% energy/GHG |
What You See Is What You Get
Business Model Canvas
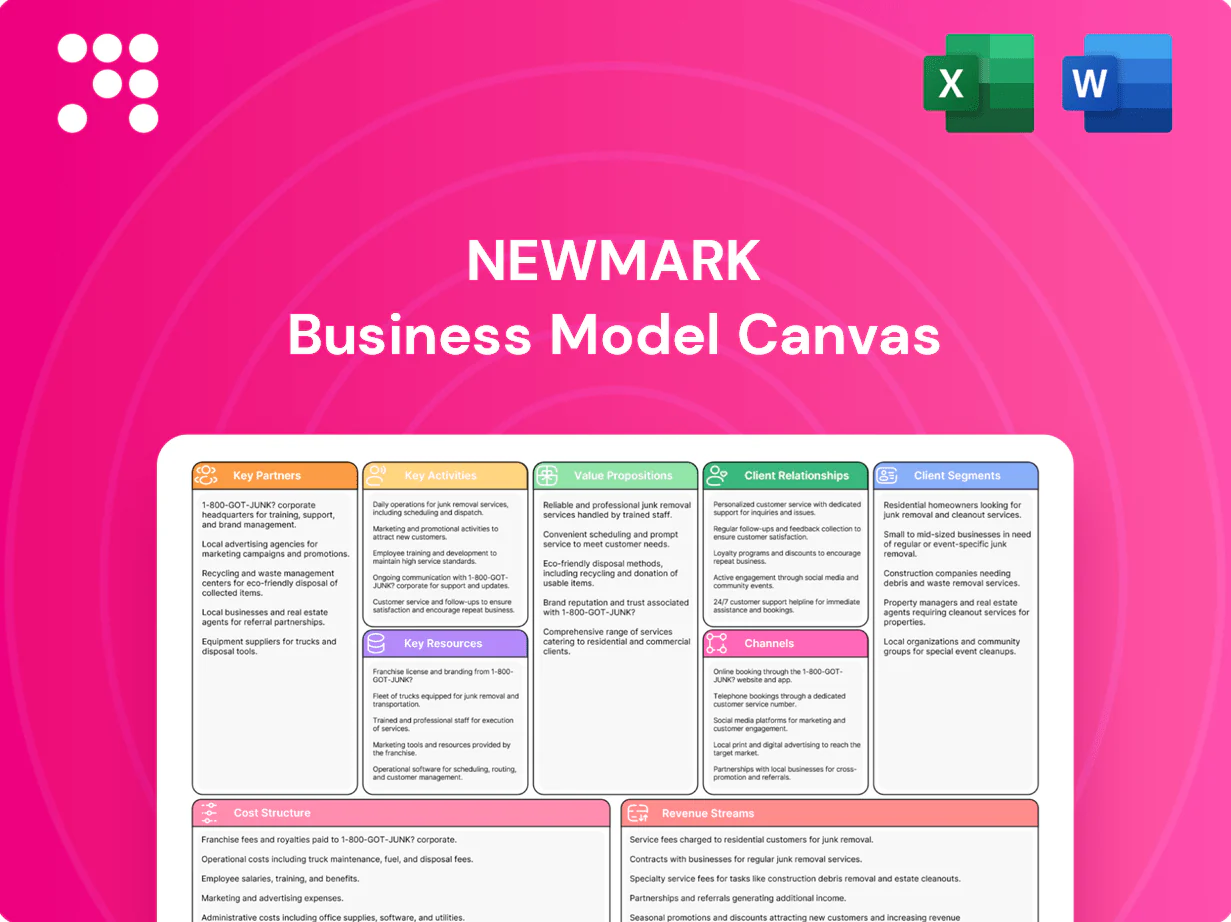
The document previewed here is the actual Newmark Business Model Canvas—not a mockup or sample—and it reflects the exact content and structure you’ll receive after purchase. When you complete your order, you’ll gain access to the full, editable file formatted for immediate use in Word and Excel. No hidden sections or placeholders—what you see is what you’ll download and deploy.

Business Model Canvas Playbook: Section-by-section guide for investors and advisors
Unlock Newmark’s strategic playbook with the full Business Model Canvas — a concise, section-by-section breakdown of value propositions, revenue streams, partnerships, and cost structure. Ideal for entrepreneurs, advisors, and investors seeking actionable insights, the downloadable Word and Excel files are ready for benchmarking or investor decks. Purchase the complete canvas to replicate proven tactics and spot growth opportunities fast.
Partnerships
Institutional investors and REITs
Partnerships with REITs, pension funds and private equity deliver steady deal flow and co-marketing leverage, tapping into over $1.2 trillion of institutional real estate capital in 2024 and enabling faster capital matching and credible execution.
Lenders and capital sources
Strategic ties with banks, debt funds, agencies and insurers expand financing options and tap the roughly $1.3 trillion CMBS and institutional debt market in 2024. Preferential access and pipeline visibility yield tighter pricing and higher certainty of close, often improving bids by several basis points. Co-developing financing structures with partners enhances competitiveness on complex, structured deals. Continuous dialogue informs market spreads and underwriting standards in real time.
Property owners and developers
Owner and developer alliances seed leasing, sales and project advisory mandates, with Newmark engaging partners early in 2024 to shape design, tenant mix and exit strategies. Early engagement aligns capital and planning, shortening approvals and time-to-lease. Repeat partnerships reduce transaction friction and cycle time while joint marketing amplifies asset visibility to targeted occupiers and investors.
PropTech and data providers
Collaborations with PropTech and data providers such as CoStar, Reonomy, and Yardi elevate Newmark’s research and execution quality by feeding normalized datasets and advanced analytics into advisory workflows. API integrations streamline valuation models, comp sets, and pipeline tracking, cutting manual reconciliation and enabling faster reporting. Co-innovation with vendors differentiates service delivery at scale.
- Data partners: CoStar, Reonomy, Yardi
- Benefits: faster valuations, standardized comps
- Impact: reduced time-to-insight, improved client reporting
Legal, architectural, and engineering firms
Institutional partnerships unlock $1.2T equity, $1.3T debt and cut due diligence 25%
Partnerships with REITs, pension funds and private equity supply steady deal flow, tapping >$1.2T institutional real estate capital in 2024 and improving capital match and execution.
Bank, debt fund and insurer ties access ~$1.3T CMBS/institutional debt (2024), tightening pricing and certainty of close.
PropTech, legal and AEC partners speed valuations, underwriting and development—industry due diligence times down ~25% (2024).
| Partner type | 2024 metric |
|---|---|
| Institutional capital | $1.2T |
| Debt market | $1.3T |
| Due diligence speed | -25% |
What is included in the product
Detailed Word Document
A comprehensive, pre-written Newmark Business Model Canvas that maps customer segments, value propositions, channels, and revenue streams with real-world operational detail. Ideal for investor presentations, strategic planning, and competitive analysis.
Customizable Excel Spreadsheet
High-level, editable canvas that condenses Newmark’s strategy into a one-page snapshot, saving hours of formatting and enabling quick team collaboration and side-by-side comparisons.
Activities
Leasing advisory and tenant rep
Prospecting, site selection, and negotiation drive occupancy outcomes, with US office vacancy around 15% in 2024 and urban submarkets showing wide dispersion. Benchmarking rents and concessions — average concessions near 2 months in 2024 — informs entry pricing and incentive strategy. Deal structuring balances flexibility and cost control through term length and CPI-linked escalations. Post-execution support ensures smooth move-in and renewal planning, reducing downtime and churn.
Capital markets brokerage
Marketing, underwriting, and executing property sales are core to Newmark capital markets brokerage, which facilitated roughly $48 billion of transaction volume in 2024; debt and equity placement matched assets with optimal capital structures and pricing. Investor targeting leveraged global distribution and in-house research covering 40+ markets to pinpoint buyers. Robust transaction management preserved timelines and 95% closing certainty on marketed assets.
Valuation and advisory
Rigor in appraisal, feasibility, and portfolio analytics underpins decisions, following IVS and USPAP standards to ensure defensibility. Scenario modeling quantifies risk and return across stress cases, commonly used for deals exceeding $10M. Independent opinions support audits, financing, and M&A, meeting institutional due-diligence requirements.
Property and facilities management
Day-to-day operations focus on optimizing NOI and tenant satisfaction through lease enforcement, facilities uptime and responsive service; predictive/preventive maintenance programs cut repair costs and downtime—industry studies show predictive maintenance can lower maintenance costs by up to 40% and extend asset life.
Vendor management and preventive maintenance reduce lifecycle costs; ESG and energy optimization (ENERGY STAR buildings use 35% less energy and emit 35% fewer GHGs per EPA) elevate asset performance, while transparent reporting strengthens owner oversight and decision speed.
- NOI optimization
- Preventive/predictive maintenance (≤40% cost reduction)
- Energy/ESG (ENERGY STAR: −35% energy & GHG)
- Transparent reporting & owner oversight
Market research and insights
Market research synthesizes comps, absorption, and pipeline data to shape leasing and disposition strategy; forecasts refine pricing and timing while thought leadership drives client acquisition and retention. Real-time dashboards surface KPIs—occupancy, leasing velocity, and NOI—enabling rapid tactical shifts and capital allocation decisions. Reports inform deal-level underwriting and portfolio rebalancing.
- Comps-driven pricing
- Absorption informs timing
- Pipeline flags supply risk
- Forecasts guide bids
- Thought leadership boosts retention
- Dashboards: real-time KPIs
Leasing + ops lift occupancy; US vacancy ~15%, capital markets $48B
Prospecting, leasing and deal execution drive occupancy (US office vacancy ~15%, concessions ~2 months) and flexibility via term/CPI escalation. Capital markets closed ~$48B in 2024 with ~95% closing certainty. Ops focus on NOI, predictive maintenance (≤40% cost cut) and ENERGY STAR savings (−35% energy/GHG).
| Metric | 2024 |
|---|---|
| US office vacancy | ~15% |
| Avg concessions | ~2 months |
| Transaction volume | $48B |
| Closing certainty | ~95% |
| Predictive maintenance | ≤40% cost cut |
| ENERGY STAR impact | −35% energy/GHG |
What You See Is What You Get
Business Model Canvas
The document previewed here is the actual Newmark Business Model Canvas—not a mockup or sample—and it reflects the exact content and structure you’ll receive after purchase. When you complete your order, you’ll gain access to the full, editable file formatted for immediate use in Word and Excel. No hidden sections or placeholders—what you see is what you’ll download and deploy.
Description
Business Model Canvas Playbook: Section-by-section guide for investors and advisors
Unlock Newmark’s strategic playbook with the full Business Model Canvas — a concise, section-by-section breakdown of value propositions, revenue streams, partnerships, and cost structure. Ideal for entrepreneurs, advisors, and investors seeking actionable insights, the downloadable Word and Excel files are ready for benchmarking or investor decks. Purchase the complete canvas to replicate proven tactics and spot growth opportunities fast.
Partnerships
Institutional investors and REITs
Partnerships with REITs, pension funds and private equity deliver steady deal flow and co-marketing leverage, tapping into over $1.2 trillion of institutional real estate capital in 2024 and enabling faster capital matching and credible execution.
Lenders and capital sources
Strategic ties with banks, debt funds, agencies and insurers expand financing options and tap the roughly $1.3 trillion CMBS and institutional debt market in 2024. Preferential access and pipeline visibility yield tighter pricing and higher certainty of close, often improving bids by several basis points. Co-developing financing structures with partners enhances competitiveness on complex, structured deals. Continuous dialogue informs market spreads and underwriting standards in real time.
Property owners and developers
Owner and developer alliances seed leasing, sales and project advisory mandates, with Newmark engaging partners early in 2024 to shape design, tenant mix and exit strategies. Early engagement aligns capital and planning, shortening approvals and time-to-lease. Repeat partnerships reduce transaction friction and cycle time while joint marketing amplifies asset visibility to targeted occupiers and investors.
PropTech and data providers
Collaborations with PropTech and data providers such as CoStar, Reonomy, and Yardi elevate Newmark’s research and execution quality by feeding normalized datasets and advanced analytics into advisory workflows. API integrations streamline valuation models, comp sets, and pipeline tracking, cutting manual reconciliation and enabling faster reporting. Co-innovation with vendors differentiates service delivery at scale.
- Data partners: CoStar, Reonomy, Yardi
- Benefits: faster valuations, standardized comps
- Impact: reduced time-to-insight, improved client reporting
Legal, architectural, and engineering firms
Institutional partnerships unlock $1.2T equity, $1.3T debt and cut due diligence 25%
Partnerships with REITs, pension funds and private equity supply steady deal flow, tapping >$1.2T institutional real estate capital in 2024 and improving capital match and execution.
Bank, debt fund and insurer ties access ~$1.3T CMBS/institutional debt (2024), tightening pricing and certainty of close.
PropTech, legal and AEC partners speed valuations, underwriting and development—industry due diligence times down ~25% (2024).
| Partner type | 2024 metric |
|---|---|
| Institutional capital | $1.2T |
| Debt market | $1.3T |
| Due diligence speed | -25% |
What is included in the product
Detailed Word Document
A comprehensive, pre-written Newmark Business Model Canvas that maps customer segments, value propositions, channels, and revenue streams with real-world operational detail. Ideal for investor presentations, strategic planning, and competitive analysis.
Customizable Excel Spreadsheet
High-level, editable canvas that condenses Newmark’s strategy into a one-page snapshot, saving hours of formatting and enabling quick team collaboration and side-by-side comparisons.
Activities
Leasing advisory and tenant rep
Prospecting, site selection, and negotiation drive occupancy outcomes, with US office vacancy around 15% in 2024 and urban submarkets showing wide dispersion. Benchmarking rents and concessions — average concessions near 2 months in 2024 — informs entry pricing and incentive strategy. Deal structuring balances flexibility and cost control through term length and CPI-linked escalations. Post-execution support ensures smooth move-in and renewal planning, reducing downtime and churn.
Capital markets brokerage
Marketing, underwriting, and executing property sales are core to Newmark capital markets brokerage, which facilitated roughly $48 billion of transaction volume in 2024; debt and equity placement matched assets with optimal capital structures and pricing. Investor targeting leveraged global distribution and in-house research covering 40+ markets to pinpoint buyers. Robust transaction management preserved timelines and 95% closing certainty on marketed assets.
Valuation and advisory
Rigor in appraisal, feasibility, and portfolio analytics underpins decisions, following IVS and USPAP standards to ensure defensibility. Scenario modeling quantifies risk and return across stress cases, commonly used for deals exceeding $10M. Independent opinions support audits, financing, and M&A, meeting institutional due-diligence requirements.
Property and facilities management
Day-to-day operations focus on optimizing NOI and tenant satisfaction through lease enforcement, facilities uptime and responsive service; predictive/preventive maintenance programs cut repair costs and downtime—industry studies show predictive maintenance can lower maintenance costs by up to 40% and extend asset life.
Vendor management and preventive maintenance reduce lifecycle costs; ESG and energy optimization (ENERGY STAR buildings use 35% less energy and emit 35% fewer GHGs per EPA) elevate asset performance, while transparent reporting strengthens owner oversight and decision speed.
- NOI optimization
- Preventive/predictive maintenance (≤40% cost reduction)
- Energy/ESG (ENERGY STAR: −35% energy & GHG)
- Transparent reporting & owner oversight
Market research and insights
Market research synthesizes comps, absorption, and pipeline data to shape leasing and disposition strategy; forecasts refine pricing and timing while thought leadership drives client acquisition and retention. Real-time dashboards surface KPIs—occupancy, leasing velocity, and NOI—enabling rapid tactical shifts and capital allocation decisions. Reports inform deal-level underwriting and portfolio rebalancing.
- Comps-driven pricing
- Absorption informs timing
- Pipeline flags supply risk
- Forecasts guide bids
- Thought leadership boosts retention
- Dashboards: real-time KPIs
Leasing + ops lift occupancy; US vacancy ~15%, capital markets $48B
Prospecting, leasing and deal execution drive occupancy (US office vacancy ~15%, concessions ~2 months) and flexibility via term/CPI escalation. Capital markets closed ~$48B in 2024 with ~95% closing certainty. Ops focus on NOI, predictive maintenance (≤40% cost cut) and ENERGY STAR savings (−35% energy/GHG).
| Metric | 2024 |
|---|---|
| US office vacancy | ~15% |
| Avg concessions | ~2 months |
| Transaction volume | $48B |
| Closing certainty | ~95% |
| Predictive maintenance | ≤40% cost cut |
| ENERGY STAR impact | −35% energy/GHG |
What You See Is What You Get
Business Model Canvas
The document previewed here is the actual Newmark Business Model Canvas—not a mockup or sample—and it reflects the exact content and structure you’ll receive after purchase. When you complete your order, you’ll gain access to the full, editable file formatted for immediate use in Word and Excel. No hidden sections or placeholders—what you see is what you’ll download and deploy.











