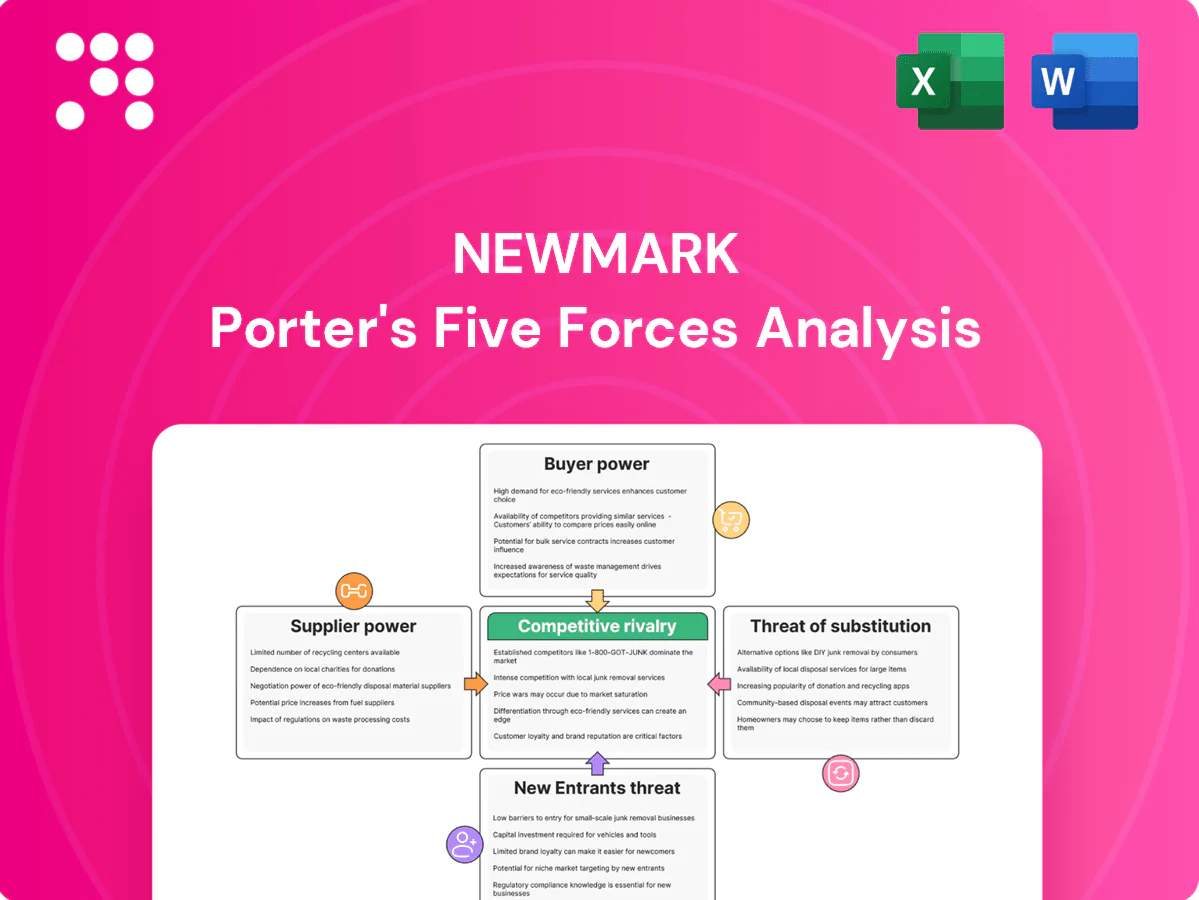
Newmark Porter's Five Forces Analysis

Don't Miss the Bigger Picture
Newmark’s Porter's Five Forces snapshot highlights competitive intensity, buyer and supplier pressures, and substitution risks shaping its market position. This brief overview identifies key strategic vulnerabilities and growth levers but only scratches the surface. Unlock the full Porter's Five Forces Analysis for force-by-force ratings, visuals, and actionable insights to inform investment and strategy decisions.
Suppliers Bargaining Power

Star broker and analyst talent
Specialized human capital is the primary input: roughly the top 20% of brokers and analysts generate about 80% of revenues, giving star talent outsized leverage. Top producers command premium splits and guarantees, often up to 90% on deals. Talent mobility raises switching risk and wage pressure as non-compete enforcement weakens across many markets. Retention increasingly hinges on culture, tech enablement, and equity incentives.
Data and market intelligence vendors
Reliance on platforms like CoStar, MSCI and mapping/foot-traffic vendors concentrates supplier power; CoStar reported $2.523 billion revenue in FY2024, illustrating scale and leverage.
Pricing is opaque and often escalates with usage tiers, while limited substitutes for high‑quality, standardized CRE data increase dependency.
Long‑term, multi‑year contracts commonly lock in costs and reduce negotiation flexibility.

Technology infrastructure platforms
CRM, research, marketing and analytics stacks from major SaaS vendors are mission-critical, with Salesforce holding roughly 19.5% of the global CRM market in 2024 and CRM software representing one of the largest SaaS categories (~$53B market in 2024). High switching costs and integration complexity—often 6–12 months and millions in implementation for enterprise deals—give suppliers leverage on pricing and contract terms. Ongoing vendor consolidation in cloud and marketing automation compresses alternatives, while stringent security and compliance mandates (SOC2, GDPR, CCPA) further entrench specific providers.

Property owners as inventory gatekeepers
Owners and developers control listings and exclusivity, steering Newmark’s advisory pipeline; prestigious mandates in 2024 often negotiated fee splits or marketing spend concessions, sometimes yielding 20–30% fee discounts on flagship assignments. Owners still depend on broker distribution and execution—Newmark reported ~1.9B revenue in 2024—so deep relationships and track record rebalance supplier leverage.
- Control of listings drives negotiation leverage
- Prestige mandates extract favorable fees/marketing
- Broker reach/execution (Newmark ~1.9B 2024) tempers owner power
- Relationship depth and track record rebalance terms
Regulatory, licensing, and compliance services
Local brokerage licenses, valuation standards, and global compliance support are critical inputs; jurisdictional fragmentation in 2024 (EU, UK, select US states expanding ESG rules) increases reliance on specialist legal/compliance providers and raises delivery costs. Changes in standards have driven fee premia up to ~20% in some markets, and limited specialist supply elevates supplier pricing power.
- Local licenses: required inputs, varied by jurisdiction
- ESG & valuation standards: 2024 expansions increase compliance load
- Specialist supply tight: fee premia up to ~20%
- Pricing power: concentrated in certain markets
Concentrated Brokers and CRM Dominance Fuel High Supplier Power and Elevated Switching Costs
Suppliers wield moderate-to-high power: top 20% of brokers drive ~80% revenues, CoStar revenue $2.523B (FY2024), Newmark revenue ~$1.9B (2024). CRM/SaaS concentration (Salesforce ~19.5% share; CRM market ~$53B in 2024), opaque pricing, long contracts and limited specialist compliance providers raise switching costs and pricing leverage.
| Metric | 2024 Value |
|---|---|
| CoStar revenue | $2.523B |
| Newmark revenue | $1.9B |
| CRM market | $53B |
| Salesforce share | 19.5% |
| Top brokers' revenue skew | 20% -> 80% |
What is included in the product
 Detailed Word Document
Tailored Five Forces analysis for Newmark that uncovers competitive drivers, buyer and supplier power, entry barriers, substitutes, and disruptive threats, with strategic commentary to inform pricing, positioning, and defensive opportunities.

 Customizable Excel Spreadsheet
A one-sheet Newmark Porter Five Forces summary with adjustable pressure sliders and an instant radar chart—clean, no-macro layout ready for decks or dashboards; customizable labels, duplicable tabs for scenarios, and seamless Excel integration to remove analysis bottlenecks.
Customers Bargaining Power

Institutional clients consolidate spend
Institutional clients—REITs, private equity and corporates—run competitive regional and service RFPs that aggregate spend into multi-year, multi-service mandates, forcing volume discounts and contractual performance SLAs. Sophisticated procurement teams compress fees and tighten KPIs, benchmarking providers against standardized metrics. Feasible switching among top firms increases buyer leverage and reduces pricing power for incumbents.
High price transparency in fees
Market norms for brokerage and advisory fees are well known: median retail advisory fees ran about 0.85–1.00% of AUM in 2024, while mid‑market M&A success fees typically range 1–4%. Benchmarking enables clients to push for reductions or success‑based structures, with negotiated discounts of 10–30% common when advisors risk-share. Outcome‑linked fees shift downside to the advisor, and bundling services often trades margin for greater share‑of‑wallet.

Multi-homing and panel usage
Clients maintain panels of brokers and advisors by asset class and region, lowering dependence on any single provider and boosting negotiation leverage; global institutional AUM exceeded $120 trillion in 2024, concentrating buying power. Multi-homing means firms face direct performance comparisons that intensify pressure on fees and talent. Exclusivity is earned through demonstrable outperformance and can be revoked if benchmarks slip.

Tenant rep and occupier services savvy
Cyclical volumes shift leverage
In downcycles with fewer transactions advisors compete harder for mandates; global M&A volumes fell roughly 40% from the 2021 peak to 2023, giving buyers leverage to extract fee and term concessions. Buyers exploit slack capacity to renegotiate retainer structures and success fees; counter-cyclical services (valuation, restructuring) grew but typically offset only part of lost deal fees. Volume recovery in 2024 began restoring balance but margins often remain compressed.
- 25%+ advisor fee decline reported in soft cycles
- 40% drop in M&A volume 2021–2023
- Valuation/restructuring up modestly, <10% revenue offset
- 2024 volume recovery improving leverage but not fully restoring margins
RFPs, M&A slump force fee cuts; median retail advisory fee 0.85–1.00% AUM
Institutional buyers (AUM $120T in 2024) run competitive RFPs, forcing discounts and SLAs; switching among top firms increases leverage. Median retail advisory fees were about 0.85–1.00% AUM in 2024; outcome‑linked fees and 10–30% negotiated discounts are common. M&A volumes fell ~40% 2021–23, enabling >25% advisor fee declines in soft cycles; 2024 recovery only partly restored margins.
| Metric | 2024 / Change |
|---|---|
| Institutional AUM | $120 trillion |
| Median advisory fee | 0.85–1.00% AUM |
| M&A volume (2021–23) | −40% |
| Advisor fee decline (soft cycles) | −25%+ |
Preview Before You Purchase
Newmark Porter's Five Forces Analysis
This preview shows the exact Newmark Porter's Five Forces Analysis you'll receive—no surprises, no placeholders. The document displayed is the fully formatted, professionally written file, ready for immediate download and use the moment you buy. You're looking at the actual deliverable, complete and unaltered, available instantly after purchase.

Don't Miss the Bigger Picture
Newmark’s Porter's Five Forces snapshot highlights competitive intensity, buyer and supplier pressures, and substitution risks shaping its market position. This brief overview identifies key strategic vulnerabilities and growth levers but only scratches the surface. Unlock the full Porter's Five Forces Analysis for force-by-force ratings, visuals, and actionable insights to inform investment and strategy decisions.
Suppliers Bargaining Power
Star broker and analyst talent
Specialized human capital is the primary input: roughly the top 20% of brokers and analysts generate about 80% of revenues, giving star talent outsized leverage. Top producers command premium splits and guarantees, often up to 90% on deals. Talent mobility raises switching risk and wage pressure as non-compete enforcement weakens across many markets. Retention increasingly hinges on culture, tech enablement, and equity incentives.
Data and market intelligence vendors
Reliance on platforms like CoStar, MSCI and mapping/foot-traffic vendors concentrates supplier power; CoStar reported $2.523 billion revenue in FY2024, illustrating scale and leverage.
Pricing is opaque and often escalates with usage tiers, while limited substitutes for high‑quality, standardized CRE data increase dependency.
Long‑term, multi‑year contracts commonly lock in costs and reduce negotiation flexibility.
Technology infrastructure platforms
CRM, research, marketing and analytics stacks from major SaaS vendors are mission-critical, with Salesforce holding roughly 19.5% of the global CRM market in 2024 and CRM software representing one of the largest SaaS categories (~$53B market in 2024). High switching costs and integration complexity—often 6–12 months and millions in implementation for enterprise deals—give suppliers leverage on pricing and contract terms. Ongoing vendor consolidation in cloud and marketing automation compresses alternatives, while stringent security and compliance mandates (SOC2, GDPR, CCPA) further entrench specific providers.
Property owners as inventory gatekeepers
Owners and developers control listings and exclusivity, steering Newmark’s advisory pipeline; prestigious mandates in 2024 often negotiated fee splits or marketing spend concessions, sometimes yielding 20–30% fee discounts on flagship assignments. Owners still depend on broker distribution and execution—Newmark reported ~1.9B revenue in 2024—so deep relationships and track record rebalance supplier leverage.
- Control of listings drives negotiation leverage
- Prestige mandates extract favorable fees/marketing
- Broker reach/execution (Newmark ~1.9B 2024) tempers owner power
- Relationship depth and track record rebalance terms
Regulatory, licensing, and compliance services
Local brokerage licenses, valuation standards, and global compliance support are critical inputs; jurisdictional fragmentation in 2024 (EU, UK, select US states expanding ESG rules) increases reliance on specialist legal/compliance providers and raises delivery costs. Changes in standards have driven fee premia up to ~20% in some markets, and limited specialist supply elevates supplier pricing power.
- Local licenses: required inputs, varied by jurisdiction
- ESG & valuation standards: 2024 expansions increase compliance load
- Specialist supply tight: fee premia up to ~20%
- Pricing power: concentrated in certain markets
Concentrated Brokers and CRM Dominance Fuel High Supplier Power and Elevated Switching Costs
Suppliers wield moderate-to-high power: top 20% of brokers drive ~80% revenues, CoStar revenue $2.523B (FY2024), Newmark revenue ~$1.9B (2024). CRM/SaaS concentration (Salesforce ~19.5% share; CRM market ~$53B in 2024), opaque pricing, long contracts and limited specialist compliance providers raise switching costs and pricing leverage.
| Metric | 2024 Value |
|---|---|
| CoStar revenue | $2.523B |
| Newmark revenue | $1.9B |
| CRM market | $53B |
| Salesforce share | 19.5% |
| Top brokers' revenue skew | 20% -> 80% |
What is included in the product
Detailed Word Document
Tailored Five Forces analysis for Newmark that uncovers competitive drivers, buyer and supplier power, entry barriers, substitutes, and disruptive threats, with strategic commentary to inform pricing, positioning, and defensive opportunities.
Customizable Excel Spreadsheet
A one-sheet Newmark Porter Five Forces summary with adjustable pressure sliders and an instant radar chart—clean, no-macro layout ready for decks or dashboards; customizable labels, duplicable tabs for scenarios, and seamless Excel integration to remove analysis bottlenecks.
Customers Bargaining Power
Institutional clients consolidate spend
Institutional clients—REITs, private equity and corporates—run competitive regional and service RFPs that aggregate spend into multi-year, multi-service mandates, forcing volume discounts and contractual performance SLAs. Sophisticated procurement teams compress fees and tighten KPIs, benchmarking providers against standardized metrics. Feasible switching among top firms increases buyer leverage and reduces pricing power for incumbents.
High price transparency in fees
Market norms for brokerage and advisory fees are well known: median retail advisory fees ran about 0.85–1.00% of AUM in 2024, while mid‑market M&A success fees typically range 1–4%. Benchmarking enables clients to push for reductions or success‑based structures, with negotiated discounts of 10–30% common when advisors risk-share. Outcome‑linked fees shift downside to the advisor, and bundling services often trades margin for greater share‑of‑wallet.
Multi-homing and panel usage
Clients maintain panels of brokers and advisors by asset class and region, lowering dependence on any single provider and boosting negotiation leverage; global institutional AUM exceeded $120 trillion in 2024, concentrating buying power. Multi-homing means firms face direct performance comparisons that intensify pressure on fees and talent. Exclusivity is earned through demonstrable outperformance and can be revoked if benchmarks slip.
Tenant rep and occupier services savvy
Cyclical volumes shift leverage
In downcycles with fewer transactions advisors compete harder for mandates; global M&A volumes fell roughly 40% from the 2021 peak to 2023, giving buyers leverage to extract fee and term concessions. Buyers exploit slack capacity to renegotiate retainer structures and success fees; counter-cyclical services (valuation, restructuring) grew but typically offset only part of lost deal fees. Volume recovery in 2024 began restoring balance but margins often remain compressed.
- 25%+ advisor fee decline reported in soft cycles
- 40% drop in M&A volume 2021–2023
- Valuation/restructuring up modestly, <10% revenue offset
- 2024 volume recovery improving leverage but not fully restoring margins
RFPs, M&A slump force fee cuts; median retail advisory fee 0.85–1.00% AUM
Institutional buyers (AUM $120T in 2024) run competitive RFPs, forcing discounts and SLAs; switching among top firms increases leverage. Median retail advisory fees were about 0.85–1.00% AUM in 2024; outcome‑linked fees and 10–30% negotiated discounts are common. M&A volumes fell ~40% 2021–23, enabling >25% advisor fee declines in soft cycles; 2024 recovery only partly restored margins.
| Metric | 2024 / Change |
|---|---|
| Institutional AUM | $120 trillion |
| Median advisory fee | 0.85–1.00% AUM |
| M&A volume (2021–23) | −40% |
| Advisor fee decline (soft cycles) | −25%+ |
Preview Before You Purchase
Newmark Porter's Five Forces Analysis
This preview shows the exact Newmark Porter's Five Forces Analysis you'll receive—no surprises, no placeholders. The document displayed is the fully formatted, professionally written file, ready for immediate download and use the moment you buy. You're looking at the actual deliverable, complete and unaltered, available instantly after purchase.
Description
Don't Miss the Bigger Picture
Newmark’s Porter's Five Forces snapshot highlights competitive intensity, buyer and supplier pressures, and substitution risks shaping its market position. This brief overview identifies key strategic vulnerabilities and growth levers but only scratches the surface. Unlock the full Porter's Five Forces Analysis for force-by-force ratings, visuals, and actionable insights to inform investment and strategy decisions.
Suppliers Bargaining Power
Star broker and analyst talent
Specialized human capital is the primary input: roughly the top 20% of brokers and analysts generate about 80% of revenues, giving star talent outsized leverage. Top producers command premium splits and guarantees, often up to 90% on deals. Talent mobility raises switching risk and wage pressure as non-compete enforcement weakens across many markets. Retention increasingly hinges on culture, tech enablement, and equity incentives.
Data and market intelligence vendors
Reliance on platforms like CoStar, MSCI and mapping/foot-traffic vendors concentrates supplier power; CoStar reported $2.523 billion revenue in FY2024, illustrating scale and leverage.
Pricing is opaque and often escalates with usage tiers, while limited substitutes for high‑quality, standardized CRE data increase dependency.
Long‑term, multi‑year contracts commonly lock in costs and reduce negotiation flexibility.
Technology infrastructure platforms
CRM, research, marketing and analytics stacks from major SaaS vendors are mission-critical, with Salesforce holding roughly 19.5% of the global CRM market in 2024 and CRM software representing one of the largest SaaS categories (~$53B market in 2024). High switching costs and integration complexity—often 6–12 months and millions in implementation for enterprise deals—give suppliers leverage on pricing and contract terms. Ongoing vendor consolidation in cloud and marketing automation compresses alternatives, while stringent security and compliance mandates (SOC2, GDPR, CCPA) further entrench specific providers.
Property owners as inventory gatekeepers
Owners and developers control listings and exclusivity, steering Newmark’s advisory pipeline; prestigious mandates in 2024 often negotiated fee splits or marketing spend concessions, sometimes yielding 20–30% fee discounts on flagship assignments. Owners still depend on broker distribution and execution—Newmark reported ~1.9B revenue in 2024—so deep relationships and track record rebalance supplier leverage.
- Control of listings drives negotiation leverage
- Prestige mandates extract favorable fees/marketing
- Broker reach/execution (Newmark ~1.9B 2024) tempers owner power
- Relationship depth and track record rebalance terms
Regulatory, licensing, and compliance services
Local brokerage licenses, valuation standards, and global compliance support are critical inputs; jurisdictional fragmentation in 2024 (EU, UK, select US states expanding ESG rules) increases reliance on specialist legal/compliance providers and raises delivery costs. Changes in standards have driven fee premia up to ~20% in some markets, and limited specialist supply elevates supplier pricing power.
- Local licenses: required inputs, varied by jurisdiction
- ESG & valuation standards: 2024 expansions increase compliance load
- Specialist supply tight: fee premia up to ~20%
- Pricing power: concentrated in certain markets
Concentrated Brokers and CRM Dominance Fuel High Supplier Power and Elevated Switching Costs
Suppliers wield moderate-to-high power: top 20% of brokers drive ~80% revenues, CoStar revenue $2.523B (FY2024), Newmark revenue ~$1.9B (2024). CRM/SaaS concentration (Salesforce ~19.5% share; CRM market ~$53B in 2024), opaque pricing, long contracts and limited specialist compliance providers raise switching costs and pricing leverage.
| Metric | 2024 Value |
|---|---|
| CoStar revenue | $2.523B |
| Newmark revenue | $1.9B |
| CRM market | $53B |
| Salesforce share | 19.5% |
| Top brokers' revenue skew | 20% -> 80% |
What is included in the product
Detailed Word Document
Tailored Five Forces analysis for Newmark that uncovers competitive drivers, buyer and supplier power, entry barriers, substitutes, and disruptive threats, with strategic commentary to inform pricing, positioning, and defensive opportunities.
Customizable Excel Spreadsheet
A one-sheet Newmark Porter Five Forces summary with adjustable pressure sliders and an instant radar chart—clean, no-macro layout ready for decks or dashboards; customizable labels, duplicable tabs for scenarios, and seamless Excel integration to remove analysis bottlenecks.
Customers Bargaining Power
Institutional clients consolidate spend
Institutional clients—REITs, private equity and corporates—run competitive regional and service RFPs that aggregate spend into multi-year, multi-service mandates, forcing volume discounts and contractual performance SLAs. Sophisticated procurement teams compress fees and tighten KPIs, benchmarking providers against standardized metrics. Feasible switching among top firms increases buyer leverage and reduces pricing power for incumbents.
High price transparency in fees
Market norms for brokerage and advisory fees are well known: median retail advisory fees ran about 0.85–1.00% of AUM in 2024, while mid‑market M&A success fees typically range 1–4%. Benchmarking enables clients to push for reductions or success‑based structures, with negotiated discounts of 10–30% common when advisors risk-share. Outcome‑linked fees shift downside to the advisor, and bundling services often trades margin for greater share‑of‑wallet.
Multi-homing and panel usage
Clients maintain panels of brokers and advisors by asset class and region, lowering dependence on any single provider and boosting negotiation leverage; global institutional AUM exceeded $120 trillion in 2024, concentrating buying power. Multi-homing means firms face direct performance comparisons that intensify pressure on fees and talent. Exclusivity is earned through demonstrable outperformance and can be revoked if benchmarks slip.
Tenant rep and occupier services savvy
Cyclical volumes shift leverage
In downcycles with fewer transactions advisors compete harder for mandates; global M&A volumes fell roughly 40% from the 2021 peak to 2023, giving buyers leverage to extract fee and term concessions. Buyers exploit slack capacity to renegotiate retainer structures and success fees; counter-cyclical services (valuation, restructuring) grew but typically offset only part of lost deal fees. Volume recovery in 2024 began restoring balance but margins often remain compressed.
- 25%+ advisor fee decline reported in soft cycles
- 40% drop in M&A volume 2021–2023
- Valuation/restructuring up modestly, <10% revenue offset
- 2024 volume recovery improving leverage but not fully restoring margins
RFPs, M&A slump force fee cuts; median retail advisory fee 0.85–1.00% AUM
Institutional buyers (AUM $120T in 2024) run competitive RFPs, forcing discounts and SLAs; switching among top firms increases leverage. Median retail advisory fees were about 0.85–1.00% AUM in 2024; outcome‑linked fees and 10–30% negotiated discounts are common. M&A volumes fell ~40% 2021–23, enabling >25% advisor fee declines in soft cycles; 2024 recovery only partly restored margins.
| Metric | 2024 / Change |
|---|---|
| Institutional AUM | $120 trillion |
| Median advisory fee | 0.85–1.00% AUM |
| M&A volume (2021–23) | −40% |
| Advisor fee decline (soft cycles) | −25%+ |
Preview Before You Purchase
Newmark Porter's Five Forces Analysis
This preview shows the exact Newmark Porter's Five Forces Analysis you'll receive—no surprises, no placeholders. The document displayed is the fully formatted, professionally written file, ready for immediate download and use the moment you buy. You're looking at the actual deliverable, complete and unaltered, available instantly after purchase.











