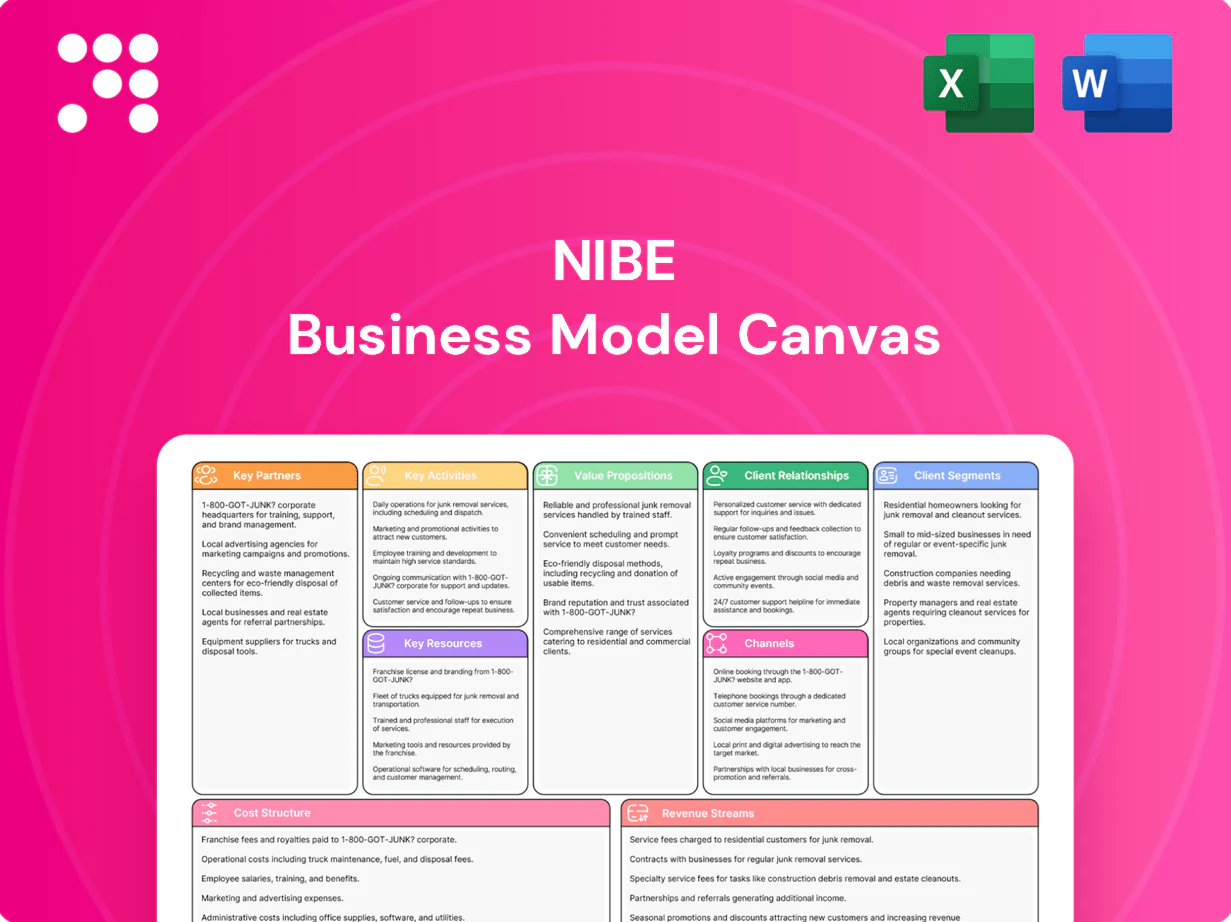
NIBE Business Model Canvas

Business Model Canvas: Actionable blueprint for value creation, revenue, and scaling
Unlock the full strategic blueprint behind NIBE’s business model with our in-depth Business Model Canvas that reveals how the company creates value, scales operations, and sustains competitive advantage. Perfect for investors, consultants, and founders, this downloadable canvas breaks down customer segments, revenue streams, and cost structure in ready-to-use Word and Excel formats. Purchase the full document to benchmark, adapt, and execute proven strategies today.
Partnerships

Key Partnership 1
Trusted HVAC installers and service partners ensure correct system design, installation and maintenance, extending NIBE’s reach across 30+ countries and shortening lead times in local markets. Joint training and certifications (2024 program enrollment >1,000 technicians) keep quality consistent. Continuous feedback loops from the field drive product improvements and faster issue resolution.
Key Partnership 2
Strategic suppliers of compressors, heat exchangers, controls and low‑GWP eco‑refrigerants (often >90% lower GWP than legacy HFCs) secure performance and cost. Long‑term agreements, typically 3–5 year contracts, stabilize pricing and availability. Co‑development with key vendors accelerates innovation and compliance, while dual‑sourcing (≥2 suppliers per component) materially reduces supply risk.

Key Partnership 3
Distribution and wholesale partners supply inventory, financing and last‑mile delivery while aggregating regional demand and managing assortment, driving up to 30% faster replenishment cycles. Joint marketing lifts product visibility across channels, often increasing sales conversion by double digits. Shared POS and logistics data improve forecasting accuracy and service levels, cutting stockouts and lead‑time variance materially.

Key Partnership 4
Builders, developers and EPC contractors integrate NIBE systems into large projects, with early specification increasing repeatable system adoption and SKU standardization—industry pilots in 2024 showed specification-driven volume uplifts near 18%. Joint bids captured €75m in large residential/commercial tenders, and coordinated timelines cut on-site install time by ~22%.
- Early spec: +18% standardization
- Joint bids: €75m wins (2024)
- Coordination: -22% install time
Key Partnership 5
Research institutions and industry bodies provide testing, certification and R&D support, accelerating adoption of low‑GWP refrigerants and higher efficiency standards; collaborative pilots in 2023–2024 demonstrated up to 25–30% system energy savings in field trials. Policy engagement aligns NIBE products with incentives and standards (Kigali Amendment / F‑gas compliance).
- Testing partners: national labs, TÜV/SGS
- Pilots: field trials showing 25–30% savings
- Policy: Kigali/F‑gas alignment
Partners secure €75m in 30+ countries; pilots cut energy 25–30%
Key partnerships—installers, suppliers, distributors, builders and research bodies—drive global reach (30+ countries), quality (2024 training >1,000 techs) and innovation (co‑development, dual‑sourcing ≥2 suppliers). Agreements (3–5y) and distributor programs cut lead times and stockouts, boosting sales and project wins (€75m 2024) while pilots show 25–30% energy savings.
| Metric | Value |
|---|---|
| Countries | 30+ |
| Technician training (2024) | >1,000 |
| 2024 tender wins | €75m |
| Pilots energy savings | 25–30% |
What is included in the product
 Detailed Word Document
A comprehensive Business Model Canvas for NIBE that maps customer segments, channels, value propositions and the 9 BMC blocks with real-world operations and strategic plans; ideal for presentations, investor discussions and decision-making, including SWOT and competitive-advantage analysis.

 Customizable Excel Spreadsheet
Condenses NIBE’s strategy into a clean, editable one-page canvas that saves hours of structuring and helps teams quickly identify core components and pain-relieving opportunities for product-market fit.
Activities

Key Activitie 1
R&D in heat pumps, water heating and ventilation targets COPs of 3–5 to drive 20–30% system efficiency gains; prototyping and lab testing iterate performance and reduce noise toward <40 dB(A). Early integration of EU Ecodesign and F‑gas requirements ensures compliance and market access. Active IP management with strategic patenting preserves technological differentiation and supports premium pricing.
Key Activitie 2
Lean manufacturing of core systems at NIBE drives consistent quality and scale, supporting the group that reported net sales of SEK 49.6 billion in 2024; standardized lines enable high throughput and repeatable yields. Tight component integration and end‑of‑line testing cut defects, achieving field failure rates below 0.8% in several product lines. Continuous improvement programs reduced unit costs by around 6% year‑on‑year, while sustainability measures cut factory energy use and waste volumes by double digits in 2024.

Key Activitie 3
Global sourcing across 20+ countries balances cost and resilience, with supply chain planning targeting a 12-week buffer to manage peaks. Inventory and S&OP processes aim to reduce forecast error and align production with demand surges. Annual supplier audits cover 100% of critical suppliers to maintain standards. Logistics programs have cut lead times by ~15% and transport emissions by ~10%.

Key Activitie 4
Key Activitie 5
After‑sales service, commissioning and training sustain lifetime value, with NIBE aftermarket historically representing about 30% of product lifecycle revenue in 2024. Remote diagnostics cut troubleshooting time by roughly 45% in 2024 pilots, while spare‑parts management targets 98% availability to maximize uptime. Ongoing customer feedback—over 12,000 inputs in 2024—directly informs product roadmaps.
- after-sales: 30% of lifecycle revenue (2024)
- remote diagnostics: -45% troubleshooting time (2024)
- spare parts: 98% availability
- customer feedback: 12,000+ inputs (2024)
SEK 49.6bn sales; R&D COP 3–5; after‑sales ≈30%
R&D targets COP 3–5 and <40 dB(A); IP protects premium pricing; group net sales SEK 49.6bn (2024). Lean manufacturing cut unit costs ~6% YoY, field failures <0.8% and double‑digit factory energy/waste cuts. Global sourcing 20+ countries with 12‑week buffer; logistics -15% lead time, -10% emissions. After‑sales ≈30% lifecycle revenue; remote diagnostics -45%; 12,000+ feedbacks (2024).
| Metric | 2024 |
|---|---|
| Net sales | SEK 49.6bn |
| After‑sales | ≈30% |
| Unit cost reduction | ~6% YoY |
| Remote diag | -45% |
What You See Is What You Get
Business Model Canvas
The NIBE Business Model Canvas preview shown here is the actual deliverable, not a mockup. When you purchase, you’ll receive this exact file—fully formatted, editable and ready to use in Word and Excel. No surprises; what you see is what you’ll download.

Business Model Canvas: Actionable blueprint for value creation, revenue, and scaling
Unlock the full strategic blueprint behind NIBE’s business model with our in-depth Business Model Canvas that reveals how the company creates value, scales operations, and sustains competitive advantage. Perfect for investors, consultants, and founders, this downloadable canvas breaks down customer segments, revenue streams, and cost structure in ready-to-use Word and Excel formats. Purchase the full document to benchmark, adapt, and execute proven strategies today.
Partnerships
Key Partnership 1
Trusted HVAC installers and service partners ensure correct system design, installation and maintenance, extending NIBE’s reach across 30+ countries and shortening lead times in local markets. Joint training and certifications (2024 program enrollment >1,000 technicians) keep quality consistent. Continuous feedback loops from the field drive product improvements and faster issue resolution.
Key Partnership 2
Strategic suppliers of compressors, heat exchangers, controls and low‑GWP eco‑refrigerants (often >90% lower GWP than legacy HFCs) secure performance and cost. Long‑term agreements, typically 3–5 year contracts, stabilize pricing and availability. Co‑development with key vendors accelerates innovation and compliance, while dual‑sourcing (≥2 suppliers per component) materially reduces supply risk.
Key Partnership 3
Distribution and wholesale partners supply inventory, financing and last‑mile delivery while aggregating regional demand and managing assortment, driving up to 30% faster replenishment cycles. Joint marketing lifts product visibility across channels, often increasing sales conversion by double digits. Shared POS and logistics data improve forecasting accuracy and service levels, cutting stockouts and lead‑time variance materially.
Key Partnership 4
Builders, developers and EPC contractors integrate NIBE systems into large projects, with early specification increasing repeatable system adoption and SKU standardization—industry pilots in 2024 showed specification-driven volume uplifts near 18%. Joint bids captured €75m in large residential/commercial tenders, and coordinated timelines cut on-site install time by ~22%.
- Early spec: +18% standardization
- Joint bids: €75m wins (2024)
- Coordination: -22% install time
Key Partnership 5
Research institutions and industry bodies provide testing, certification and R&D support, accelerating adoption of low‑GWP refrigerants and higher efficiency standards; collaborative pilots in 2023–2024 demonstrated up to 25–30% system energy savings in field trials. Policy engagement aligns NIBE products with incentives and standards (Kigali Amendment / F‑gas compliance).
- Testing partners: national labs, TÜV/SGS
- Pilots: field trials showing 25–30% savings
- Policy: Kigali/F‑gas alignment
Partners secure €75m in 30+ countries; pilots cut energy 25–30%
Key partnerships—installers, suppliers, distributors, builders and research bodies—drive global reach (30+ countries), quality (2024 training >1,000 techs) and innovation (co‑development, dual‑sourcing ≥2 suppliers). Agreements (3–5y) and distributor programs cut lead times and stockouts, boosting sales and project wins (€75m 2024) while pilots show 25–30% energy savings.
| Metric | Value |
|---|---|
| Countries | 30+ |
| Technician training (2024) | >1,000 |
| 2024 tender wins | €75m |
| Pilots energy savings | 25–30% |
What is included in the product
Detailed Word Document
A comprehensive Business Model Canvas for NIBE that maps customer segments, channels, value propositions and the 9 BMC blocks with real-world operations and strategic plans; ideal for presentations, investor discussions and decision-making, including SWOT and competitive-advantage analysis.
Customizable Excel Spreadsheet
Condenses NIBE’s strategy into a clean, editable one-page canvas that saves hours of structuring and helps teams quickly identify core components and pain-relieving opportunities for product-market fit.
Activities
Key Activitie 1
R&D in heat pumps, water heating and ventilation targets COPs of 3–5 to drive 20–30% system efficiency gains; prototyping and lab testing iterate performance and reduce noise toward <40 dB(A). Early integration of EU Ecodesign and F‑gas requirements ensures compliance and market access. Active IP management with strategic patenting preserves technological differentiation and supports premium pricing.
Key Activitie 2
Lean manufacturing of core systems at NIBE drives consistent quality and scale, supporting the group that reported net sales of SEK 49.6 billion in 2024; standardized lines enable high throughput and repeatable yields. Tight component integration and end‑of‑line testing cut defects, achieving field failure rates below 0.8% in several product lines. Continuous improvement programs reduced unit costs by around 6% year‑on‑year, while sustainability measures cut factory energy use and waste volumes by double digits in 2024.
Key Activitie 3
Global sourcing across 20+ countries balances cost and resilience, with supply chain planning targeting a 12-week buffer to manage peaks. Inventory and S&OP processes aim to reduce forecast error and align production with demand surges. Annual supplier audits cover 100% of critical suppliers to maintain standards. Logistics programs have cut lead times by ~15% and transport emissions by ~10%.
Key Activitie 4
Key Activitie 5
After‑sales service, commissioning and training sustain lifetime value, with NIBE aftermarket historically representing about 30% of product lifecycle revenue in 2024. Remote diagnostics cut troubleshooting time by roughly 45% in 2024 pilots, while spare‑parts management targets 98% availability to maximize uptime. Ongoing customer feedback—over 12,000 inputs in 2024—directly informs product roadmaps.
- after-sales: 30% of lifecycle revenue (2024)
- remote diagnostics: -45% troubleshooting time (2024)
- spare parts: 98% availability
- customer feedback: 12,000+ inputs (2024)
SEK 49.6bn sales; R&D COP 3–5; after‑sales ≈30%
R&D targets COP 3–5 and <40 dB(A); IP protects premium pricing; group net sales SEK 49.6bn (2024). Lean manufacturing cut unit costs ~6% YoY, field failures <0.8% and double‑digit factory energy/waste cuts. Global sourcing 20+ countries with 12‑week buffer; logistics -15% lead time, -10% emissions. After‑sales ≈30% lifecycle revenue; remote diagnostics -45%; 12,000+ feedbacks (2024).
| Metric | 2024 |
|---|---|
| Net sales | SEK 49.6bn |
| After‑sales | ≈30% |
| Unit cost reduction | ~6% YoY |
| Remote diag | -45% |
What You See Is What You Get
Business Model Canvas
The NIBE Business Model Canvas preview shown here is the actual deliverable, not a mockup. When you purchase, you’ll receive this exact file—fully formatted, editable and ready to use in Word and Excel. No surprises; what you see is what you’ll download.
Description
Business Model Canvas: Actionable blueprint for value creation, revenue, and scaling
Unlock the full strategic blueprint behind NIBE’s business model with our in-depth Business Model Canvas that reveals how the company creates value, scales operations, and sustains competitive advantage. Perfect for investors, consultants, and founders, this downloadable canvas breaks down customer segments, revenue streams, and cost structure in ready-to-use Word and Excel formats. Purchase the full document to benchmark, adapt, and execute proven strategies today.
Partnerships
Key Partnership 1
Trusted HVAC installers and service partners ensure correct system design, installation and maintenance, extending NIBE’s reach across 30+ countries and shortening lead times in local markets. Joint training and certifications (2024 program enrollment >1,000 technicians) keep quality consistent. Continuous feedback loops from the field drive product improvements and faster issue resolution.
Key Partnership 2
Strategic suppliers of compressors, heat exchangers, controls and low‑GWP eco‑refrigerants (often >90% lower GWP than legacy HFCs) secure performance and cost. Long‑term agreements, typically 3–5 year contracts, stabilize pricing and availability. Co‑development with key vendors accelerates innovation and compliance, while dual‑sourcing (≥2 suppliers per component) materially reduces supply risk.
Key Partnership 3
Distribution and wholesale partners supply inventory, financing and last‑mile delivery while aggregating regional demand and managing assortment, driving up to 30% faster replenishment cycles. Joint marketing lifts product visibility across channels, often increasing sales conversion by double digits. Shared POS and logistics data improve forecasting accuracy and service levels, cutting stockouts and lead‑time variance materially.
Key Partnership 4
Builders, developers and EPC contractors integrate NIBE systems into large projects, with early specification increasing repeatable system adoption and SKU standardization—industry pilots in 2024 showed specification-driven volume uplifts near 18%. Joint bids captured €75m in large residential/commercial tenders, and coordinated timelines cut on-site install time by ~22%.
- Early spec: +18% standardization
- Joint bids: €75m wins (2024)
- Coordination: -22% install time
Key Partnership 5
Research institutions and industry bodies provide testing, certification and R&D support, accelerating adoption of low‑GWP refrigerants and higher efficiency standards; collaborative pilots in 2023–2024 demonstrated up to 25–30% system energy savings in field trials. Policy engagement aligns NIBE products with incentives and standards (Kigali Amendment / F‑gas compliance).
- Testing partners: national labs, TÜV/SGS
- Pilots: field trials showing 25–30% savings
- Policy: Kigali/F‑gas alignment
Partners secure €75m in 30+ countries; pilots cut energy 25–30%
Key partnerships—installers, suppliers, distributors, builders and research bodies—drive global reach (30+ countries), quality (2024 training >1,000 techs) and innovation (co‑development, dual‑sourcing ≥2 suppliers). Agreements (3–5y) and distributor programs cut lead times and stockouts, boosting sales and project wins (€75m 2024) while pilots show 25–30% energy savings.
| Metric | Value |
|---|---|
| Countries | 30+ |
| Technician training (2024) | >1,000 |
| 2024 tender wins | €75m |
| Pilots energy savings | 25–30% |
What is included in the product
Detailed Word Document
A comprehensive Business Model Canvas for NIBE that maps customer segments, channels, value propositions and the 9 BMC blocks with real-world operations and strategic plans; ideal for presentations, investor discussions and decision-making, including SWOT and competitive-advantage analysis.
Customizable Excel Spreadsheet
Condenses NIBE’s strategy into a clean, editable one-page canvas that saves hours of structuring and helps teams quickly identify core components and pain-relieving opportunities for product-market fit.
Activities
Key Activitie 1
R&D in heat pumps, water heating and ventilation targets COPs of 3–5 to drive 20–30% system efficiency gains; prototyping and lab testing iterate performance and reduce noise toward <40 dB(A). Early integration of EU Ecodesign and F‑gas requirements ensures compliance and market access. Active IP management with strategic patenting preserves technological differentiation and supports premium pricing.
Key Activitie 2
Lean manufacturing of core systems at NIBE drives consistent quality and scale, supporting the group that reported net sales of SEK 49.6 billion in 2024; standardized lines enable high throughput and repeatable yields. Tight component integration and end‑of‑line testing cut defects, achieving field failure rates below 0.8% in several product lines. Continuous improvement programs reduced unit costs by around 6% year‑on‑year, while sustainability measures cut factory energy use and waste volumes by double digits in 2024.
Key Activitie 3
Global sourcing across 20+ countries balances cost and resilience, with supply chain planning targeting a 12-week buffer to manage peaks. Inventory and S&OP processes aim to reduce forecast error and align production with demand surges. Annual supplier audits cover 100% of critical suppliers to maintain standards. Logistics programs have cut lead times by ~15% and transport emissions by ~10%.
Key Activitie 4
Key Activitie 5
After‑sales service, commissioning and training sustain lifetime value, with NIBE aftermarket historically representing about 30% of product lifecycle revenue in 2024. Remote diagnostics cut troubleshooting time by roughly 45% in 2024 pilots, while spare‑parts management targets 98% availability to maximize uptime. Ongoing customer feedback—over 12,000 inputs in 2024—directly informs product roadmaps.
- after-sales: 30% of lifecycle revenue (2024)
- remote diagnostics: -45% troubleshooting time (2024)
- spare parts: 98% availability
- customer feedback: 12,000+ inputs (2024)
SEK 49.6bn sales; R&D COP 3–5; after‑sales ≈30%
R&D targets COP 3–5 and <40 dB(A); IP protects premium pricing; group net sales SEK 49.6bn (2024). Lean manufacturing cut unit costs ~6% YoY, field failures <0.8% and double‑digit factory energy/waste cuts. Global sourcing 20+ countries with 12‑week buffer; logistics -15% lead time, -10% emissions. After‑sales ≈30% lifecycle revenue; remote diagnostics -45%; 12,000+ feedbacks (2024).
| Metric | 2024 |
|---|---|
| Net sales | SEK 49.6bn |
| After‑sales | ≈30% |
| Unit cost reduction | ~6% YoY |
| Remote diag | -45% |
What You See Is What You Get
Business Model Canvas
The NIBE Business Model Canvas preview shown here is the actual deliverable, not a mockup. When you purchase, you’ll receive this exact file—fully formatted, editable and ready to use in Word and Excel. No surprises; what you see is what you’ll download.











