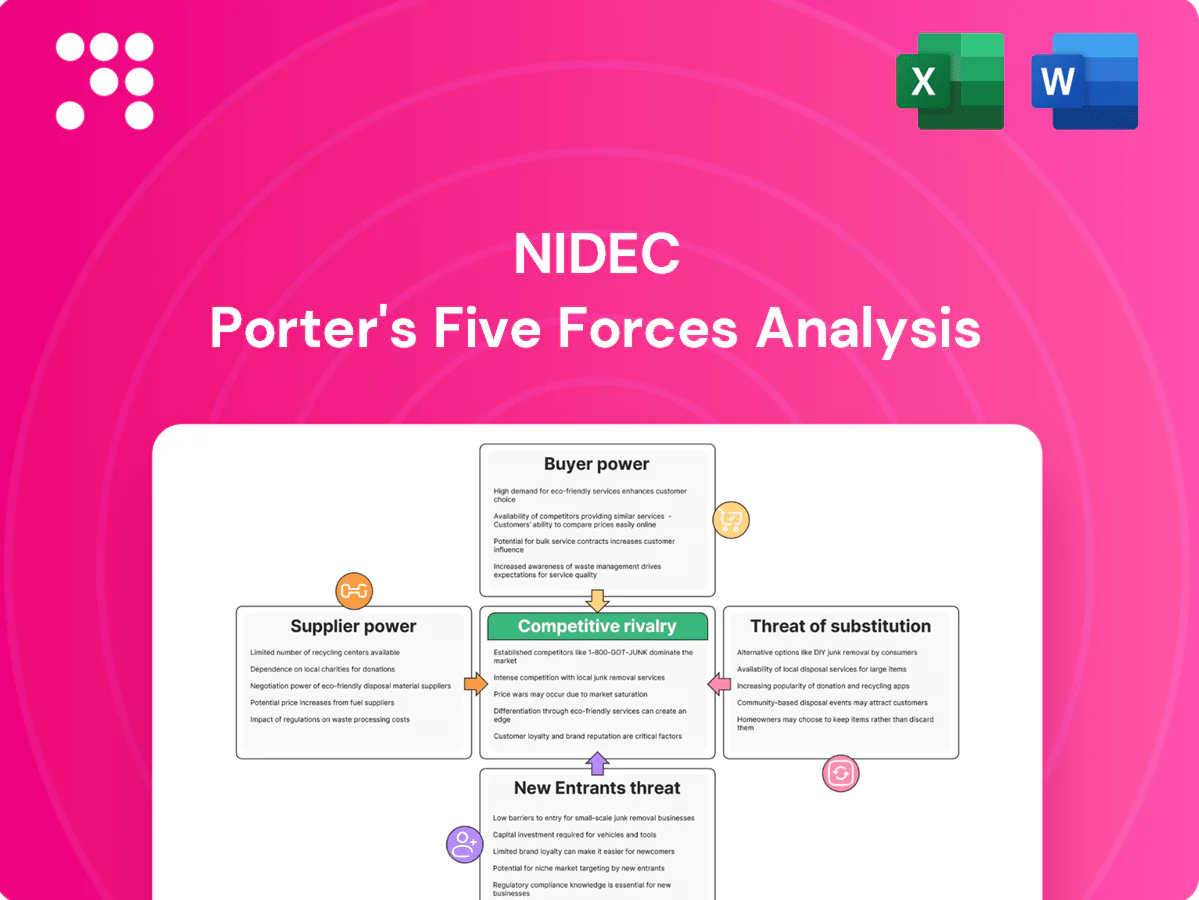
Nidec Porter's Five Forces Analysis

A Must-Have Tool for Decision-Makers
Nidec faces intense supplier and buyer dynamics driven by component concentration and strong OEM bargaining. High barriers from scale and IP limit new entrants while substitutes and technological shifts create a medium threat. This brief snapshot only scratches the surface — unlock the full Porter's Five Forces Analysis to explore Nidec’s competitive dynamics in detail.
Suppliers Bargaining Power

Concentrated critical materials
Nidec relies on rare-earth magnets, copper and specialty steels; in 2024 China accounted for roughly 70% of rare-earth processing, concentrating supply. Export controls or mine disruptions can tighten availability and push magnet costs sharply higher, elevating supplier leverage for high-performance magnets. Nidec offsets with larger inventories and diversified sourcing, including secondary suppliers and alloy hedges. Despite buffers, material-concentration exposure persists, risking margin volatility.
Scale-driven bargaining leverage
Nidec's global scale — FY2024 revenue ~¥2.2 trillion — and high purchase volumes give pricing power with commodity suppliers. Framework agreements and multi-year contracts stabilize input costs; volume commitments secure better lead times and quality. This mitigates upstream vendor power except in rare earths and advanced semiconductors.

Qualification and switching costs
Automotive and industrial motors require stringent qualification (IATF 16949, ISO, PPAP), with PPAP/validation cycles commonly spanning 6–18 months and often locking vendors in for 2–3 years, raising switching costs. This extended validation increases supplier power for specialized components and materials. Nidec’s dual-sourcing strategies improve flexibility but are not always feasible when single-source qualification is necessary.

Technological specificity
Precision bearings, laminations, winding wire, and power electronics for Nidec motors require tight tolerances to hit efficiency and NVH targets, and only a handful of suppliers have the specialized tooling and quality systems to deliver at scale. This concentrated supplier base and years-needed know-how strengthen incumbents’ negotiating positions, especially in premium e-mobility and industrial segments.
- High tolerance components: limited qualified suppliers
- Specialized tooling raises switching costs
- Supplier expertise strengthens pricing leverage
Vertical integration and localization
- Net: moderate supplier power
- Higher for magnets (rare-earth concentration >80%)
- Higher for chips (TSMC ~53% foundry share)
- Backward integration reduces localized supplier risk; full integration impractical
Scale helps, but rare-earth magnets and chips leave manufacturer with strong supplier leverage
Nidec depends on rare-earth magnets (China ~70% of processing in 2024) and specialized bearings/semiconductors, raising supplier leverage for those inputs. FY2024 revenue ~¥2.2 trillion gives bulk-purchase power for commodities and long-term contracts mitigate some risk. Qualification cycles and limited qualified suppliers keep switching costs high, so net supplier power is moderate–high in magnets and chips.
| Item | 2024 metric | Supplier power |
|---|---|---|
| Rare-earth processing | China ~70% | High |
| Foundry share (TSMC) | ~53% | High |
| Scale (Nidec) | FY2024 rev ¥2.2T | Low–Moderate |
What is included in the product
 Detailed Word Document
Tailored Porter's Five Forces analysis of Nidec that uncovers key competitive drivers, supplier and buyer power, threat of substitutes and new entrants, and highlights disruptive technologies and market dynamics shaping its profitability.

 Customizable Excel Spreadsheet
One-sheet Porter's Five Forces for Nidec—visualize supplier/customer power, substitute threats, new entrants and rivalry at a glance to speed strategic choices and boardroom decisions.
Customers Bargaining Power

Large OEM dominance
Automotive, appliance and industrial OEMs drive the bulk of Nidec volumes and exert strong cost-down pressure; large OEMs' scale and procurement sophistication elevate their bargaining power. Annual price reductions of roughly 1–3% and aggressive competitive bidding are common in 2024 procurement cycles. To secure strategic platform wins Nidec frequently trades margin for share, especially in EV and appliance programs.
Design-in lock-in
Custom motors and control algorithms become embedded in customer platforms, creating design-in lock-in that Nidec — which reported JPY 1.88 trillion revenue in FY2024 — leverages across sectors. High requalification effort often exceeds 12 months and raises time-to-market risks, materially increasing buyer switching costs. Post-award, this reduces buyer power over product lifecycle, while upfront buyers use competitive bids to secure roughly 5–10% concessions.

Dual sourcing norms
As of 2024, OEMs mandate dual sourcing for roughly 75% of critical motor procurements to ensure continuity and sustain pricing tension, preserving buyer leverage across sourcing cycles. This forces Nidec to differentiate on performance, reliability, and on-time delivery to avoid commoditization and margin erosion. Winning sole-source positions remains rare outside niche, high-spec applications.

Demand cyclicality and mix
Demand cyclicality in HDDs and consumer appliances—HDD shipments fell ~21% YoY in 2023—amplifies buyer leverage in downturns, pressuring Nidec on price and volumes. Shift toward EVs and robotics raises technical barriers; EV motor/actuator demand growth (2024 estimates +20%–30% YoY) narrows qualified suppliers and can blunt buyer power where performance is critical. Volume volatility nevertheless keeps pricing under strain.
- HDD decline: ~21% YoY (2023)
- EV/robotics demand growth: est. +20%–30% (2024)
- Higher technical specs reduce supplier pool
- Volume swings sustain pricing pressure
Service and lifecycle expectations
Industrial customers demand long warranties, readily available spare parts, and robust field support, making bundled service contracts a common pricing lever that can pressure margins; Nidec’s extensive global service network and strong aftersales performance help defend value and limit buyer-driven concessions.
- Long warranties raise switching costs
- Service bundles act as pricing leverage
- Global service network defends margins
- Aftersales strength shrinks concession scope
OEM dual-sourcing forces 1–3% cuts; HDD volumes down ≈21%
Large OEMs (≈75% dual-source) exert high bargaining power, pushing annual price cuts ~1–3% and 5–10% upfront concessions; Nidec (JPY 1.88 trillion FY2024) trades margin for share in EV/appliance wins. Design-in lock‑in and >12‑month requalification lift switching costs, while HDD decline (~21% YoY 2023) and volume volatility keep pricing pressured.
| Metric | 2023–24 |
|---|---|
| Revenue | JPY 1.88T (FY2024) |
| Dual sourcing | ≈75% |
| Price cuts | 1–3% p.a. |
| HDD decline | ≈21% YoY (2023) |
What You See Is What You Get
Nidec Porter's Five Forces Analysis
This preview shows the exact Porter’s Five Forces analysis for Nidec you’ll receive after purchase—no placeholders or mockups. It examines competitive rivalry, supplier and buyer power, and threats from entrants and substitutes, with strategic implications. The document is fully formatted and ready for instant download and use.

A Must-Have Tool for Decision-Makers
Nidec faces intense supplier and buyer dynamics driven by component concentration and strong OEM bargaining. High barriers from scale and IP limit new entrants while substitutes and technological shifts create a medium threat. This brief snapshot only scratches the surface — unlock the full Porter's Five Forces Analysis to explore Nidec’s competitive dynamics in detail.
Suppliers Bargaining Power
Concentrated critical materials
Nidec relies on rare-earth magnets, copper and specialty steels; in 2024 China accounted for roughly 70% of rare-earth processing, concentrating supply. Export controls or mine disruptions can tighten availability and push magnet costs sharply higher, elevating supplier leverage for high-performance magnets. Nidec offsets with larger inventories and diversified sourcing, including secondary suppliers and alloy hedges. Despite buffers, material-concentration exposure persists, risking margin volatility.
Scale-driven bargaining leverage
Nidec's global scale — FY2024 revenue ~¥2.2 trillion — and high purchase volumes give pricing power with commodity suppliers. Framework agreements and multi-year contracts stabilize input costs; volume commitments secure better lead times and quality. This mitigates upstream vendor power except in rare earths and advanced semiconductors.
Qualification and switching costs
Automotive and industrial motors require stringent qualification (IATF 16949, ISO, PPAP), with PPAP/validation cycles commonly spanning 6–18 months and often locking vendors in for 2–3 years, raising switching costs. This extended validation increases supplier power for specialized components and materials. Nidec’s dual-sourcing strategies improve flexibility but are not always feasible when single-source qualification is necessary.
Technological specificity
Precision bearings, laminations, winding wire, and power electronics for Nidec motors require tight tolerances to hit efficiency and NVH targets, and only a handful of suppliers have the specialized tooling and quality systems to deliver at scale. This concentrated supplier base and years-needed know-how strengthen incumbents’ negotiating positions, especially in premium e-mobility and industrial segments.
- High tolerance components: limited qualified suppliers
- Specialized tooling raises switching costs
- Supplier expertise strengthens pricing leverage
Vertical integration and localization
- Net: moderate supplier power
- Higher for magnets (rare-earth concentration >80%)
- Higher for chips (TSMC ~53% foundry share)
- Backward integration reduces localized supplier risk; full integration impractical
Scale helps, but rare-earth magnets and chips leave manufacturer with strong supplier leverage
Nidec depends on rare-earth magnets (China ~70% of processing in 2024) and specialized bearings/semiconductors, raising supplier leverage for those inputs. FY2024 revenue ~¥2.2 trillion gives bulk-purchase power for commodities and long-term contracts mitigate some risk. Qualification cycles and limited qualified suppliers keep switching costs high, so net supplier power is moderate–high in magnets and chips.
| Item | 2024 metric | Supplier power |
|---|---|---|
| Rare-earth processing | China ~70% | High |
| Foundry share (TSMC) | ~53% | High |
| Scale (Nidec) | FY2024 rev ¥2.2T | Low–Moderate |
What is included in the product
Detailed Word Document
Tailored Porter's Five Forces analysis of Nidec that uncovers key competitive drivers, supplier and buyer power, threat of substitutes and new entrants, and highlights disruptive technologies and market dynamics shaping its profitability.
Customizable Excel Spreadsheet
One-sheet Porter's Five Forces for Nidec—visualize supplier/customer power, substitute threats, new entrants and rivalry at a glance to speed strategic choices and boardroom decisions.
Customers Bargaining Power
Large OEM dominance
Automotive, appliance and industrial OEMs drive the bulk of Nidec volumes and exert strong cost-down pressure; large OEMs' scale and procurement sophistication elevate their bargaining power. Annual price reductions of roughly 1–3% and aggressive competitive bidding are common in 2024 procurement cycles. To secure strategic platform wins Nidec frequently trades margin for share, especially in EV and appliance programs.
Design-in lock-in
Custom motors and control algorithms become embedded in customer platforms, creating design-in lock-in that Nidec — which reported JPY 1.88 trillion revenue in FY2024 — leverages across sectors. High requalification effort often exceeds 12 months and raises time-to-market risks, materially increasing buyer switching costs. Post-award, this reduces buyer power over product lifecycle, while upfront buyers use competitive bids to secure roughly 5–10% concessions.
Dual sourcing norms
As of 2024, OEMs mandate dual sourcing for roughly 75% of critical motor procurements to ensure continuity and sustain pricing tension, preserving buyer leverage across sourcing cycles. This forces Nidec to differentiate on performance, reliability, and on-time delivery to avoid commoditization and margin erosion. Winning sole-source positions remains rare outside niche, high-spec applications.
Demand cyclicality and mix
Demand cyclicality in HDDs and consumer appliances—HDD shipments fell ~21% YoY in 2023—amplifies buyer leverage in downturns, pressuring Nidec on price and volumes. Shift toward EVs and robotics raises technical barriers; EV motor/actuator demand growth (2024 estimates +20%–30% YoY) narrows qualified suppliers and can blunt buyer power where performance is critical. Volume volatility nevertheless keeps pricing under strain.
- HDD decline: ~21% YoY (2023)
- EV/robotics demand growth: est. +20%–30% (2024)
- Higher technical specs reduce supplier pool
- Volume swings sustain pricing pressure
Service and lifecycle expectations
Industrial customers demand long warranties, readily available spare parts, and robust field support, making bundled service contracts a common pricing lever that can pressure margins; Nidec’s extensive global service network and strong aftersales performance help defend value and limit buyer-driven concessions.
- Long warranties raise switching costs
- Service bundles act as pricing leverage
- Global service network defends margins
- Aftersales strength shrinks concession scope
OEM dual-sourcing forces 1–3% cuts; HDD volumes down ≈21%
Large OEMs (≈75% dual-source) exert high bargaining power, pushing annual price cuts ~1–3% and 5–10% upfront concessions; Nidec (JPY 1.88 trillion FY2024) trades margin for share in EV/appliance wins. Design-in lock‑in and >12‑month requalification lift switching costs, while HDD decline (~21% YoY 2023) and volume volatility keep pricing pressured.
| Metric | 2023–24 |
|---|---|
| Revenue | JPY 1.88T (FY2024) |
| Dual sourcing | ≈75% |
| Price cuts | 1–3% p.a. |
| HDD decline | ≈21% YoY (2023) |
What You See Is What You Get
Nidec Porter's Five Forces Analysis
This preview shows the exact Porter’s Five Forces analysis for Nidec you’ll receive after purchase—no placeholders or mockups. It examines competitive rivalry, supplier and buyer power, and threats from entrants and substitutes, with strategic implications. The document is fully formatted and ready for instant download and use.
Description
A Must-Have Tool for Decision-Makers
Nidec faces intense supplier and buyer dynamics driven by component concentration and strong OEM bargaining. High barriers from scale and IP limit new entrants while substitutes and technological shifts create a medium threat. This brief snapshot only scratches the surface — unlock the full Porter's Five Forces Analysis to explore Nidec’s competitive dynamics in detail.
Suppliers Bargaining Power
Concentrated critical materials
Nidec relies on rare-earth magnets, copper and specialty steels; in 2024 China accounted for roughly 70% of rare-earth processing, concentrating supply. Export controls or mine disruptions can tighten availability and push magnet costs sharply higher, elevating supplier leverage for high-performance magnets. Nidec offsets with larger inventories and diversified sourcing, including secondary suppliers and alloy hedges. Despite buffers, material-concentration exposure persists, risking margin volatility.
Scale-driven bargaining leverage
Nidec's global scale — FY2024 revenue ~¥2.2 trillion — and high purchase volumes give pricing power with commodity suppliers. Framework agreements and multi-year contracts stabilize input costs; volume commitments secure better lead times and quality. This mitigates upstream vendor power except in rare earths and advanced semiconductors.
Qualification and switching costs
Automotive and industrial motors require stringent qualification (IATF 16949, ISO, PPAP), with PPAP/validation cycles commonly spanning 6–18 months and often locking vendors in for 2–3 years, raising switching costs. This extended validation increases supplier power for specialized components and materials. Nidec’s dual-sourcing strategies improve flexibility but are not always feasible when single-source qualification is necessary.
Technological specificity
Precision bearings, laminations, winding wire, and power electronics for Nidec motors require tight tolerances to hit efficiency and NVH targets, and only a handful of suppliers have the specialized tooling and quality systems to deliver at scale. This concentrated supplier base and years-needed know-how strengthen incumbents’ negotiating positions, especially in premium e-mobility and industrial segments.
- High tolerance components: limited qualified suppliers
- Specialized tooling raises switching costs
- Supplier expertise strengthens pricing leverage
Vertical integration and localization
- Net: moderate supplier power
- Higher for magnets (rare-earth concentration >80%)
- Higher for chips (TSMC ~53% foundry share)
- Backward integration reduces localized supplier risk; full integration impractical
Scale helps, but rare-earth magnets and chips leave manufacturer with strong supplier leverage
Nidec depends on rare-earth magnets (China ~70% of processing in 2024) and specialized bearings/semiconductors, raising supplier leverage for those inputs. FY2024 revenue ~¥2.2 trillion gives bulk-purchase power for commodities and long-term contracts mitigate some risk. Qualification cycles and limited qualified suppliers keep switching costs high, so net supplier power is moderate–high in magnets and chips.
| Item | 2024 metric | Supplier power |
|---|---|---|
| Rare-earth processing | China ~70% | High |
| Foundry share (TSMC) | ~53% | High |
| Scale (Nidec) | FY2024 rev ¥2.2T | Low–Moderate |
What is included in the product
Detailed Word Document
Tailored Porter's Five Forces analysis of Nidec that uncovers key competitive drivers, supplier and buyer power, threat of substitutes and new entrants, and highlights disruptive technologies and market dynamics shaping its profitability.
Customizable Excel Spreadsheet
One-sheet Porter's Five Forces for Nidec—visualize supplier/customer power, substitute threats, new entrants and rivalry at a glance to speed strategic choices and boardroom decisions.
Customers Bargaining Power
Large OEM dominance
Automotive, appliance and industrial OEMs drive the bulk of Nidec volumes and exert strong cost-down pressure; large OEMs' scale and procurement sophistication elevate their bargaining power. Annual price reductions of roughly 1–3% and aggressive competitive bidding are common in 2024 procurement cycles. To secure strategic platform wins Nidec frequently trades margin for share, especially in EV and appliance programs.
Design-in lock-in
Custom motors and control algorithms become embedded in customer platforms, creating design-in lock-in that Nidec — which reported JPY 1.88 trillion revenue in FY2024 — leverages across sectors. High requalification effort often exceeds 12 months and raises time-to-market risks, materially increasing buyer switching costs. Post-award, this reduces buyer power over product lifecycle, while upfront buyers use competitive bids to secure roughly 5–10% concessions.
Dual sourcing norms
As of 2024, OEMs mandate dual sourcing for roughly 75% of critical motor procurements to ensure continuity and sustain pricing tension, preserving buyer leverage across sourcing cycles. This forces Nidec to differentiate on performance, reliability, and on-time delivery to avoid commoditization and margin erosion. Winning sole-source positions remains rare outside niche, high-spec applications.
Demand cyclicality and mix
Demand cyclicality in HDDs and consumer appliances—HDD shipments fell ~21% YoY in 2023—amplifies buyer leverage in downturns, pressuring Nidec on price and volumes. Shift toward EVs and robotics raises technical barriers; EV motor/actuator demand growth (2024 estimates +20%–30% YoY) narrows qualified suppliers and can blunt buyer power where performance is critical. Volume volatility nevertheless keeps pricing under strain.
- HDD decline: ~21% YoY (2023)
- EV/robotics demand growth: est. +20%–30% (2024)
- Higher technical specs reduce supplier pool
- Volume swings sustain pricing pressure
Service and lifecycle expectations
Industrial customers demand long warranties, readily available spare parts, and robust field support, making bundled service contracts a common pricing lever that can pressure margins; Nidec’s extensive global service network and strong aftersales performance help defend value and limit buyer-driven concessions.
- Long warranties raise switching costs
- Service bundles act as pricing leverage
- Global service network defends margins
- Aftersales strength shrinks concession scope
OEM dual-sourcing forces 1–3% cuts; HDD volumes down ≈21%
Large OEMs (≈75% dual-source) exert high bargaining power, pushing annual price cuts ~1–3% and 5–10% upfront concessions; Nidec (JPY 1.88 trillion FY2024) trades margin for share in EV/appliance wins. Design-in lock‑in and >12‑month requalification lift switching costs, while HDD decline (~21% YoY 2023) and volume volatility keep pricing pressured.
| Metric | 2023–24 |
|---|---|
| Revenue | JPY 1.88T (FY2024) |
| Dual sourcing | ≈75% |
| Price cuts | 1–3% p.a. |
| HDD decline | ≈21% YoY (2023) |
What You See Is What You Get
Nidec Porter's Five Forces Analysis
This preview shows the exact Porter’s Five Forces analysis for Nidec you’ll receive after purchase—no placeholders or mockups. It examines competitive rivalry, supplier and buyer power, and threats from entrants and substitutes, with strategic implications. The document is fully formatted and ready for instant download and use.











