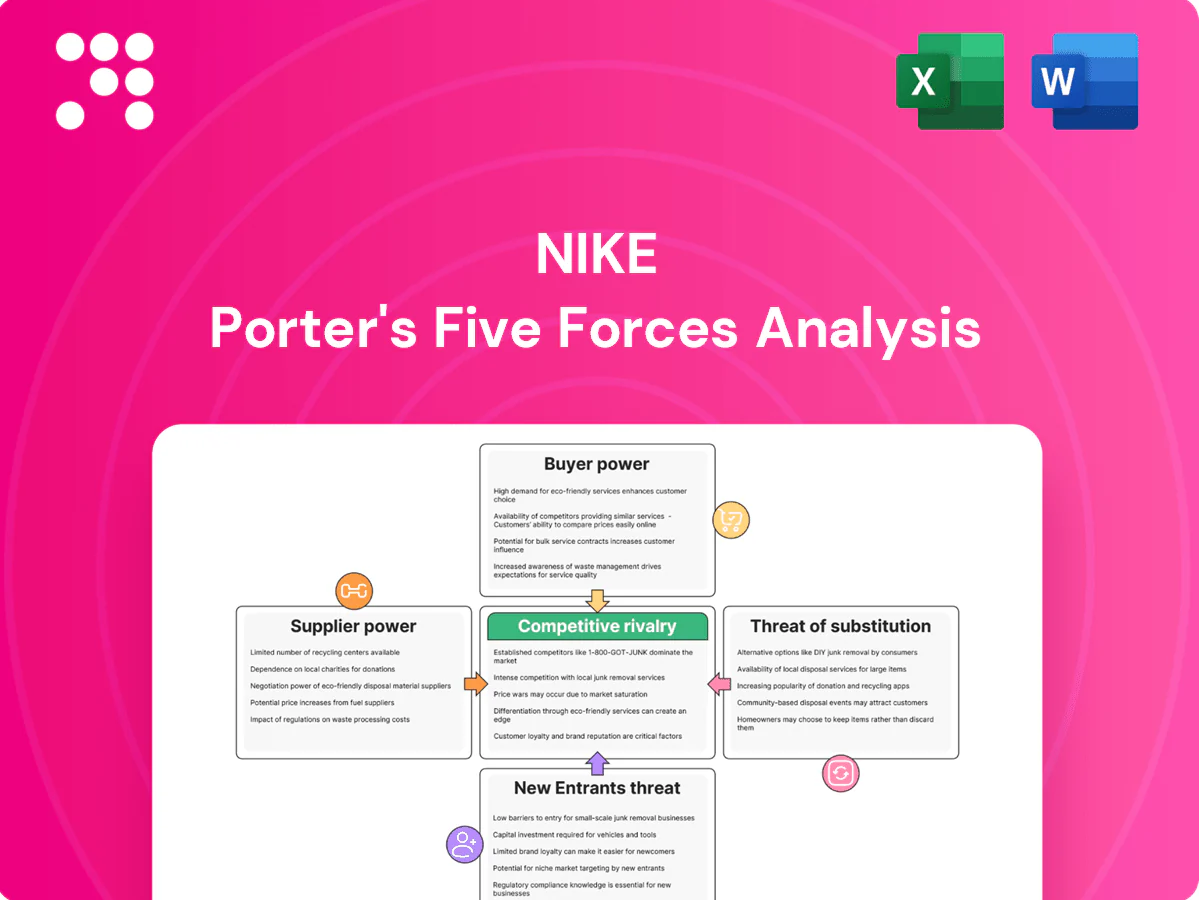
Nike Porter's Five Forces Analysis

Don't Miss the Bigger Picture
Nike’s Porter's Five Forces highlights intense competitive rivalry and strong buyer expectations, tempered by powerful brand advantages and scale that limit new entrants while supplier power remains moderate and substitutes pose a steady but manageable threat. The analysis reveals where Nike can defend margins and where disruption risks lie. This brief snapshot only scratches the surface. Unlock the full Porter's Five Forces Analysis to explore Nike’s competitive dynamics, market pressures, and strategic advantages in detail.
Suppliers Bargaining Power

Global contract manufacturing base
Nike sources from a diversified network of around 500 contract factories across roughly 50 countries, limiting any single supplier’s leverage. Switching production is complex but feasible due to standardized processes and multi-sourcing, and Nike’s scale—serving >50 billion-dollar revenue brands—drives bargaining power on price, quality and lead times. Concentration in Vietnam and China (Vietnam ~40% of production) elevates disruption risk.
Specialized materials and tech inputs
Proprietary foams, Flyknit and Air units create pockets of supplier power; when inputs are unique or IP-protected, switching costs rise and suppliers can command premiums. Nike, which posted roughly $51.2 billion revenue in FY2024, mitigates this via co-development and multi-sourcing agreements. Still, dependence on a few specialty vendors can raise pricing and supply disruption risk.

Compliance and ESG requirements
Strict labor, environmental and traceability standards shrink the eligible supplier pool, increasing negotiating leverage and compliance costs for remaining partners; Nike reported fiscal 2024 revenue of about $51 billion, amplifying the financial impact of supplier cost shifts. Nike’s auditing, remediation programs and long-term contracts (disclosed in its 2024 Sustainable Business Report) help stabilize terms and limit price volatility. High-profile non-compliance events have forced abrupt supplier changes, disrupting margins and production timing.

Logistics and capacity constraints
Logistics and capacity constraints—volatile freight rates (container spot rates down roughly 70% from 2022 peaks to 2024), port congestion, and limited factory capacity strengthen vendors and logistics providers; during demand spikes suppliers favor partners with stronger relationships and forecasts. Nike’s scale (FY2024 revenue about 51.2 billion USD and >500 contract factories) secures capacity but not unlimited flexibility, so short-term bottlenecks can still squeeze lead times and pricing.
- Freight volatility amplifies supplier leverage
- Suppliers prioritize brands with firm forecasts
- Nike scale reduces but does not eliminate bottlenecks
Currency and commodity exposure
Fluctuations in oil (~$86/bbl average in 2024), cotton (~$0.95/lb) and rubber (~$1.90/kg), plus FX swings (USD index up ~6% in 2024), shift bargaining toward suppliers seeking cost pass-throughs; long-dated contracts and hedging partially offset spikes but sustained inflation prompts supplier repricing. Nike scale (FY2024 revenue ~$51.2B) helps negotiate but cannot fully neutralize macro cost pressure.
- Oil: $86/bbl (2024)
- Cotton: $0.95/lb (2024)
- Rubber: $1.90/kg (2024)
- USD index: +6% (2024)
- Nike FY2024 rev: $51.2B
Vietnam concentration and input-cost pressure threaten supply-chain resilience
Nike’s diversified ~500 contract factories across ~50 countries and FY2024 revenue $51.2B limit individual supplier leverage, but Vietnam (~40% output) and specialty inputs raise concentration risk. Proprietary tech and strict ESG standards increase supplier bargaining on price and lead times; logistics volatility and commodity swings (oil $86/bbl, cotton $0.95/lb, rubber $1.90/kg, USD +6% 2024) sustain upward pressure.
| Metric | Value (2024) |
|---|---|
| FY Revenue | $51.2B |
| Contract factories | ~500 |
| Vietnam share | ~40% |
| Oil | $86/bbl |
| Cotton | $0.95/lb |
| Rubber | $1.90/kg |
| USD index | +6% |
| Container rates | -~70% vs 2022 peak |
What is included in the product
 Detailed Word Document
Analyzes the five competitive forces shaping Nike—rivalry, supplier and buyer power, threats from new entrants and substitutes—highlighting how these forces influence pricing, margins, market share, and strategic defenses while identifying disruptive threats and entry barriers.

 Customizable Excel Spreadsheet
Concise Nike Porter's Five Forces one-sheet that highlights supplier/buyer power, rivalry, substitutes and entry threats—perfect for quick strategy decisions, customizable pressure levels and radar chart visual for board decks or investor briefs.
Customers Bargaining Power

Powerful wholesale retailers
Large wholesale retailers and sporting-goods chains exert volume-based leverage over Nike on pricing, promotions and shelf space, pressuring terms despite Nike reporting fiscal 2024 revenue of about $51.2 billion and a gross margin near 45%; brand pull cushions some pressure. Nike uses strategic account management and differentiated assortments to protect margins, yet wholesale partners can push for deeper discounts and inventory concessions in downturns.
Shift to direct-to-consumer (DTC)
Expanding DTC reduced intermediary power—DTC reached about 46% of Nike’s revenue in FY2024—giving Nike greater data control and higher gross margins. Consumers still compare prices across marketplaces, keeping price transparency and bargaining leverage high. DTC enables tailored experiences and loyalty programs that lower churn. Large investments in fulfillment and higher fulfillment costs (ongoing capex) temper short-term net advantage.

High brand loyalty but price sensitivity
Consumers value Nike’s innovation and status, reducing elasticity for marquee lines; Nike reported roughly $50 billion in revenue in FY2024, underscoring strong pricing power. Entry-level buyers remain price-sensitive and respond to discounts, while frequent promotions train shoppers to wait for deals. Premium drops and limited editions, with resale premiums often 2–5x, help sustain pricing and margins.

Digital transparency and reviews
Institutional and team contracts
Institutional and team contracts with schools, leagues and federations lock multi-year volumes and drive bargaining power through competitive bids among top brands; Nike reported FY2024 revenue of about $51.2 billion, underlining scale behind its concessions. Nike often trades price or payment timing for visibility and pipeline access, while performance guarantees and service-level clauses add measurable operational costs and risk.
- Multi-year volume lock
- Competitive bidding leverage
- Price concessions for visibility
- Performance guarantees raise operational demands
$51.2B sales: DTC 46%, margin 45%
Large retailers wield volume leverage despite Nike FY2024 revenue $51.2B and gross margin ~45%; DTC ~46% of sales reduces intermediary power. Brand strength and 300M members support pricing for premium lines while entry buyers remain price-sensitive; social media amplifies buyer influence.
| Metric | 2024 |
|---|---|
| Revenue | $51.2B |
| Gross margin | ~45% |
| DTC share | ~46% |
| Members | 300M |
Preview Before You Purchase
Nike Porter's Five Forces Analysis
This preview shows the complete Nike Porter’s Five Forces analysis you’ll receive immediately after purchase—no placeholders or mockups. It’s the fully formatted, professionally written document ready for download and use the moment you complete payment. The file includes supplier, buyer, rivalry, threat of entrants, and substitute assessments with evidence-based commentary and strategic implications.

Don't Miss the Bigger Picture
Nike’s Porter's Five Forces highlights intense competitive rivalry and strong buyer expectations, tempered by powerful brand advantages and scale that limit new entrants while supplier power remains moderate and substitutes pose a steady but manageable threat. The analysis reveals where Nike can defend margins and where disruption risks lie. This brief snapshot only scratches the surface. Unlock the full Porter's Five Forces Analysis to explore Nike’s competitive dynamics, market pressures, and strategic advantages in detail.
Suppliers Bargaining Power
Global contract manufacturing base
Nike sources from a diversified network of around 500 contract factories across roughly 50 countries, limiting any single supplier’s leverage. Switching production is complex but feasible due to standardized processes and multi-sourcing, and Nike’s scale—serving >50 billion-dollar revenue brands—drives bargaining power on price, quality and lead times. Concentration in Vietnam and China (Vietnam ~40% of production) elevates disruption risk.
Specialized materials and tech inputs
Proprietary foams, Flyknit and Air units create pockets of supplier power; when inputs are unique or IP-protected, switching costs rise and suppliers can command premiums. Nike, which posted roughly $51.2 billion revenue in FY2024, mitigates this via co-development and multi-sourcing agreements. Still, dependence on a few specialty vendors can raise pricing and supply disruption risk.
Compliance and ESG requirements
Strict labor, environmental and traceability standards shrink the eligible supplier pool, increasing negotiating leverage and compliance costs for remaining partners; Nike reported fiscal 2024 revenue of about $51 billion, amplifying the financial impact of supplier cost shifts. Nike’s auditing, remediation programs and long-term contracts (disclosed in its 2024 Sustainable Business Report) help stabilize terms and limit price volatility. High-profile non-compliance events have forced abrupt supplier changes, disrupting margins and production timing.
Logistics and capacity constraints
Logistics and capacity constraints—volatile freight rates (container spot rates down roughly 70% from 2022 peaks to 2024), port congestion, and limited factory capacity strengthen vendors and logistics providers; during demand spikes suppliers favor partners with stronger relationships and forecasts. Nike’s scale (FY2024 revenue about 51.2 billion USD and >500 contract factories) secures capacity but not unlimited flexibility, so short-term bottlenecks can still squeeze lead times and pricing.
- Freight volatility amplifies supplier leverage
- Suppliers prioritize brands with firm forecasts
- Nike scale reduces but does not eliminate bottlenecks
Currency and commodity exposure
Fluctuations in oil (~$86/bbl average in 2024), cotton (~$0.95/lb) and rubber (~$1.90/kg), plus FX swings (USD index up ~6% in 2024), shift bargaining toward suppliers seeking cost pass-throughs; long-dated contracts and hedging partially offset spikes but sustained inflation prompts supplier repricing. Nike scale (FY2024 revenue ~$51.2B) helps negotiate but cannot fully neutralize macro cost pressure.
- Oil: $86/bbl (2024)
- Cotton: $0.95/lb (2024)
- Rubber: $1.90/kg (2024)
- USD index: +6% (2024)
- Nike FY2024 rev: $51.2B
Vietnam concentration and input-cost pressure threaten supply-chain resilience
Nike’s diversified ~500 contract factories across ~50 countries and FY2024 revenue $51.2B limit individual supplier leverage, but Vietnam (~40% output) and specialty inputs raise concentration risk. Proprietary tech and strict ESG standards increase supplier bargaining on price and lead times; logistics volatility and commodity swings (oil $86/bbl, cotton $0.95/lb, rubber $1.90/kg, USD +6% 2024) sustain upward pressure.
| Metric | Value (2024) |
|---|---|
| FY Revenue | $51.2B |
| Contract factories | ~500 |
| Vietnam share | ~40% |
| Oil | $86/bbl |
| Cotton | $0.95/lb |
| Rubber | $1.90/kg |
| USD index | +6% |
| Container rates | -~70% vs 2022 peak |
What is included in the product
Detailed Word Document
Analyzes the five competitive forces shaping Nike—rivalry, supplier and buyer power, threats from new entrants and substitutes—highlighting how these forces influence pricing, margins, market share, and strategic defenses while identifying disruptive threats and entry barriers.
Customizable Excel Spreadsheet
Concise Nike Porter's Five Forces one-sheet that highlights supplier/buyer power, rivalry, substitutes and entry threats—perfect for quick strategy decisions, customizable pressure levels and radar chart visual for board decks or investor briefs.
Customers Bargaining Power
Powerful wholesale retailers
Large wholesale retailers and sporting-goods chains exert volume-based leverage over Nike on pricing, promotions and shelf space, pressuring terms despite Nike reporting fiscal 2024 revenue of about $51.2 billion and a gross margin near 45%; brand pull cushions some pressure. Nike uses strategic account management and differentiated assortments to protect margins, yet wholesale partners can push for deeper discounts and inventory concessions in downturns.
Shift to direct-to-consumer (DTC)
Expanding DTC reduced intermediary power—DTC reached about 46% of Nike’s revenue in FY2024—giving Nike greater data control and higher gross margins. Consumers still compare prices across marketplaces, keeping price transparency and bargaining leverage high. DTC enables tailored experiences and loyalty programs that lower churn. Large investments in fulfillment and higher fulfillment costs (ongoing capex) temper short-term net advantage.
High brand loyalty but price sensitivity
Consumers value Nike’s innovation and status, reducing elasticity for marquee lines; Nike reported roughly $50 billion in revenue in FY2024, underscoring strong pricing power. Entry-level buyers remain price-sensitive and respond to discounts, while frequent promotions train shoppers to wait for deals. Premium drops and limited editions, with resale premiums often 2–5x, help sustain pricing and margins.
Digital transparency and reviews
Institutional and team contracts
Institutional and team contracts with schools, leagues and federations lock multi-year volumes and drive bargaining power through competitive bids among top brands; Nike reported FY2024 revenue of about $51.2 billion, underlining scale behind its concessions. Nike often trades price or payment timing for visibility and pipeline access, while performance guarantees and service-level clauses add measurable operational costs and risk.
- Multi-year volume lock
- Competitive bidding leverage
- Price concessions for visibility
- Performance guarantees raise operational demands
$51.2B sales: DTC 46%, margin 45%
Large retailers wield volume leverage despite Nike FY2024 revenue $51.2B and gross margin ~45%; DTC ~46% of sales reduces intermediary power. Brand strength and 300M members support pricing for premium lines while entry buyers remain price-sensitive; social media amplifies buyer influence.
| Metric | 2024 |
|---|---|
| Revenue | $51.2B |
| Gross margin | ~45% |
| DTC share | ~46% |
| Members | 300M |
Preview Before You Purchase
Nike Porter's Five Forces Analysis
This preview shows the complete Nike Porter’s Five Forces analysis you’ll receive immediately after purchase—no placeholders or mockups. It’s the fully formatted, professionally written document ready for download and use the moment you complete payment. The file includes supplier, buyer, rivalry, threat of entrants, and substitute assessments with evidence-based commentary and strategic implications.
Original: $10.00
-65%$10.00
$3.50Description
Don't Miss the Bigger Picture
Nike’s Porter's Five Forces highlights intense competitive rivalry and strong buyer expectations, tempered by powerful brand advantages and scale that limit new entrants while supplier power remains moderate and substitutes pose a steady but manageable threat. The analysis reveals where Nike can defend margins and where disruption risks lie. This brief snapshot only scratches the surface. Unlock the full Porter's Five Forces Analysis to explore Nike’s competitive dynamics, market pressures, and strategic advantages in detail.
Suppliers Bargaining Power
Global contract manufacturing base
Nike sources from a diversified network of around 500 contract factories across roughly 50 countries, limiting any single supplier’s leverage. Switching production is complex but feasible due to standardized processes and multi-sourcing, and Nike’s scale—serving >50 billion-dollar revenue brands—drives bargaining power on price, quality and lead times. Concentration in Vietnam and China (Vietnam ~40% of production) elevates disruption risk.
Specialized materials and tech inputs
Proprietary foams, Flyknit and Air units create pockets of supplier power; when inputs are unique or IP-protected, switching costs rise and suppliers can command premiums. Nike, which posted roughly $51.2 billion revenue in FY2024, mitigates this via co-development and multi-sourcing agreements. Still, dependence on a few specialty vendors can raise pricing and supply disruption risk.
Compliance and ESG requirements
Strict labor, environmental and traceability standards shrink the eligible supplier pool, increasing negotiating leverage and compliance costs for remaining partners; Nike reported fiscal 2024 revenue of about $51 billion, amplifying the financial impact of supplier cost shifts. Nike’s auditing, remediation programs and long-term contracts (disclosed in its 2024 Sustainable Business Report) help stabilize terms and limit price volatility. High-profile non-compliance events have forced abrupt supplier changes, disrupting margins and production timing.
Logistics and capacity constraints
Logistics and capacity constraints—volatile freight rates (container spot rates down roughly 70% from 2022 peaks to 2024), port congestion, and limited factory capacity strengthen vendors and logistics providers; during demand spikes suppliers favor partners with stronger relationships and forecasts. Nike’s scale (FY2024 revenue about 51.2 billion USD and >500 contract factories) secures capacity but not unlimited flexibility, so short-term bottlenecks can still squeeze lead times and pricing.
- Freight volatility amplifies supplier leverage
- Suppliers prioritize brands with firm forecasts
- Nike scale reduces but does not eliminate bottlenecks
Currency and commodity exposure
Fluctuations in oil (~$86/bbl average in 2024), cotton (~$0.95/lb) and rubber (~$1.90/kg), plus FX swings (USD index up ~6% in 2024), shift bargaining toward suppliers seeking cost pass-throughs; long-dated contracts and hedging partially offset spikes but sustained inflation prompts supplier repricing. Nike scale (FY2024 revenue ~$51.2B) helps negotiate but cannot fully neutralize macro cost pressure.
- Oil: $86/bbl (2024)
- Cotton: $0.95/lb (2024)
- Rubber: $1.90/kg (2024)
- USD index: +6% (2024)
- Nike FY2024 rev: $51.2B
Vietnam concentration and input-cost pressure threaten supply-chain resilience
Nike’s diversified ~500 contract factories across ~50 countries and FY2024 revenue $51.2B limit individual supplier leverage, but Vietnam (~40% output) and specialty inputs raise concentration risk. Proprietary tech and strict ESG standards increase supplier bargaining on price and lead times; logistics volatility and commodity swings (oil $86/bbl, cotton $0.95/lb, rubber $1.90/kg, USD +6% 2024) sustain upward pressure.
| Metric | Value (2024) |
|---|---|
| FY Revenue | $51.2B |
| Contract factories | ~500 |
| Vietnam share | ~40% |
| Oil | $86/bbl |
| Cotton | $0.95/lb |
| Rubber | $1.90/kg |
| USD index | +6% |
| Container rates | -~70% vs 2022 peak |
What is included in the product
Detailed Word Document
Analyzes the five competitive forces shaping Nike—rivalry, supplier and buyer power, threats from new entrants and substitutes—highlighting how these forces influence pricing, margins, market share, and strategic defenses while identifying disruptive threats and entry barriers.
Customizable Excel Spreadsheet
Concise Nike Porter's Five Forces one-sheet that highlights supplier/buyer power, rivalry, substitutes and entry threats—perfect for quick strategy decisions, customizable pressure levels and radar chart visual for board decks or investor briefs.
Customers Bargaining Power
Powerful wholesale retailers
Large wholesale retailers and sporting-goods chains exert volume-based leverage over Nike on pricing, promotions and shelf space, pressuring terms despite Nike reporting fiscal 2024 revenue of about $51.2 billion and a gross margin near 45%; brand pull cushions some pressure. Nike uses strategic account management and differentiated assortments to protect margins, yet wholesale partners can push for deeper discounts and inventory concessions in downturns.
Shift to direct-to-consumer (DTC)
Expanding DTC reduced intermediary power—DTC reached about 46% of Nike’s revenue in FY2024—giving Nike greater data control and higher gross margins. Consumers still compare prices across marketplaces, keeping price transparency and bargaining leverage high. DTC enables tailored experiences and loyalty programs that lower churn. Large investments in fulfillment and higher fulfillment costs (ongoing capex) temper short-term net advantage.
High brand loyalty but price sensitivity
Consumers value Nike’s innovation and status, reducing elasticity for marquee lines; Nike reported roughly $50 billion in revenue in FY2024, underscoring strong pricing power. Entry-level buyers remain price-sensitive and respond to discounts, while frequent promotions train shoppers to wait for deals. Premium drops and limited editions, with resale premiums often 2–5x, help sustain pricing and margins.
Digital transparency and reviews
Institutional and team contracts
Institutional and team contracts with schools, leagues and federations lock multi-year volumes and drive bargaining power through competitive bids among top brands; Nike reported FY2024 revenue of about $51.2 billion, underlining scale behind its concessions. Nike often trades price or payment timing for visibility and pipeline access, while performance guarantees and service-level clauses add measurable operational costs and risk.
- Multi-year volume lock
- Competitive bidding leverage
- Price concessions for visibility
- Performance guarantees raise operational demands
$51.2B sales: DTC 46%, margin 45%
Large retailers wield volume leverage despite Nike FY2024 revenue $51.2B and gross margin ~45%; DTC ~46% of sales reduces intermediary power. Brand strength and 300M members support pricing for premium lines while entry buyers remain price-sensitive; social media amplifies buyer influence.
| Metric | 2024 |
|---|---|
| Revenue | $51.2B |
| Gross margin | ~45% |
| DTC share | ~46% |
| Members | 300M |
Preview Before You Purchase
Nike Porter's Five Forces Analysis
This preview shows the complete Nike Porter’s Five Forces analysis you’ll receive immediately after purchase—no placeholders or mockups. It’s the fully formatted, professionally written document ready for download and use the moment you complete payment. The file includes supplier, buyer, rivalry, threat of entrants, and substitute assessments with evidence-based commentary and strategic implications.











