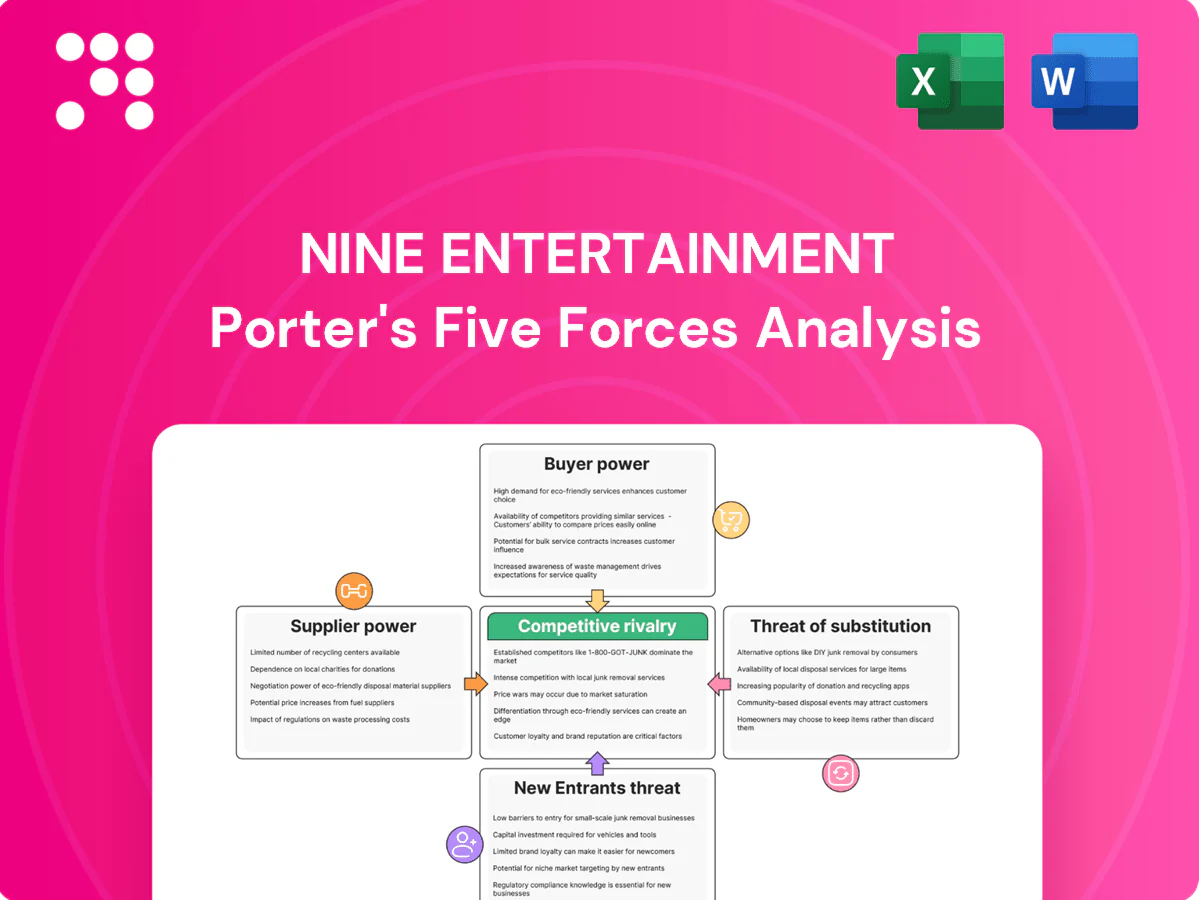
Nine Entertainment Porter's Five Forces Analysis

Don't Miss the Bigger Picture
Nine Entertainment faces intense digital disruption, high buyer power from advertisers, and growing substitute threats from streaming and social platforms, while supplier leverage and regulatory shifts add complexity. This snapshot highlights key pressures on margins and market share. Ready for a deep dive? Unlock the full Porter's Five Forces Analysis to access force-by-force ratings, visuals, and actionable strategy.
Suppliers Bargaining Power

Premium content rights holders
Major sports leagues, studios and international licensors wield concentrated control over premium rights, pushing costs higher; the global sports broadcasting rights market was estimated at about US$70bn in 2024. Nine’s dependence on marquee sports and premium shows narrows negotiation flexibility and raises exposure to price swings. Long-term exclusive contracts lock in audience reach but can cement high fees, while typical 3–4 year rights cycles produce periodic spikes and intense bidding pressure.
Creative talent and production houses
Star presenters, journalists and independent producers command significant premiums, and in 2024 their brand draw continues to concentrate bargaining power with Nine; top-tier talent often negotiates above-standard fees. Union rules and scarcity of elite creatives increase wage pressure and contractual rigidity. Vertical integration reduces some supplier exposure, but hit shows still rely on external creatives. Talent churn risks ratings volatility and higher retention spend.

Technology and distribution vendors
CDNs, ad-tech, cloud and broadcast equipment vendors are numerous but switching is complex due to compliance, sub-100ms latency targets and 99.99% uptime SLAs; Stan (≈2.5m subscribers in 2024) and broadcast operations face quasi-lock-in. Ad-tech consolidation (Google/Facebook ~60% of AU digital ad spend in 2024) can push take rates higher, while multi-vendor strategies cut vendor risk but raise integration costs.

Newsprint, printing, and distribution
Concentration of newsprint mills and contracting print facilities increases supplier bargaining power for Nine, while logistics bottlenecks and 2024 fuel-price volatility raised distribution costs, squeezing print margins even as digital revenue overtook print in 2024; continuing circulation declines reduce Nine’s scale leverage with print suppliers.
- Fewer print mills -> higher input power
- Fuel/logistics volatility -> rising distribution costs
- Digital > print in 2024 -> lower exposure
- Volume decline -> weaker supplier leverage
Music, archives, and IP licensing
Music libraries and archival footage owners exert strong supplier power: IFPI reported recorded music revenues of $29.2bn in 2023, enabling premium fees for evergreen content. Fragmented rights force cumulative licensing; blanket deals lower friction but not cost growth. Compliance and takedown risks add leverage to rights holders.
- Premium pricing: IFPI 2023 $29.2bn
- Fragmentation: cumulative licenses
- Blanket licenses: lower friction, persistent cost
- Risk: takedowns/compliance = bargaining leverage
Concentrated rights, ad-tech dominance and supply shocks squeeze media margins
Concentrated sports/studio licensors and top talent push up rights and wage costs—global sports rights ≈ US$70bn (2024) and Stan ≈2.5m subscribers (2024) reduce Nine’s leverage. Ad-tech concentration (Google/Facebook ~60% AU digital ad spend, 2024) and CDN/tech switching complexity raise operating costs and vendor lock-in. Print supply consolidation and fuel volatility squeeze margins while music/IP fees remain persistent (IFPI recorded music $29.2bn, 2023).
| Supplier | Key 2023/24 metric |
|---|---|
| Sports rights | US$70bn (2024) |
| Streaming subs | Stan ≈2.5m (2024) |
| Ad-tech share AU | Google/Facebook ~60% (2024) |
| Recorded music | $29.2bn (IFPI 2023) |
What is included in the product
 Detailed Word Document
Tailored Porter's Five Forces analysis for Nine Entertainment that uncovers key drivers of competition, buyer and supplier power, entry barriers and substitutes, and identifies disruptive threats and strategic levers shaping its market position.

 Customizable Excel Spreadsheet
A concise Porter's Five Forces snapshot for Nine Entertainment—clarifies competitive pressures and revenue risks for faster, board-ready decisions. Swap inputs, update scenarios, and export a clean visual to slides without complex tools.
Customers Bargaining Power

Advertisers and media agencies
Large agencies aggregate client budgets and secure tougher CPM and sponsorship terms, while Nine’s cross-platform bundles (linear plus streaming) protect yield though buyers increasingly reallocate spend to digital and social; in 2024 measurement demands and brand-safety constraints strengthened buyer leverage, and economic cycles amplified pricing sensitivity and campaign cancellations.
SVOD subscribers (Stan)
SVOD subscribers (Stan) face low switching costs to Netflix, Disney+ and others, increasing churn risk; Stan reported about 2.6 million subscribers in 2024, highlighting a competitive battleground. Price hikes encounter immediate elasticity tests given abundant alternatives, while exclusive content pockets reduce buyer power but demand heavy investment. Bundles and annual plans modestly raise switching frictions.

Audiences for FTA and radio
Viewers and listeners pay with attention, not cash and can switch instantly; with smartphone penetration ~92% in Australia (2024) competing platforms fragment time and dilute Nine’s FTA reach (Nine’s metro audience share ~24% in 2024). Local news and live sport still partially anchor loyalty, while UX quality and 9Now app performance directly affect retention and ad monetisation.

Corporate and SME advertisers (direct)
Corporate and SME advertisers exert moderate bargaining power: individual SMEs have limited leverage but collectively shape inventory mix, while self-serve platforms and programmatic options outside Nine increase alternatives and price sensitivity. Performance demands in 2024 push attribution and lower-funnel pricing, but Nine’s first-party data and ~17 million monthly Australian reach can justify premium CPMs where targeting measurably lifts ROI.
- Collective SME influence on inventory
- Self-serve/programmatic alternatives
- 2024: stronger attribution pressure
- First-party data enables premium pricing
Enterprise partnerships and affiliates
Enterprise partnerships—distribution partners, device ecosystems and telcos—can demand prominent placement and revenue shares, shifting bargaining power to customers; app store and billing integrations carry commission costs (Apple/Google tiers 15%–30% in 2024). Prominent app-store positioning and billing bring visibility but reduce margins; co-marketing expands reach while sharing revenue, so Nine must diversify partners to avoid concentration risk.
Buyers tighten CPMs in 2024; cross-platform bundles defend yield
Buyers strengthened leverage in 2024 as agencies and programmatic channels push tougher CPMs, while Nine’s cross‑platform bundles protect yield against reallocating spend.
Stan faced churn risk with ~2.6m subs (2024) and low switching costs; smartphone penetration ~92% and Nine metro share ~24% dilute linear reach.
First‑party reach ~17m and exclusive live sport support premium CPMs; app‑store commissions 15–30% compress margins.
| Metric | 2024 |
|---|---|
| Stan subscribers | ~2.6m |
| Smartphone penetration | ~92% |
| Nine metro share | ~24% |
| First‑party reach | ~17m |
| App store fees | 15–30% |
Full Version Awaits
Nine Entertainment Porter's Five Forces Analysis
This preview shows the exact Nine Entertainment Porter’s Five Forces analysis you'll receive after purchase—no placeholders or edits. The document is fully formatted and ready for download the moment you buy. What you see here is the complete, final deliverable for immediate use.

Don't Miss the Bigger Picture
Nine Entertainment faces intense digital disruption, high buyer power from advertisers, and growing substitute threats from streaming and social platforms, while supplier leverage and regulatory shifts add complexity. This snapshot highlights key pressures on margins and market share. Ready for a deep dive? Unlock the full Porter's Five Forces Analysis to access force-by-force ratings, visuals, and actionable strategy.
Suppliers Bargaining Power
Premium content rights holders
Major sports leagues, studios and international licensors wield concentrated control over premium rights, pushing costs higher; the global sports broadcasting rights market was estimated at about US$70bn in 2024. Nine’s dependence on marquee sports and premium shows narrows negotiation flexibility and raises exposure to price swings. Long-term exclusive contracts lock in audience reach but can cement high fees, while typical 3–4 year rights cycles produce periodic spikes and intense bidding pressure.
Creative talent and production houses
Star presenters, journalists and independent producers command significant premiums, and in 2024 their brand draw continues to concentrate bargaining power with Nine; top-tier talent often negotiates above-standard fees. Union rules and scarcity of elite creatives increase wage pressure and contractual rigidity. Vertical integration reduces some supplier exposure, but hit shows still rely on external creatives. Talent churn risks ratings volatility and higher retention spend.
Technology and distribution vendors
CDNs, ad-tech, cloud and broadcast equipment vendors are numerous but switching is complex due to compliance, sub-100ms latency targets and 99.99% uptime SLAs; Stan (≈2.5m subscribers in 2024) and broadcast operations face quasi-lock-in. Ad-tech consolidation (Google/Facebook ~60% of AU digital ad spend in 2024) can push take rates higher, while multi-vendor strategies cut vendor risk but raise integration costs.
Newsprint, printing, and distribution
Concentration of newsprint mills and contracting print facilities increases supplier bargaining power for Nine, while logistics bottlenecks and 2024 fuel-price volatility raised distribution costs, squeezing print margins even as digital revenue overtook print in 2024; continuing circulation declines reduce Nine’s scale leverage with print suppliers.
- Fewer print mills -> higher input power
- Fuel/logistics volatility -> rising distribution costs
- Digital > print in 2024 -> lower exposure
- Volume decline -> weaker supplier leverage
Music, archives, and IP licensing
Music libraries and archival footage owners exert strong supplier power: IFPI reported recorded music revenues of $29.2bn in 2023, enabling premium fees for evergreen content. Fragmented rights force cumulative licensing; blanket deals lower friction but not cost growth. Compliance and takedown risks add leverage to rights holders.
- Premium pricing: IFPI 2023 $29.2bn
- Fragmentation: cumulative licenses
- Blanket licenses: lower friction, persistent cost
- Risk: takedowns/compliance = bargaining leverage
Concentrated rights, ad-tech dominance and supply shocks squeeze media margins
Concentrated sports/studio licensors and top talent push up rights and wage costs—global sports rights ≈ US$70bn (2024) and Stan ≈2.5m subscribers (2024) reduce Nine’s leverage. Ad-tech concentration (Google/Facebook ~60% AU digital ad spend, 2024) and CDN/tech switching complexity raise operating costs and vendor lock-in. Print supply consolidation and fuel volatility squeeze margins while music/IP fees remain persistent (IFPI recorded music $29.2bn, 2023).
| Supplier | Key 2023/24 metric |
|---|---|
| Sports rights | US$70bn (2024) |
| Streaming subs | Stan ≈2.5m (2024) |
| Ad-tech share AU | Google/Facebook ~60% (2024) |
| Recorded music | $29.2bn (IFPI 2023) |
What is included in the product
Detailed Word Document
Tailored Porter's Five Forces analysis for Nine Entertainment that uncovers key drivers of competition, buyer and supplier power, entry barriers and substitutes, and identifies disruptive threats and strategic levers shaping its market position.
Customizable Excel Spreadsheet
A concise Porter's Five Forces snapshot for Nine Entertainment—clarifies competitive pressures and revenue risks for faster, board-ready decisions. Swap inputs, update scenarios, and export a clean visual to slides without complex tools.
Customers Bargaining Power
Advertisers and media agencies
Large agencies aggregate client budgets and secure tougher CPM and sponsorship terms, while Nine’s cross-platform bundles (linear plus streaming) protect yield though buyers increasingly reallocate spend to digital and social; in 2024 measurement demands and brand-safety constraints strengthened buyer leverage, and economic cycles amplified pricing sensitivity and campaign cancellations.
SVOD subscribers (Stan)
SVOD subscribers (Stan) face low switching costs to Netflix, Disney+ and others, increasing churn risk; Stan reported about 2.6 million subscribers in 2024, highlighting a competitive battleground. Price hikes encounter immediate elasticity tests given abundant alternatives, while exclusive content pockets reduce buyer power but demand heavy investment. Bundles and annual plans modestly raise switching frictions.
Audiences for FTA and radio
Viewers and listeners pay with attention, not cash and can switch instantly; with smartphone penetration ~92% in Australia (2024) competing platforms fragment time and dilute Nine’s FTA reach (Nine’s metro audience share ~24% in 2024). Local news and live sport still partially anchor loyalty, while UX quality and 9Now app performance directly affect retention and ad monetisation.
Corporate and SME advertisers (direct)
Corporate and SME advertisers exert moderate bargaining power: individual SMEs have limited leverage but collectively shape inventory mix, while self-serve platforms and programmatic options outside Nine increase alternatives and price sensitivity. Performance demands in 2024 push attribution and lower-funnel pricing, but Nine’s first-party data and ~17 million monthly Australian reach can justify premium CPMs where targeting measurably lifts ROI.
- Collective SME influence on inventory
- Self-serve/programmatic alternatives
- 2024: stronger attribution pressure
- First-party data enables premium pricing
Enterprise partnerships and affiliates
Enterprise partnerships—distribution partners, device ecosystems and telcos—can demand prominent placement and revenue shares, shifting bargaining power to customers; app store and billing integrations carry commission costs (Apple/Google tiers 15%–30% in 2024). Prominent app-store positioning and billing bring visibility but reduce margins; co-marketing expands reach while sharing revenue, so Nine must diversify partners to avoid concentration risk.
Buyers tighten CPMs in 2024; cross-platform bundles defend yield
Buyers strengthened leverage in 2024 as agencies and programmatic channels push tougher CPMs, while Nine’s cross‑platform bundles protect yield against reallocating spend.
Stan faced churn risk with ~2.6m subs (2024) and low switching costs; smartphone penetration ~92% and Nine metro share ~24% dilute linear reach.
First‑party reach ~17m and exclusive live sport support premium CPMs; app‑store commissions 15–30% compress margins.
| Metric | 2024 |
|---|---|
| Stan subscribers | ~2.6m |
| Smartphone penetration | ~92% |
| Nine metro share | ~24% |
| First‑party reach | ~17m |
| App store fees | 15–30% |
Full Version Awaits
Nine Entertainment Porter's Five Forces Analysis
This preview shows the exact Nine Entertainment Porter’s Five Forces analysis you'll receive after purchase—no placeholders or edits. The document is fully formatted and ready for download the moment you buy. What you see here is the complete, final deliverable for immediate use.
Original: $10.00
-65%$10.00
$3.50Description
Don't Miss the Bigger Picture
Nine Entertainment faces intense digital disruption, high buyer power from advertisers, and growing substitute threats from streaming and social platforms, while supplier leverage and regulatory shifts add complexity. This snapshot highlights key pressures on margins and market share. Ready for a deep dive? Unlock the full Porter's Five Forces Analysis to access force-by-force ratings, visuals, and actionable strategy.
Suppliers Bargaining Power
Premium content rights holders
Major sports leagues, studios and international licensors wield concentrated control over premium rights, pushing costs higher; the global sports broadcasting rights market was estimated at about US$70bn in 2024. Nine’s dependence on marquee sports and premium shows narrows negotiation flexibility and raises exposure to price swings. Long-term exclusive contracts lock in audience reach but can cement high fees, while typical 3–4 year rights cycles produce periodic spikes and intense bidding pressure.
Creative talent and production houses
Star presenters, journalists and independent producers command significant premiums, and in 2024 their brand draw continues to concentrate bargaining power with Nine; top-tier talent often negotiates above-standard fees. Union rules and scarcity of elite creatives increase wage pressure and contractual rigidity. Vertical integration reduces some supplier exposure, but hit shows still rely on external creatives. Talent churn risks ratings volatility and higher retention spend.
Technology and distribution vendors
CDNs, ad-tech, cloud and broadcast equipment vendors are numerous but switching is complex due to compliance, sub-100ms latency targets and 99.99% uptime SLAs; Stan (≈2.5m subscribers in 2024) and broadcast operations face quasi-lock-in. Ad-tech consolidation (Google/Facebook ~60% of AU digital ad spend in 2024) can push take rates higher, while multi-vendor strategies cut vendor risk but raise integration costs.
Newsprint, printing, and distribution
Concentration of newsprint mills and contracting print facilities increases supplier bargaining power for Nine, while logistics bottlenecks and 2024 fuel-price volatility raised distribution costs, squeezing print margins even as digital revenue overtook print in 2024; continuing circulation declines reduce Nine’s scale leverage with print suppliers.
- Fewer print mills -> higher input power
- Fuel/logistics volatility -> rising distribution costs
- Digital > print in 2024 -> lower exposure
- Volume decline -> weaker supplier leverage
Music, archives, and IP licensing
Music libraries and archival footage owners exert strong supplier power: IFPI reported recorded music revenues of $29.2bn in 2023, enabling premium fees for evergreen content. Fragmented rights force cumulative licensing; blanket deals lower friction but not cost growth. Compliance and takedown risks add leverage to rights holders.
- Premium pricing: IFPI 2023 $29.2bn
- Fragmentation: cumulative licenses
- Blanket licenses: lower friction, persistent cost
- Risk: takedowns/compliance = bargaining leverage
Concentrated rights, ad-tech dominance and supply shocks squeeze media margins
Concentrated sports/studio licensors and top talent push up rights and wage costs—global sports rights ≈ US$70bn (2024) and Stan ≈2.5m subscribers (2024) reduce Nine’s leverage. Ad-tech concentration (Google/Facebook ~60% AU digital ad spend, 2024) and CDN/tech switching complexity raise operating costs and vendor lock-in. Print supply consolidation and fuel volatility squeeze margins while music/IP fees remain persistent (IFPI recorded music $29.2bn, 2023).
| Supplier | Key 2023/24 metric |
|---|---|
| Sports rights | US$70bn (2024) |
| Streaming subs | Stan ≈2.5m (2024) |
| Ad-tech share AU | Google/Facebook ~60% (2024) |
| Recorded music | $29.2bn (IFPI 2023) |
What is included in the product
Detailed Word Document
Tailored Porter's Five Forces analysis for Nine Entertainment that uncovers key drivers of competition, buyer and supplier power, entry barriers and substitutes, and identifies disruptive threats and strategic levers shaping its market position.
Customizable Excel Spreadsheet
A concise Porter's Five Forces snapshot for Nine Entertainment—clarifies competitive pressures and revenue risks for faster, board-ready decisions. Swap inputs, update scenarios, and export a clean visual to slides without complex tools.
Customers Bargaining Power
Advertisers and media agencies
Large agencies aggregate client budgets and secure tougher CPM and sponsorship terms, while Nine’s cross-platform bundles (linear plus streaming) protect yield though buyers increasingly reallocate spend to digital and social; in 2024 measurement demands and brand-safety constraints strengthened buyer leverage, and economic cycles amplified pricing sensitivity and campaign cancellations.
SVOD subscribers (Stan)
SVOD subscribers (Stan) face low switching costs to Netflix, Disney+ and others, increasing churn risk; Stan reported about 2.6 million subscribers in 2024, highlighting a competitive battleground. Price hikes encounter immediate elasticity tests given abundant alternatives, while exclusive content pockets reduce buyer power but demand heavy investment. Bundles and annual plans modestly raise switching frictions.
Audiences for FTA and radio
Viewers and listeners pay with attention, not cash and can switch instantly; with smartphone penetration ~92% in Australia (2024) competing platforms fragment time and dilute Nine’s FTA reach (Nine’s metro audience share ~24% in 2024). Local news and live sport still partially anchor loyalty, while UX quality and 9Now app performance directly affect retention and ad monetisation.
Corporate and SME advertisers (direct)
Corporate and SME advertisers exert moderate bargaining power: individual SMEs have limited leverage but collectively shape inventory mix, while self-serve platforms and programmatic options outside Nine increase alternatives and price sensitivity. Performance demands in 2024 push attribution and lower-funnel pricing, but Nine’s first-party data and ~17 million monthly Australian reach can justify premium CPMs where targeting measurably lifts ROI.
- Collective SME influence on inventory
- Self-serve/programmatic alternatives
- 2024: stronger attribution pressure
- First-party data enables premium pricing
Enterprise partnerships and affiliates
Enterprise partnerships—distribution partners, device ecosystems and telcos—can demand prominent placement and revenue shares, shifting bargaining power to customers; app store and billing integrations carry commission costs (Apple/Google tiers 15%–30% in 2024). Prominent app-store positioning and billing bring visibility but reduce margins; co-marketing expands reach while sharing revenue, so Nine must diversify partners to avoid concentration risk.
Buyers tighten CPMs in 2024; cross-platform bundles defend yield
Buyers strengthened leverage in 2024 as agencies and programmatic channels push tougher CPMs, while Nine’s cross‑platform bundles protect yield against reallocating spend.
Stan faced churn risk with ~2.6m subs (2024) and low switching costs; smartphone penetration ~92% and Nine metro share ~24% dilute linear reach.
First‑party reach ~17m and exclusive live sport support premium CPMs; app‑store commissions 15–30% compress margins.
| Metric | 2024 |
|---|---|
| Stan subscribers | ~2.6m |
| Smartphone penetration | ~92% |
| Nine metro share | ~24% |
| First‑party reach | ~17m |
| App store fees | 15–30% |
Full Version Awaits
Nine Entertainment Porter's Five Forces Analysis
This preview shows the exact Nine Entertainment Porter’s Five Forces analysis you'll receive after purchase—no placeholders or edits. The document is fully formatted and ready for download the moment you buy. What you see here is the complete, final deliverable for immediate use.











