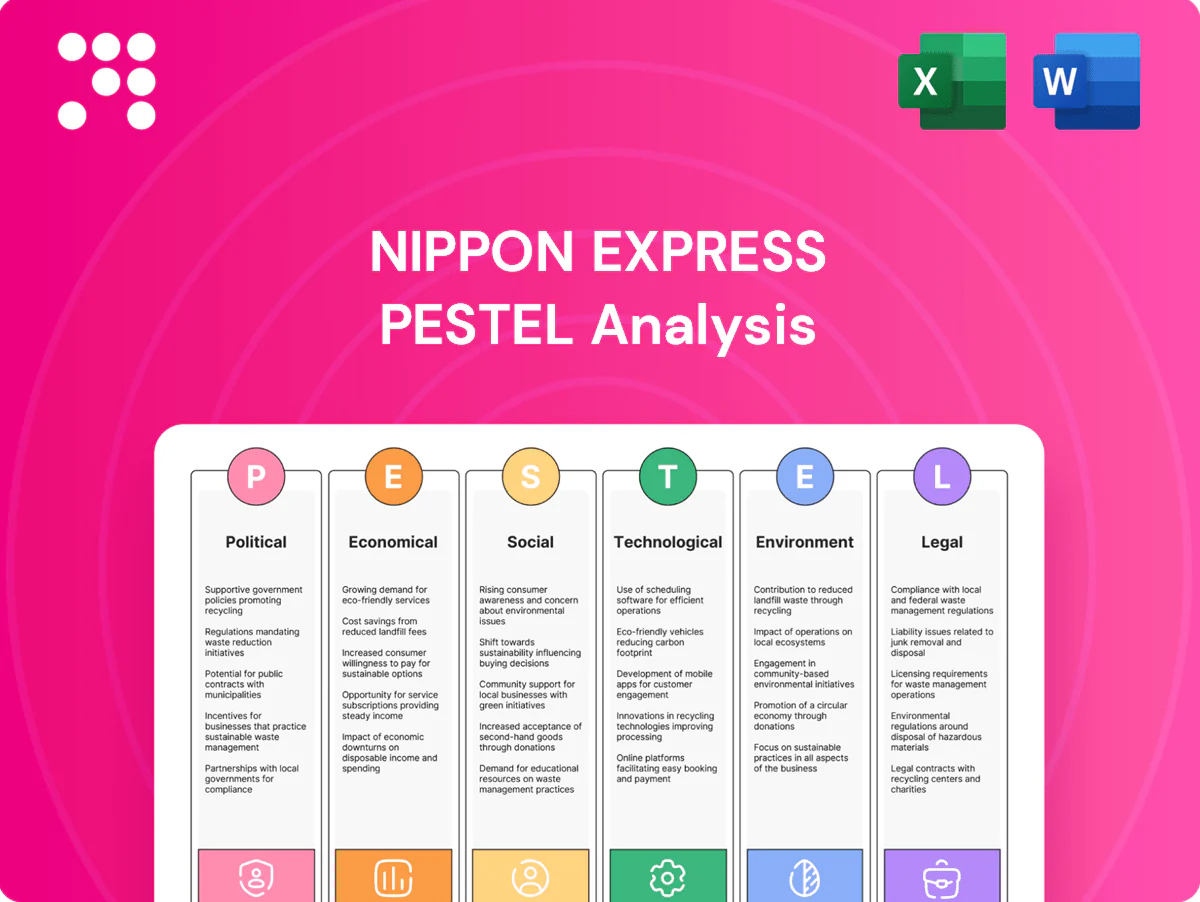
Nippon Express PESTLE Analysis

Plan Smarter. Present Sharper. Compete Stronger.
Gain a competitive edge with our PESTLE analysis of Nippon Express. We unpack political, economic, social, technological, legal and environmental forces shaping logistics strategies. Ready-made and actionable for investors, consultants, and planners. Buy the full report for the complete, up-to-date breakdown.
Political factors

Trade policy volatility and tariffs
Shifts in trade agreements, tariffs and customs procedures directly alter cross-border freight flows and costs, with US Section 301 measures affecting roughly $370 billion of Chinese goods since 2018 and continuing to reroute volumes. Changes in US-China and EU-Japan dynamics can compress margins and force network rerouting. Nippon Express must adjust routing, pricing and brokerage and prioritize proactive policy monitoring and scenario-based capacity allocation.
Geopolitical tensions and sanctions
Conflicts, sanctions, and export controls disrupt lanes, raise insurance and compliance costs, and have complicated Black Sea and Russia-related logistics since 2022; US semiconductor export controls were notably expanded in 2023, tightening shipments to China. Sensitive sectors like semiconductors and dual-use goods now require stricter screening and layered documentation. Nippon Express must bolster denied-party screening, diversify corridors and build contingency networks and supplier redundancy to mitigate sudden lane closures.

Public infrastructure investment
Government upgrades to ports, airports, rail and roads directly change throughput and dwell times, enabling faster lane turnarounds; Nippon Express, with consolidated revenue of about ¥2.28 trillion in FY2024, can monetize higher velocity and lower unit costs. Improved infrastructure reduces operating costs and enables new multimodal services and co‑location near upgraded hubs to win market share. Policy-driven green corridor targets (Japan’s 46% CO2 reduction by 2030 pledge) may push mode mix toward rail and coastal shipping.

Customs modernization and facilitation
- Single-window: 120+ economies
- AEO: 110+ jurisdictions
- Digital cuts: up to 60% faster clearance
- Opportunity: upsell compliance via brokerage
- Risk: persistent harmonization gaps
Industrial policy and incentives
Industrial policy and incentives for reshoring, strategic industries and clean-tech are increasing network demand, creating greenfield logistics opportunities as new manufacturing clusters emerge.
Nippon Express can align facilities and contract logistics with designated incentive zones to capture value-added services while meeting policy strings on local content and workforce training commitments.
- Reshoring incentives drive demand for regional hubs
- Clean-tech policies create specialized logistics needs
- Incentive zones favor contract logistics and value-added services
- Local content and training mandates require compliance
Trade shocks, export controls push rerouting, pricing and compliance; digital customs unlock upsell
Trade policy shifts (US Section 301: ~$370bn exposed since 2018) and US‑China/EU‑Japan tensions force routing and margin adjustments; Nippon Express (consolidated revenue ¥2.28tn FY2024) must price and allocate capacity proactively. Sanctions/export controls (semiconductor controls expanded 2023) raise compliance costs and require denied‑party screening. Infrastructure upgrades and digital customs (single‑window 120+ economies; AEO 110+) speed throughput and create upsell opportunities.
| Metric | Value |
|---|---|
| Revenue FY2024 | ¥2.28tn |
| Single‑window | 120+ economies |
| AEO | 110+ jurisdictions |
| US Section 301 impact | $370bn |
| Japan CO2 pledge | 46% by 2030 |
What is included in the product
 Detailed Word Document
Explores how macro-environmental factors uniquely affect Nippon Express across Political, Economic, Social, Technological, Environmental and Legal dimensions, with data-backed trends and specific subpoints; designed for executives and investors to identify risks, opportunities and support scenario-driven strategy and funding decisions.

 Customizable Excel Spreadsheet
A concise, visually segmented PESTLE summary of Nippon Express that’s easily dropped into presentations, editable for region or business-line specifics, and ideal for quick alignment across teams during risk and market-positioning discussions.
Economic factors

Global trade cycle sensitivity
Freight volumes closely track industrial production and retail demand, with global merchandise trade recovering about 3% in 2024 after weak 2023, compressing yields and load factors during downturns and straining capacity on recoveries. Nippon Express, operating in over 40 countries with a global network of ~700 offices, must balance fixed assets with flexible chartering and 3PL partnerships. Diversification across sectors and regions smooths earnings volatility.
Fuel and energy price volatility
Bunker (Rotterdam 380cst ~520 USD/mt in 2024), jet fuel (~950 USD/mt) and diesel (global avg ~1.20 USD/L in 2024) swings drove sharp linehaul and air/ocean surcharges, pressuring margins; index-linked surcharges remain common. Fuel hedging and index-linked contracts helped stabilize cashflow volatility. Mode shifts toward sea/rail and network consolidation offset short-term spikes. Energy-efficiency investments cut long-run exposure.

Currency fluctuations
Multi-currency revenues and costs expose Nippon Express—a group with roughly JPY 2 trillion annual sales and over 40% generated overseas—to FX swings that can materially alter margins. Yen strength reduces export competitiveness and creates negative translation effects on consolidated results, while yen weakness can lift overseas profits; USD/JPY traded broadly in the JPY 140–160 range in 2023–2025. The company employs natural hedges, forward contracts and other derivatives per its risk-management policy and uses pricing clauses and regional invoicing to protect unit economics.

Inflation and interest rates
Inflation (Japan CPI ~3% in 2024) lifts labor, warehousing and equipment costs while squeezing customer budgets; higher global and domestic rates (10y JGB ~0.7% and short-term ~0.1% in 2024–25) raise financing costs for Nippon Express fleet, facilities and M&A. Disciplined capital allocation, dynamic pricing and productivity programs plus automation are required to defend margins and preserve ROIC.
- Inflation: Japan CPI ~3% (2024)
- Rates: 10y JGB ~0.7%, short-term ~0.1% (2024–25)
- Actions: disciplined capex, dynamic pricing, automation
Supply chain reconfiguration
Supply chain reconfiguration via nearshoring and China+1 is shifting lane structures toward intra-Asia and regional corridors, boosting demand for intra-Asia services and multi-node networks that Nippon Express can design. Inventory rebalancing increases warehousing and value-added services, where Nippon Express can offer cross-border e-commerce fulfilment and bonded solutions. Strategic joint ventures and alliances accelerate entry into new corridors and last-mile capability expansion.
- Nearshoring/China+1: regional lane growth
- Inventory rebalance: warehousing & VAS demand
- Opportunity: multi-node networks, cross-border e-commerce
- Go-to-market: strategic JVs/alliances
Trade shocks, export controls push rerouting, pricing and compliance; digital customs unlock upsell
Global freight recovery (~+3% 2024) and nearshoring boost intra-Asia lanes, lifting volumes but compressing yields in downturns. Fuel (bunker ~520 USD/mt 2024) and FX (USD/JPY 140–160 in 2023–25) drive surcharge volatility and margin pressure. Nippon Express (≈JPY 2 trillion sales, >40% overseas) offsets with hedging, dynamic pricing and automation.
| Metric | Value |
|---|---|
| Sales | ≈JPY 2T |
| Overseas rev | >40% |
| Japan CPI (2024) | ≈3% |
| Bunker (2024) | ~520 USD/mt |
| USD/JPY (2023–25) | 140–160 |
| 10y JGB (2024) | ~0.7% |
Full Version Awaits
Nippon Express PESTLE Analysis
This Nippon Express PESTLE Analysis preview is the exact document you’ll receive after purchase—fully formatted, professionally structured, and ready to use. The layout, content, and structure shown here match the final downloadable file. No placeholders or surprises—what you see is what you’ll own.

Plan Smarter. Present Sharper. Compete Stronger.
Gain a competitive edge with our PESTLE analysis of Nippon Express. We unpack political, economic, social, technological, legal and environmental forces shaping logistics strategies. Ready-made and actionable for investors, consultants, and planners. Buy the full report for the complete, up-to-date breakdown.
Political factors
Trade policy volatility and tariffs
Shifts in trade agreements, tariffs and customs procedures directly alter cross-border freight flows and costs, with US Section 301 measures affecting roughly $370 billion of Chinese goods since 2018 and continuing to reroute volumes. Changes in US-China and EU-Japan dynamics can compress margins and force network rerouting. Nippon Express must adjust routing, pricing and brokerage and prioritize proactive policy monitoring and scenario-based capacity allocation.
Geopolitical tensions and sanctions
Conflicts, sanctions, and export controls disrupt lanes, raise insurance and compliance costs, and have complicated Black Sea and Russia-related logistics since 2022; US semiconductor export controls were notably expanded in 2023, tightening shipments to China. Sensitive sectors like semiconductors and dual-use goods now require stricter screening and layered documentation. Nippon Express must bolster denied-party screening, diversify corridors and build contingency networks and supplier redundancy to mitigate sudden lane closures.
Public infrastructure investment
Government upgrades to ports, airports, rail and roads directly change throughput and dwell times, enabling faster lane turnarounds; Nippon Express, with consolidated revenue of about ¥2.28 trillion in FY2024, can monetize higher velocity and lower unit costs. Improved infrastructure reduces operating costs and enables new multimodal services and co‑location near upgraded hubs to win market share. Policy-driven green corridor targets (Japan’s 46% CO2 reduction by 2030 pledge) may push mode mix toward rail and coastal shipping.
Customs modernization and facilitation
- Single-window: 120+ economies
- AEO: 110+ jurisdictions
- Digital cuts: up to 60% faster clearance
- Opportunity: upsell compliance via brokerage
- Risk: persistent harmonization gaps
Industrial policy and incentives
Industrial policy and incentives for reshoring, strategic industries and clean-tech are increasing network demand, creating greenfield logistics opportunities as new manufacturing clusters emerge.
Nippon Express can align facilities and contract logistics with designated incentive zones to capture value-added services while meeting policy strings on local content and workforce training commitments.
- Reshoring incentives drive demand for regional hubs
- Clean-tech policies create specialized logistics needs
- Incentive zones favor contract logistics and value-added services
- Local content and training mandates require compliance
Trade shocks, export controls push rerouting, pricing and compliance; digital customs unlock upsell
Trade policy shifts (US Section 301: ~$370bn exposed since 2018) and US‑China/EU‑Japan tensions force routing and margin adjustments; Nippon Express (consolidated revenue ¥2.28tn FY2024) must price and allocate capacity proactively. Sanctions/export controls (semiconductor controls expanded 2023) raise compliance costs and require denied‑party screening. Infrastructure upgrades and digital customs (single‑window 120+ economies; AEO 110+) speed throughput and create upsell opportunities.
| Metric | Value |
|---|---|
| Revenue FY2024 | ¥2.28tn |
| Single‑window | 120+ economies |
| AEO | 110+ jurisdictions |
| US Section 301 impact | $370bn |
| Japan CO2 pledge | 46% by 2030 |
What is included in the product
Detailed Word Document
Explores how macro-environmental factors uniquely affect Nippon Express across Political, Economic, Social, Technological, Environmental and Legal dimensions, with data-backed trends and specific subpoints; designed for executives and investors to identify risks, opportunities and support scenario-driven strategy and funding decisions.
Customizable Excel Spreadsheet
A concise, visually segmented PESTLE summary of Nippon Express that’s easily dropped into presentations, editable for region or business-line specifics, and ideal for quick alignment across teams during risk and market-positioning discussions.
Economic factors
Global trade cycle sensitivity
Freight volumes closely track industrial production and retail demand, with global merchandise trade recovering about 3% in 2024 after weak 2023, compressing yields and load factors during downturns and straining capacity on recoveries. Nippon Express, operating in over 40 countries with a global network of ~700 offices, must balance fixed assets with flexible chartering and 3PL partnerships. Diversification across sectors and regions smooths earnings volatility.
Fuel and energy price volatility
Bunker (Rotterdam 380cst ~520 USD/mt in 2024), jet fuel (~950 USD/mt) and diesel (global avg ~1.20 USD/L in 2024) swings drove sharp linehaul and air/ocean surcharges, pressuring margins; index-linked surcharges remain common. Fuel hedging and index-linked contracts helped stabilize cashflow volatility. Mode shifts toward sea/rail and network consolidation offset short-term spikes. Energy-efficiency investments cut long-run exposure.
Currency fluctuations
Multi-currency revenues and costs expose Nippon Express—a group with roughly JPY 2 trillion annual sales and over 40% generated overseas—to FX swings that can materially alter margins. Yen strength reduces export competitiveness and creates negative translation effects on consolidated results, while yen weakness can lift overseas profits; USD/JPY traded broadly in the JPY 140–160 range in 2023–2025. The company employs natural hedges, forward contracts and other derivatives per its risk-management policy and uses pricing clauses and regional invoicing to protect unit economics.
Inflation and interest rates
Inflation (Japan CPI ~3% in 2024) lifts labor, warehousing and equipment costs while squeezing customer budgets; higher global and domestic rates (10y JGB ~0.7% and short-term ~0.1% in 2024–25) raise financing costs for Nippon Express fleet, facilities and M&A. Disciplined capital allocation, dynamic pricing and productivity programs plus automation are required to defend margins and preserve ROIC.
- Inflation: Japan CPI ~3% (2024)
- Rates: 10y JGB ~0.7%, short-term ~0.1% (2024–25)
- Actions: disciplined capex, dynamic pricing, automation
Supply chain reconfiguration
Supply chain reconfiguration via nearshoring and China+1 is shifting lane structures toward intra-Asia and regional corridors, boosting demand for intra-Asia services and multi-node networks that Nippon Express can design. Inventory rebalancing increases warehousing and value-added services, where Nippon Express can offer cross-border e-commerce fulfilment and bonded solutions. Strategic joint ventures and alliances accelerate entry into new corridors and last-mile capability expansion.
- Nearshoring/China+1: regional lane growth
- Inventory rebalance: warehousing & VAS demand
- Opportunity: multi-node networks, cross-border e-commerce
- Go-to-market: strategic JVs/alliances
Trade shocks, export controls push rerouting, pricing and compliance; digital customs unlock upsell
Global freight recovery (~+3% 2024) and nearshoring boost intra-Asia lanes, lifting volumes but compressing yields in downturns. Fuel (bunker ~520 USD/mt 2024) and FX (USD/JPY 140–160 in 2023–25) drive surcharge volatility and margin pressure. Nippon Express (≈JPY 2 trillion sales, >40% overseas) offsets with hedging, dynamic pricing and automation.
| Metric | Value |
|---|---|
| Sales | ≈JPY 2T |
| Overseas rev | >40% |
| Japan CPI (2024) | ≈3% |
| Bunker (2024) | ~520 USD/mt |
| USD/JPY (2023–25) | 140–160 |
| 10y JGB (2024) | ~0.7% |
Full Version Awaits
Nippon Express PESTLE Analysis
This Nippon Express PESTLE Analysis preview is the exact document you’ll receive after purchase—fully formatted, professionally structured, and ready to use. The layout, content, and structure shown here match the final downloadable file. No placeholders or surprises—what you see is what you’ll own.
Original: $10.00
-65%$10.00
$3.50Description
Plan Smarter. Present Sharper. Compete Stronger.
Gain a competitive edge with our PESTLE analysis of Nippon Express. We unpack political, economic, social, technological, legal and environmental forces shaping logistics strategies. Ready-made and actionable for investors, consultants, and planners. Buy the full report for the complete, up-to-date breakdown.
Political factors
Trade policy volatility and tariffs
Shifts in trade agreements, tariffs and customs procedures directly alter cross-border freight flows and costs, with US Section 301 measures affecting roughly $370 billion of Chinese goods since 2018 and continuing to reroute volumes. Changes in US-China and EU-Japan dynamics can compress margins and force network rerouting. Nippon Express must adjust routing, pricing and brokerage and prioritize proactive policy monitoring and scenario-based capacity allocation.
Geopolitical tensions and sanctions
Conflicts, sanctions, and export controls disrupt lanes, raise insurance and compliance costs, and have complicated Black Sea and Russia-related logistics since 2022; US semiconductor export controls were notably expanded in 2023, tightening shipments to China. Sensitive sectors like semiconductors and dual-use goods now require stricter screening and layered documentation. Nippon Express must bolster denied-party screening, diversify corridors and build contingency networks and supplier redundancy to mitigate sudden lane closures.
Public infrastructure investment
Government upgrades to ports, airports, rail and roads directly change throughput and dwell times, enabling faster lane turnarounds; Nippon Express, with consolidated revenue of about ¥2.28 trillion in FY2024, can monetize higher velocity and lower unit costs. Improved infrastructure reduces operating costs and enables new multimodal services and co‑location near upgraded hubs to win market share. Policy-driven green corridor targets (Japan’s 46% CO2 reduction by 2030 pledge) may push mode mix toward rail and coastal shipping.
Customs modernization and facilitation
- Single-window: 120+ economies
- AEO: 110+ jurisdictions
- Digital cuts: up to 60% faster clearance
- Opportunity: upsell compliance via brokerage
- Risk: persistent harmonization gaps
Industrial policy and incentives
Industrial policy and incentives for reshoring, strategic industries and clean-tech are increasing network demand, creating greenfield logistics opportunities as new manufacturing clusters emerge.
Nippon Express can align facilities and contract logistics with designated incentive zones to capture value-added services while meeting policy strings on local content and workforce training commitments.
- Reshoring incentives drive demand for regional hubs
- Clean-tech policies create specialized logistics needs
- Incentive zones favor contract logistics and value-added services
- Local content and training mandates require compliance
Trade shocks, export controls push rerouting, pricing and compliance; digital customs unlock upsell
Trade policy shifts (US Section 301: ~$370bn exposed since 2018) and US‑China/EU‑Japan tensions force routing and margin adjustments; Nippon Express (consolidated revenue ¥2.28tn FY2024) must price and allocate capacity proactively. Sanctions/export controls (semiconductor controls expanded 2023) raise compliance costs and require denied‑party screening. Infrastructure upgrades and digital customs (single‑window 120+ economies; AEO 110+) speed throughput and create upsell opportunities.
| Metric | Value |
|---|---|
| Revenue FY2024 | ¥2.28tn |
| Single‑window | 120+ economies |
| AEO | 110+ jurisdictions |
| US Section 301 impact | $370bn |
| Japan CO2 pledge | 46% by 2030 |
What is included in the product
Detailed Word Document
Explores how macro-environmental factors uniquely affect Nippon Express across Political, Economic, Social, Technological, Environmental and Legal dimensions, with data-backed trends and specific subpoints; designed for executives and investors to identify risks, opportunities and support scenario-driven strategy and funding decisions.
Customizable Excel Spreadsheet
A concise, visually segmented PESTLE summary of Nippon Express that’s easily dropped into presentations, editable for region or business-line specifics, and ideal for quick alignment across teams during risk and market-positioning discussions.
Economic factors
Global trade cycle sensitivity
Freight volumes closely track industrial production and retail demand, with global merchandise trade recovering about 3% in 2024 after weak 2023, compressing yields and load factors during downturns and straining capacity on recoveries. Nippon Express, operating in over 40 countries with a global network of ~700 offices, must balance fixed assets with flexible chartering and 3PL partnerships. Diversification across sectors and regions smooths earnings volatility.
Fuel and energy price volatility
Bunker (Rotterdam 380cst ~520 USD/mt in 2024), jet fuel (~950 USD/mt) and diesel (global avg ~1.20 USD/L in 2024) swings drove sharp linehaul and air/ocean surcharges, pressuring margins; index-linked surcharges remain common. Fuel hedging and index-linked contracts helped stabilize cashflow volatility. Mode shifts toward sea/rail and network consolidation offset short-term spikes. Energy-efficiency investments cut long-run exposure.
Currency fluctuations
Multi-currency revenues and costs expose Nippon Express—a group with roughly JPY 2 trillion annual sales and over 40% generated overseas—to FX swings that can materially alter margins. Yen strength reduces export competitiveness and creates negative translation effects on consolidated results, while yen weakness can lift overseas profits; USD/JPY traded broadly in the JPY 140–160 range in 2023–2025. The company employs natural hedges, forward contracts and other derivatives per its risk-management policy and uses pricing clauses and regional invoicing to protect unit economics.
Inflation and interest rates
Inflation (Japan CPI ~3% in 2024) lifts labor, warehousing and equipment costs while squeezing customer budgets; higher global and domestic rates (10y JGB ~0.7% and short-term ~0.1% in 2024–25) raise financing costs for Nippon Express fleet, facilities and M&A. Disciplined capital allocation, dynamic pricing and productivity programs plus automation are required to defend margins and preserve ROIC.
- Inflation: Japan CPI ~3% (2024)
- Rates: 10y JGB ~0.7%, short-term ~0.1% (2024–25)
- Actions: disciplined capex, dynamic pricing, automation
Supply chain reconfiguration
Supply chain reconfiguration via nearshoring and China+1 is shifting lane structures toward intra-Asia and regional corridors, boosting demand for intra-Asia services and multi-node networks that Nippon Express can design. Inventory rebalancing increases warehousing and value-added services, where Nippon Express can offer cross-border e-commerce fulfilment and bonded solutions. Strategic joint ventures and alliances accelerate entry into new corridors and last-mile capability expansion.
- Nearshoring/China+1: regional lane growth
- Inventory rebalance: warehousing & VAS demand
- Opportunity: multi-node networks, cross-border e-commerce
- Go-to-market: strategic JVs/alliances
Trade shocks, export controls push rerouting, pricing and compliance; digital customs unlock upsell
Global freight recovery (~+3% 2024) and nearshoring boost intra-Asia lanes, lifting volumes but compressing yields in downturns. Fuel (bunker ~520 USD/mt 2024) and FX (USD/JPY 140–160 in 2023–25) drive surcharge volatility and margin pressure. Nippon Express (≈JPY 2 trillion sales, >40% overseas) offsets with hedging, dynamic pricing and automation.
| Metric | Value |
|---|---|
| Sales | ≈JPY 2T |
| Overseas rev | >40% |
| Japan CPI (2024) | ≈3% |
| Bunker (2024) | ~520 USD/mt |
| USD/JPY (2023–25) | 140–160 |
| 10y JGB (2024) | ~0.7% |
Full Version Awaits
Nippon Express PESTLE Analysis
This Nippon Express PESTLE Analysis preview is the exact document you’ll receive after purchase—fully formatted, professionally structured, and ready to use. The layout, content, and structure shown here match the final downloadable file. No placeholders or surprises—what you see is what you’ll own.











