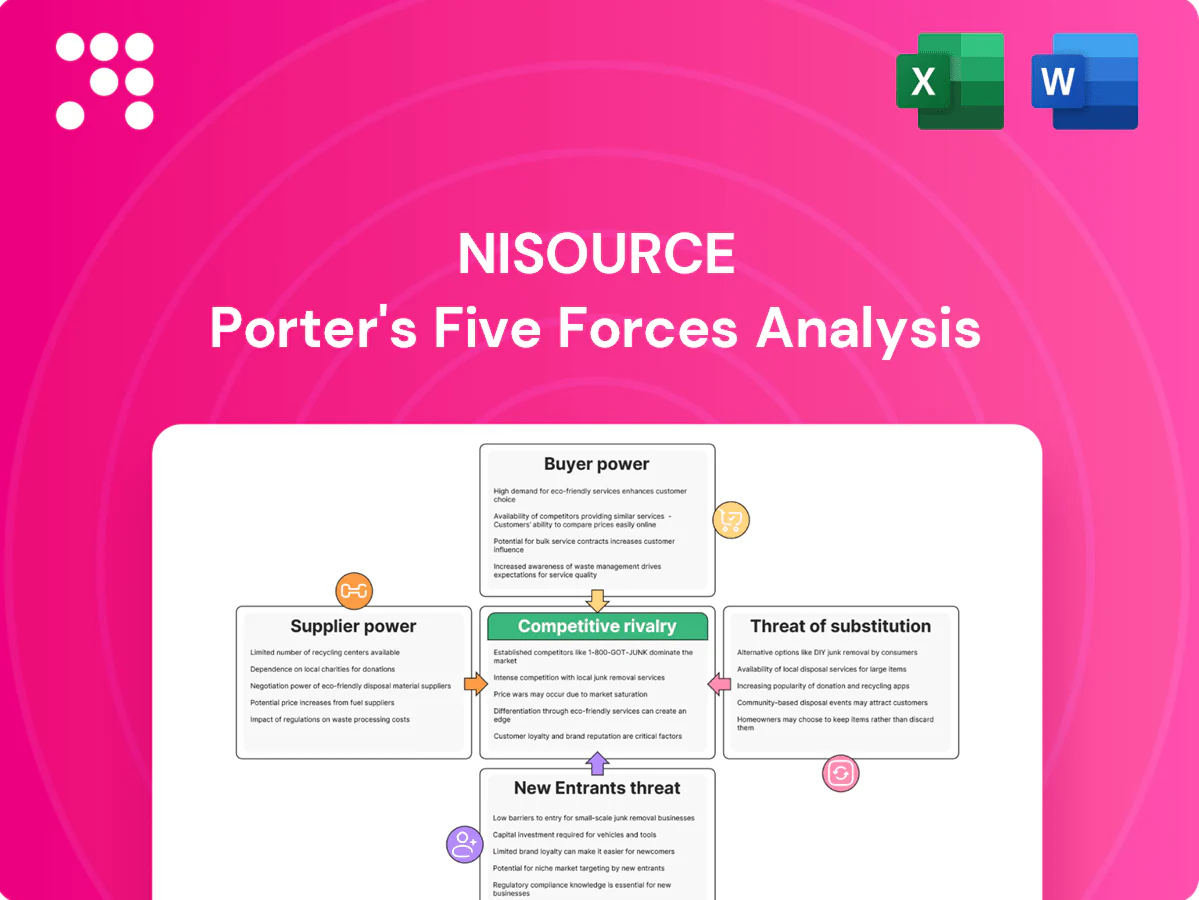
NiSource Porter's Five Forces Analysis

Don't Miss the Bigger Picture
NiSource faces high regulatory barriers and capital intensity that limit new entrants, while supplier power is moderate and buyer power remains muted by necessity-based demand; substitutes and competitive rivalry are subdued but evolving with renewables and tech. This brief snapshot only scratches the surface. Unlock the full Porter's Five Forces Analysis to explore NiSource’s competitive dynamics in detail.
Suppliers Bargaining Power

Concentrated fuel and pipeline providers
NiSource depends on a limited set of natural gas producers and interstate pipeline operators, concentrating supply and exposing the company to seasonal capacity tightness and basis volatility, particularly in winter 2024. Seasonal constraints have pushed basis differentials above typical levels, increasing transport fees, though fuel and transport costs are largely recovered through regulatory riders (near 100% passthrough). Storage, hedging and diversified contract arrangements further mitigate supplier leverage and price exposure.
Specialized equipment OEMs
Meters, compressors, transformers and grid automation gear for NiSource come from a handful of qualified OEMs, with lead times often reported at 12–18 months, concentrating pricing power and creating schedule risk. This supplier concentration can elevate input costs, though framework agreements and bulk procurement have been used to temper price volatility. Regulatory frameworks in 2024 continue to support recovery of prudent capex, mitigating some cost exposure.

Labor and skilled contractors
Union labor (US union density ~10% in 2024) and specialized welders—AWS estimated a roughly 400,000 welder shortfall by 2024—are essential for safety-critical NiSource work, creating wage premiums (often 15%+ for certified trades). Tight labor markets and certification rules raise availability risk and costs, while multi-year labor agreements give predictability but limit flexibility; workforce development and in-house training reduce supplier dependency.

Capital providers and interest rates
Capital providers—debt and equity markets—are primary suppliers for utilities like NiSource; rising interest rates (10-year U.S. Treasury averaged about 4.2% in 2024) increase financing costs.
Regulated allowed returns and cost trackers generally enable recovery over time, keeping supplier leverage moderate; NiSource’s investment-grade ratings (S&P BBB, Moody’s Baa2 in 2024) and constructive regulation support access and pricing.
- Debt/equity are key suppliers
- 10-yr Treasury ~4.2% (2024)
- S&P BBB, Moody’s Baa2 (2024)
- Stable cash flows & cost trackers → moderate supplier power
IT/OT and cybersecurity vendors
Advanced metering, SCADA and cybersecurity solutions for utilities come from a small pool of certified providers—typically fewer than 10—so supplier leverage is high. Integration and compliance lift switching costs, and long-term service contracts (commonly 5–10 years) can entrench vendor power. Standardization and competitive RFPs help contain it.
- Few certified vendors (≈<10)
- Switching adds integration/compliance costs
- Contracts often 5–10 years; RFPs reduce risk
Moderate supplier power: ~100% pass-through, vendors <10, 10-yr Treasury ~4.2%
Supplier power is moderate: fuel and transport costs largely (~100%) passed through, limiting price exposure despite concentrated gas/pipeline sources and winter 2024 basis volatility. Critical equipment and AMI/SCADA vendors (<10) and skilled trades (≈400,000 welder shortfall; union density ~10%) raise switching/time risk. Financing costs rose with 10‑yr Treasury ~4.2% and ratings S&P BBB/Moody’s Baa2.
| Metric | 2024 |
|---|---|
| Pass-through | ~100% |
| Vendors (AMI/SCADA) | <10 |
| Welder shortfall | ≈400,000 |
| Union density | ~10% |
| 10-yr Treasury | ~4.2% |
| Ratings | S&P BBB / Baa2 |
What is included in the product
 Detailed Word Document
Tailored Porter's Five Forces analysis for NiSource that uncovers key drivers of competition, buyer and supplier influence, and market-entry risks, identifying disruptive threats and substitutes that could erode its market share while evaluating dynamics that protect incumbent profit margins.

 Customizable Excel Spreadsheet
A clear one-sheet NiSource Five Forces summary with customizable pressure levels and instant radar visuals—clean, copy-ready for decks, linkable to Excel dashboards, and simple enough for non-finance users to update as market conditions change.
Customers Bargaining Power

Fragmented residential base
NiSource serves over 4 million residential accounts, so individual customers have negligible bargaining power; bargaining is diffuse across a fragmented base. Energy delivery in franchise territories has few practical alternatives, making service essential and demand highly inelastic. Rates and price adjustments are set primarily by state regulators rather than end-users, constraining direct customer influence on pricing; NiSource reported about $6 billion in 2024 revenues.
Large commercial and industrial accounts
Large C&I accounts wield growing leverage: some switch to gas marketers or self-generation and collectively account for roughly one-third of NiSource’s throughput revenue, driving negotiations for volume discounts and customized rates; curtailable/interruptible contracts—often reducing bills by double-digit percentages for participants—add flexibility and bargaining power, yet NiSource’s monopoly delivery service to ~3.4 million gas customers remains regulated, capping concessions.

Regulators as proxy buyers
State commissions act as proxy buyers for NiSource, overseeing rates and service for roughly 3.5 million customers across seven states as of 2024. Commissions can disallow costs, defer recovery, or require affordability programs, directly constraining allowed revenues and capital recovery. This creates disciplined pricing and operational performance pressure. Constructive regulation aims to balance customer protections with fair utility returns.

Switching barriers and reliability needs
Customers prioritize reliability and safety, core focuses of NiSource’s operations, which limits short-term physical switching to alternatives and thereby constrains direct buyer power. High expectations for outage performance keep utilities accountable; customer satisfaction and outage metrics still influence regulatory reviews and rate cases. Regulatory penalties or incentives hinge on measured reliability outcomes and complaint rates.
- Reliability focus reduces buyer leverage
- Physical switching costly/impractical
- Satisfaction/outage metrics affect regulation
Energy efficiency and demand management
Energy efficiency and demand-management programs deployed by utilities and state initiatives have cut consumption and peak demand, strengthening customer leverage as lower usage reduces bills and exposes volume risk for NiSource, which serves about 3.6 million customers (2024). Decoupling mechanisms in roughly 20 states by 2024 mitigate revenue erosion, but sustained efficiency gains still pressure rate design, recovery of fixed capital and near-term capital plans.
- Lower consumption increases buyer leverage
- Decoupling offsets volume risk (~20 states, 2024)
- NiSource scale ~3.6M customers (2024)
- Persistent efficiency pressures rate design and capital recovery
~3.6M customers, $6B revenue: C&I ~33% and decoupling squeeze utility rates
NiSource's ~3.6M customers and ~$6B 2024 revenue diffuse retail bargaining power; state regulators set rates, limiting direct customer price influence. Large C&I (≈33% throughput revenue) exert growing leverage via alternative suppliers/self‑gen; energy efficiency and decoupling (~20 states) cut volumes and pressure rate design.
| Metric | Value (2024) |
|---|---|
| Customers | ~3.6M |
| Revenue | $6B |
| C&I share | ~33% |
| Decoupling states | ~20 |
What You See Is What You Get
NiSource Porter's Five Forces Analysis
This preview shows the exact NiSource Porter's Five Forces analysis you'll receive immediately after purchase—no placeholders or samples. The document is the full, professionally formatted report, ready to download and use the moment you buy. It delivers a clear assessment of competitive rivalry, supplier and buyer power, threats of entry and substitutes, and strategic implications.

Don't Miss the Bigger Picture
NiSource faces high regulatory barriers and capital intensity that limit new entrants, while supplier power is moderate and buyer power remains muted by necessity-based demand; substitutes and competitive rivalry are subdued but evolving with renewables and tech. This brief snapshot only scratches the surface. Unlock the full Porter's Five Forces Analysis to explore NiSource’s competitive dynamics in detail.
Suppliers Bargaining Power
Concentrated fuel and pipeline providers
NiSource depends on a limited set of natural gas producers and interstate pipeline operators, concentrating supply and exposing the company to seasonal capacity tightness and basis volatility, particularly in winter 2024. Seasonal constraints have pushed basis differentials above typical levels, increasing transport fees, though fuel and transport costs are largely recovered through regulatory riders (near 100% passthrough). Storage, hedging and diversified contract arrangements further mitigate supplier leverage and price exposure.
Specialized equipment OEMs
Meters, compressors, transformers and grid automation gear for NiSource come from a handful of qualified OEMs, with lead times often reported at 12–18 months, concentrating pricing power and creating schedule risk. This supplier concentration can elevate input costs, though framework agreements and bulk procurement have been used to temper price volatility. Regulatory frameworks in 2024 continue to support recovery of prudent capex, mitigating some cost exposure.
Labor and skilled contractors
Union labor (US union density ~10% in 2024) and specialized welders—AWS estimated a roughly 400,000 welder shortfall by 2024—are essential for safety-critical NiSource work, creating wage premiums (often 15%+ for certified trades). Tight labor markets and certification rules raise availability risk and costs, while multi-year labor agreements give predictability but limit flexibility; workforce development and in-house training reduce supplier dependency.
Capital providers and interest rates
Capital providers—debt and equity markets—are primary suppliers for utilities like NiSource; rising interest rates (10-year U.S. Treasury averaged about 4.2% in 2024) increase financing costs.
Regulated allowed returns and cost trackers generally enable recovery over time, keeping supplier leverage moderate; NiSource’s investment-grade ratings (S&P BBB, Moody’s Baa2 in 2024) and constructive regulation support access and pricing.
- Debt/equity are key suppliers
- 10-yr Treasury ~4.2% (2024)
- S&P BBB, Moody’s Baa2 (2024)
- Stable cash flows & cost trackers → moderate supplier power
IT/OT and cybersecurity vendors
Advanced metering, SCADA and cybersecurity solutions for utilities come from a small pool of certified providers—typically fewer than 10—so supplier leverage is high. Integration and compliance lift switching costs, and long-term service contracts (commonly 5–10 years) can entrench vendor power. Standardization and competitive RFPs help contain it.
- Few certified vendors (≈<10)
- Switching adds integration/compliance costs
- Contracts often 5–10 years; RFPs reduce risk
Moderate supplier power: ~100% pass-through, vendors <10, 10-yr Treasury ~4.2%
Supplier power is moderate: fuel and transport costs largely (~100%) passed through, limiting price exposure despite concentrated gas/pipeline sources and winter 2024 basis volatility. Critical equipment and AMI/SCADA vendors (<10) and skilled trades (≈400,000 welder shortfall; union density ~10%) raise switching/time risk. Financing costs rose with 10‑yr Treasury ~4.2% and ratings S&P BBB/Moody’s Baa2.
| Metric | 2024 |
|---|---|
| Pass-through | ~100% |
| Vendors (AMI/SCADA) | <10 |
| Welder shortfall | ≈400,000 |
| Union density | ~10% |
| 10-yr Treasury | ~4.2% |
| Ratings | S&P BBB / Baa2 |
What is included in the product
Detailed Word Document
Tailored Porter's Five Forces analysis for NiSource that uncovers key drivers of competition, buyer and supplier influence, and market-entry risks, identifying disruptive threats and substitutes that could erode its market share while evaluating dynamics that protect incumbent profit margins.
Customizable Excel Spreadsheet
A clear one-sheet NiSource Five Forces summary with customizable pressure levels and instant radar visuals—clean, copy-ready for decks, linkable to Excel dashboards, and simple enough for non-finance users to update as market conditions change.
Customers Bargaining Power
Fragmented residential base
NiSource serves over 4 million residential accounts, so individual customers have negligible bargaining power; bargaining is diffuse across a fragmented base. Energy delivery in franchise territories has few practical alternatives, making service essential and demand highly inelastic. Rates and price adjustments are set primarily by state regulators rather than end-users, constraining direct customer influence on pricing; NiSource reported about $6 billion in 2024 revenues.
Large commercial and industrial accounts
Large C&I accounts wield growing leverage: some switch to gas marketers or self-generation and collectively account for roughly one-third of NiSource’s throughput revenue, driving negotiations for volume discounts and customized rates; curtailable/interruptible contracts—often reducing bills by double-digit percentages for participants—add flexibility and bargaining power, yet NiSource’s monopoly delivery service to ~3.4 million gas customers remains regulated, capping concessions.
Regulators as proxy buyers
State commissions act as proxy buyers for NiSource, overseeing rates and service for roughly 3.5 million customers across seven states as of 2024. Commissions can disallow costs, defer recovery, or require affordability programs, directly constraining allowed revenues and capital recovery. This creates disciplined pricing and operational performance pressure. Constructive regulation aims to balance customer protections with fair utility returns.
Switching barriers and reliability needs
Customers prioritize reliability and safety, core focuses of NiSource’s operations, which limits short-term physical switching to alternatives and thereby constrains direct buyer power. High expectations for outage performance keep utilities accountable; customer satisfaction and outage metrics still influence regulatory reviews and rate cases. Regulatory penalties or incentives hinge on measured reliability outcomes and complaint rates.
- Reliability focus reduces buyer leverage
- Physical switching costly/impractical
- Satisfaction/outage metrics affect regulation
Energy efficiency and demand management
Energy efficiency and demand-management programs deployed by utilities and state initiatives have cut consumption and peak demand, strengthening customer leverage as lower usage reduces bills and exposes volume risk for NiSource, which serves about 3.6 million customers (2024). Decoupling mechanisms in roughly 20 states by 2024 mitigate revenue erosion, but sustained efficiency gains still pressure rate design, recovery of fixed capital and near-term capital plans.
- Lower consumption increases buyer leverage
- Decoupling offsets volume risk (~20 states, 2024)
- NiSource scale ~3.6M customers (2024)
- Persistent efficiency pressures rate design and capital recovery
~3.6M customers, $6B revenue: C&I ~33% and decoupling squeeze utility rates
NiSource's ~3.6M customers and ~$6B 2024 revenue diffuse retail bargaining power; state regulators set rates, limiting direct customer price influence. Large C&I (≈33% throughput revenue) exert growing leverage via alternative suppliers/self‑gen; energy efficiency and decoupling (~20 states) cut volumes and pressure rate design.
| Metric | Value (2024) |
|---|---|
| Customers | ~3.6M |
| Revenue | $6B |
| C&I share | ~33% |
| Decoupling states | ~20 |
What You See Is What You Get
NiSource Porter's Five Forces Analysis
This preview shows the exact NiSource Porter's Five Forces analysis you'll receive immediately after purchase—no placeholders or samples. The document is the full, professionally formatted report, ready to download and use the moment you buy. It delivers a clear assessment of competitive rivalry, supplier and buyer power, threats of entry and substitutes, and strategic implications.
Description
Don't Miss the Bigger Picture
NiSource faces high regulatory barriers and capital intensity that limit new entrants, while supplier power is moderate and buyer power remains muted by necessity-based demand; substitutes and competitive rivalry are subdued but evolving with renewables and tech. This brief snapshot only scratches the surface. Unlock the full Porter's Five Forces Analysis to explore NiSource’s competitive dynamics in detail.
Suppliers Bargaining Power
Concentrated fuel and pipeline providers
NiSource depends on a limited set of natural gas producers and interstate pipeline operators, concentrating supply and exposing the company to seasonal capacity tightness and basis volatility, particularly in winter 2024. Seasonal constraints have pushed basis differentials above typical levels, increasing transport fees, though fuel and transport costs are largely recovered through regulatory riders (near 100% passthrough). Storage, hedging and diversified contract arrangements further mitigate supplier leverage and price exposure.
Specialized equipment OEMs
Meters, compressors, transformers and grid automation gear for NiSource come from a handful of qualified OEMs, with lead times often reported at 12–18 months, concentrating pricing power and creating schedule risk. This supplier concentration can elevate input costs, though framework agreements and bulk procurement have been used to temper price volatility. Regulatory frameworks in 2024 continue to support recovery of prudent capex, mitigating some cost exposure.
Labor and skilled contractors
Union labor (US union density ~10% in 2024) and specialized welders—AWS estimated a roughly 400,000 welder shortfall by 2024—are essential for safety-critical NiSource work, creating wage premiums (often 15%+ for certified trades). Tight labor markets and certification rules raise availability risk and costs, while multi-year labor agreements give predictability but limit flexibility; workforce development and in-house training reduce supplier dependency.
Capital providers and interest rates
Capital providers—debt and equity markets—are primary suppliers for utilities like NiSource; rising interest rates (10-year U.S. Treasury averaged about 4.2% in 2024) increase financing costs.
Regulated allowed returns and cost trackers generally enable recovery over time, keeping supplier leverage moderate; NiSource’s investment-grade ratings (S&P BBB, Moody’s Baa2 in 2024) and constructive regulation support access and pricing.
- Debt/equity are key suppliers
- 10-yr Treasury ~4.2% (2024)
- S&P BBB, Moody’s Baa2 (2024)
- Stable cash flows & cost trackers → moderate supplier power
IT/OT and cybersecurity vendors
Advanced metering, SCADA and cybersecurity solutions for utilities come from a small pool of certified providers—typically fewer than 10—so supplier leverage is high. Integration and compliance lift switching costs, and long-term service contracts (commonly 5–10 years) can entrench vendor power. Standardization and competitive RFPs help contain it.
- Few certified vendors (≈<10)
- Switching adds integration/compliance costs
- Contracts often 5–10 years; RFPs reduce risk
Moderate supplier power: ~100% pass-through, vendors <10, 10-yr Treasury ~4.2%
Supplier power is moderate: fuel and transport costs largely (~100%) passed through, limiting price exposure despite concentrated gas/pipeline sources and winter 2024 basis volatility. Critical equipment and AMI/SCADA vendors (<10) and skilled trades (≈400,000 welder shortfall; union density ~10%) raise switching/time risk. Financing costs rose with 10‑yr Treasury ~4.2% and ratings S&P BBB/Moody’s Baa2.
| Metric | 2024 |
|---|---|
| Pass-through | ~100% |
| Vendors (AMI/SCADA) | <10 |
| Welder shortfall | ≈400,000 |
| Union density | ~10% |
| 10-yr Treasury | ~4.2% |
| Ratings | S&P BBB / Baa2 |
What is included in the product
Detailed Word Document
Tailored Porter's Five Forces analysis for NiSource that uncovers key drivers of competition, buyer and supplier influence, and market-entry risks, identifying disruptive threats and substitutes that could erode its market share while evaluating dynamics that protect incumbent profit margins.
Customizable Excel Spreadsheet
A clear one-sheet NiSource Five Forces summary with customizable pressure levels and instant radar visuals—clean, copy-ready for decks, linkable to Excel dashboards, and simple enough for non-finance users to update as market conditions change.
Customers Bargaining Power
Fragmented residential base
NiSource serves over 4 million residential accounts, so individual customers have negligible bargaining power; bargaining is diffuse across a fragmented base. Energy delivery in franchise territories has few practical alternatives, making service essential and demand highly inelastic. Rates and price adjustments are set primarily by state regulators rather than end-users, constraining direct customer influence on pricing; NiSource reported about $6 billion in 2024 revenues.
Large commercial and industrial accounts
Large C&I accounts wield growing leverage: some switch to gas marketers or self-generation and collectively account for roughly one-third of NiSource’s throughput revenue, driving negotiations for volume discounts and customized rates; curtailable/interruptible contracts—often reducing bills by double-digit percentages for participants—add flexibility and bargaining power, yet NiSource’s monopoly delivery service to ~3.4 million gas customers remains regulated, capping concessions.
Regulators as proxy buyers
State commissions act as proxy buyers for NiSource, overseeing rates and service for roughly 3.5 million customers across seven states as of 2024. Commissions can disallow costs, defer recovery, or require affordability programs, directly constraining allowed revenues and capital recovery. This creates disciplined pricing and operational performance pressure. Constructive regulation aims to balance customer protections with fair utility returns.
Switching barriers and reliability needs
Customers prioritize reliability and safety, core focuses of NiSource’s operations, which limits short-term physical switching to alternatives and thereby constrains direct buyer power. High expectations for outage performance keep utilities accountable; customer satisfaction and outage metrics still influence regulatory reviews and rate cases. Regulatory penalties or incentives hinge on measured reliability outcomes and complaint rates.
- Reliability focus reduces buyer leverage
- Physical switching costly/impractical
- Satisfaction/outage metrics affect regulation
Energy efficiency and demand management
Energy efficiency and demand-management programs deployed by utilities and state initiatives have cut consumption and peak demand, strengthening customer leverage as lower usage reduces bills and exposes volume risk for NiSource, which serves about 3.6 million customers (2024). Decoupling mechanisms in roughly 20 states by 2024 mitigate revenue erosion, but sustained efficiency gains still pressure rate design, recovery of fixed capital and near-term capital plans.
- Lower consumption increases buyer leverage
- Decoupling offsets volume risk (~20 states, 2024)
- NiSource scale ~3.6M customers (2024)
- Persistent efficiency pressures rate design and capital recovery
~3.6M customers, $6B revenue: C&I ~33% and decoupling squeeze utility rates
NiSource's ~3.6M customers and ~$6B 2024 revenue diffuse retail bargaining power; state regulators set rates, limiting direct customer price influence. Large C&I (≈33% throughput revenue) exert growing leverage via alternative suppliers/self‑gen; energy efficiency and decoupling (~20 states) cut volumes and pressure rate design.
| Metric | Value (2024) |
|---|---|
| Customers | ~3.6M |
| Revenue | $6B |
| C&I share | ~33% |
| Decoupling states | ~20 |
What You See Is What You Get
NiSource Porter's Five Forces Analysis
This preview shows the exact NiSource Porter's Five Forces analysis you'll receive immediately after purchase—no placeholders or samples. The document is the full, professionally formatted report, ready to download and use the moment you buy. It delivers a clear assessment of competitive rivalry, supplier and buyer power, threats of entry and substitutes, and strategic implications.











