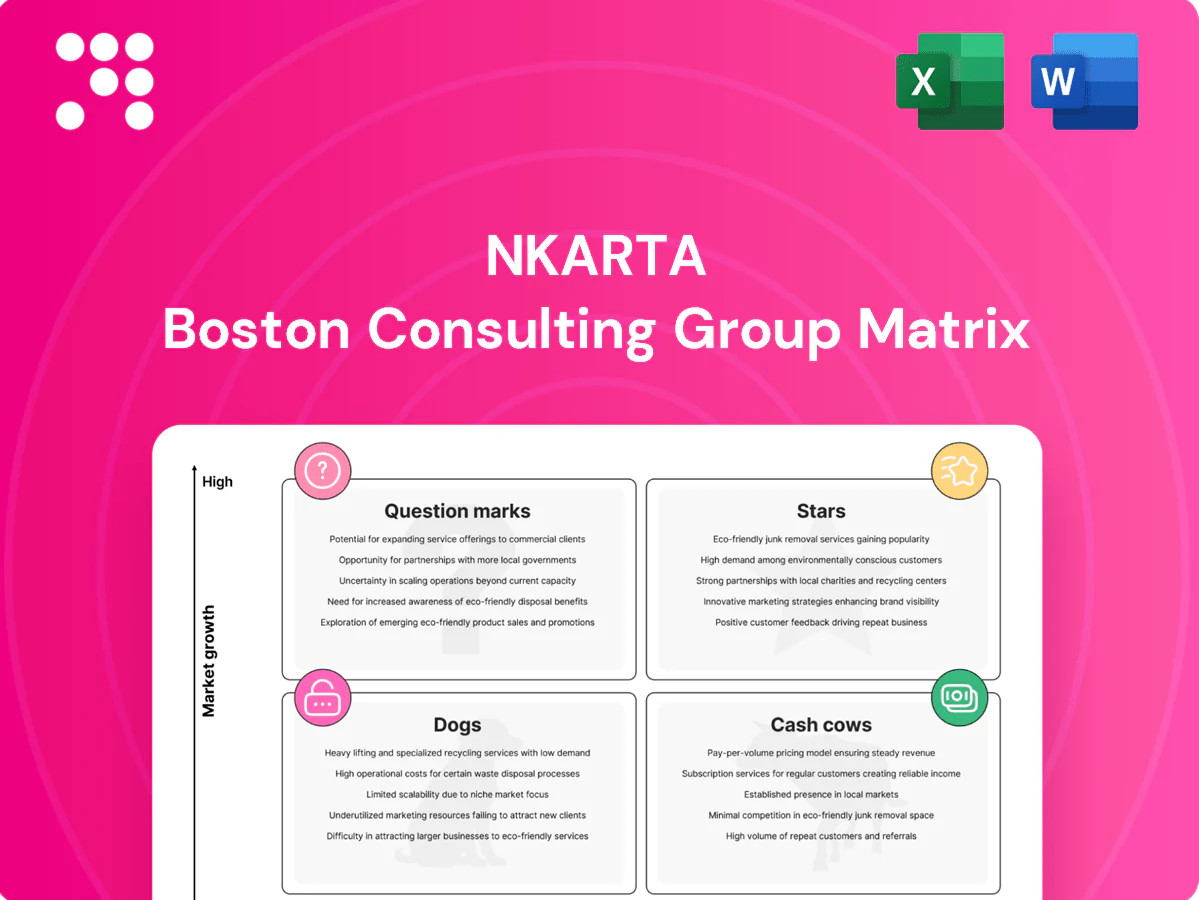
Nkarta Boston Consulting Group Matrix

Unlock Strategic Clarity
Want a straight answer on where Nkarta’s offerings sit—Stars, Cash Cows, Dogs or Question Marks? This preview scratches the surface; buy the full BCG Matrix to get quadrant-by-quadrant placement, data-backed recommendations, and a clear playbook for where to invest or cut. Instant download includes a polished Word report plus an actionable Excel summary so you can present and act fast.
Stars

Allogeneic NK platform leadership
The off-the-shelf NK cell platform sits in a fast-growing cell therapy market estimated at about $14 billion in 2024 with a projected CAGR near 20% to 2030. Nkarta’s engineered NK approach places it among a small set of visible leaders, gaining rising clinician and investor attention. It still needs sustained capital for clinical validation and scale-up. With continued momentum it can mature into a durable franchise.
Manufacturing know-how at scale
Consistent, scalable NK manufacturing is rare and valuable in a sprinting cell-therapy category; manufacturing often represents >50% of COGS for advanced cell therapies, so Nkarta’s process know-how is high-leverage. Owning process IP, QC systems and incremental yield gains builds practical market power and supply reliability. It burns cash now but anchors future margins; with targeted throughput lowering COGS by tens of percent, this can form a durable strategic moat.

Clinical proof-of-concept traction
Early clinical signals—ORRs around 20–40% in small NK cell cohorts reported across 2023–24 studies—are driving mindshare as payers and physicians seek safer, repeat-dosing platforms versus autologous CAR-T. Visibility has catalyzed partnerships and site activation, with deal structures in 2024 commonly including upfronts plus up to mid-single-digit to >$500M milestone pools. The catch: each new cohort or combo adds incremental Phase 1–2 spend (commonly $2–8M), but share of voice rises as the NK field expands.

Partnerable combo ecosystem
NK plays well with antibodies, cytokines and checkpoints—exactly where pharma is investing; combo optionality expands paths to pivotal trials and label breadth, though multi-arm studies raise clinical spend. In 2024 immuno-oncology combos dominated late-phase activity, giving Nkarta multiple shots on goal; securing a marquee partner combo would cement category leadership and de-risk commercialization.
- Partnerable ecosystem
- Combo optionality = more pivotal paths
- High cash burn for trials
- Marquee combo = leadership
First-mover advantage in off-the-shelf access
Ready-when-needed off-the-shelf NK therapy closes a logistics gap that causes ≈30% of intended autologous CAR-T patients to never be infused; time-to-infusion falls from 3–6 weeks to 1–3 days. Speed is a key differentiator in heme malignancies and will matter for solid tumors; being early shapes standards of care and contracts, and maintaining availability plus favorable reimbursement compounds this star.
- Speed: 1–3 days vs 3–6 weeks
- Access loss: ≈30% of autologous candidates
- Reimbursement: list prices ~$373k–$475k (2024)
Allogeneic NK: $14B, ~20% CAGR, 20–40% ORR
Nkarta sits in a $14B (2024) cell‑therapy market with ~20% CAGR to 2030; early ORRs 20–40% (2023–24) boost visibility but require sustained capital for pivotal trials. Scalable NK manufacturing (COGS often >50%) and 1–3 day infusion vs 3–6 weeks for CAR‑T are durable advantages. Reimbursement range ~$373k–$475k (2024).
| Metric | 2024 |
|---|---|
| Market size | $14B |
| CAGR to 2030 | ~20% |
| ORR range | 20–40% |
| Time-to-infusion | 1–3 days |
What is included in the product
 Detailed Word Document
Concise BCG Matrix for Nkarta: assesses Stars, Cash Cows, Question Marks, Dogs with investment and divestment guidance.

 Customizable Excel Spreadsheet
One-page Nkarta BCG Matrix that clarifies portfolio priorities and kills guesswork for faster capital decisions.
Cash Cows

Strategic partnerships and option deals
Upfronts and milestone payments in cell‑therapy option deals commonly range from tens to hundreds of millions, and when structured well they can outpace program burn on specific Nkarta programs. In mature collaborations incremental costs are low while cash inflows persist, not product revenue but funding the pipeline. Maintain partner satisfaction and these recurring inflows become reliable fuel for development.
Grant and non-dilutive funding streams
Selective grants and non-dilutive awards in cell therapy (notably SBIR/STTR and disease-specific foundations) can recur with minimal commercial spend, often covering core translational work while preserving equity; in 2024 many programs targeted early-stage allogeneic approaches.
Administrative lift is modest—commonly under 10% of comparable trial budgets—so net contribution versus trial spend is attractive and smooths revenue volatility without heavy promotional spend.
Maintain tight eligibility and crisp, timely reporting (quarterly or per award terms) to sustain repeatability and minimize audit risk.

Platform IP out-licensing niches
Targeted method or tech licenses can generate upfront fees and recurring royalties (typical biotech royalty ranges 3–8% and upfronts commonly $1–50M) with little incremental opex. Growth is inherently limited, but margins are high once papered, often yielding double‑digit to >70% gross contribution. Choose non‑core territories or indications to avoid channel conflict. These quiet cash flows help fund headline programs.

Process improvements that lower COGS
Process improvements that lower COGS convert directly to cash: a 10% yield gain produces ~9.1% lower COGS per unit (cost/1.1), and a 20% cycle time reduction raises throughput proportionally, cutting burn and time-to-data. Mature Nkarta processes need little incremental capex to keep paying back; bank those savings and redeploy to pivotal-enabling trials.
- Yield up 10% → COGS/unit ≈ down 9.1%
- Cycle time −20% → throughput +25%
- Mature processes = low incremental investment
Cash runway management and interest income
With disciplined treasury, interest on cash can meaningfully offset ops in low-growth periods; 2024 3–6 month US Treasury and money-market yields ran roughly 4.5–4.8%, with institutional sweep rates often above 4%, reducing burn without promotion. It requires minimal overhead, is not a growth lever but dependable, and extends runway across the portfolio without dilution.
- Offset ops: yields ~4.5–4.8% (2024)
- Low overhead, no promotion
- Not growth, dependable cash source
- Extends runway; portfolio-wide benefit
Cash cows: upfronts $1-50M, royalties 3-8% extend runway
Cash cows: repeatable upfronts/licensing ($1–50M) and royalties (3–8%) plus milestone inflows fund R&D with low incremental opex; grants (SBIR/STTR) and admin lift <10% sustain translational work; process gains (yield +10% → COGS/unit −9.1%) and treasury yields (~4.5–4.8% in 2024) extend runway.
| Source | 2024 Metric | Impact |
|---|---|---|
| Upfronts | $1–50M | Pipeline funding |
| Royalties | 3–8% | High margin |
| Treasury | 4.5–4.8% | Burn offset |
What You See Is What You Get
Nkarta BCG Matrix
The file you're previewing is the exact Nkarta BCG Matrix you'll receive after purchase. No watermarks or demo content—just a fully formatted, analysis-ready report crafted for clarity and action. After buying, the full document is delivered directly to your inbox, ready to edit, print, or present. No surprises, just strategic insight you can use immediately.

Unlock Strategic Clarity
Want a straight answer on where Nkarta’s offerings sit—Stars, Cash Cows, Dogs or Question Marks? This preview scratches the surface; buy the full BCG Matrix to get quadrant-by-quadrant placement, data-backed recommendations, and a clear playbook for where to invest or cut. Instant download includes a polished Word report plus an actionable Excel summary so you can present and act fast.
Stars
Allogeneic NK platform leadership
The off-the-shelf NK cell platform sits in a fast-growing cell therapy market estimated at about $14 billion in 2024 with a projected CAGR near 20% to 2030. Nkarta’s engineered NK approach places it among a small set of visible leaders, gaining rising clinician and investor attention. It still needs sustained capital for clinical validation and scale-up. With continued momentum it can mature into a durable franchise.
Manufacturing know-how at scale
Consistent, scalable NK manufacturing is rare and valuable in a sprinting cell-therapy category; manufacturing often represents >50% of COGS for advanced cell therapies, so Nkarta’s process know-how is high-leverage. Owning process IP, QC systems and incremental yield gains builds practical market power and supply reliability. It burns cash now but anchors future margins; with targeted throughput lowering COGS by tens of percent, this can form a durable strategic moat.
Clinical proof-of-concept traction
Early clinical signals—ORRs around 20–40% in small NK cell cohorts reported across 2023–24 studies—are driving mindshare as payers and physicians seek safer, repeat-dosing platforms versus autologous CAR-T. Visibility has catalyzed partnerships and site activation, with deal structures in 2024 commonly including upfronts plus up to mid-single-digit to >$500M milestone pools. The catch: each new cohort or combo adds incremental Phase 1–2 spend (commonly $2–8M), but share of voice rises as the NK field expands.
Partnerable combo ecosystem
NK plays well with antibodies, cytokines and checkpoints—exactly where pharma is investing; combo optionality expands paths to pivotal trials and label breadth, though multi-arm studies raise clinical spend. In 2024 immuno-oncology combos dominated late-phase activity, giving Nkarta multiple shots on goal; securing a marquee partner combo would cement category leadership and de-risk commercialization.
- Partnerable ecosystem
- Combo optionality = more pivotal paths
- High cash burn for trials
- Marquee combo = leadership
First-mover advantage in off-the-shelf access
Ready-when-needed off-the-shelf NK therapy closes a logistics gap that causes ≈30% of intended autologous CAR-T patients to never be infused; time-to-infusion falls from 3–6 weeks to 1–3 days. Speed is a key differentiator in heme malignancies and will matter for solid tumors; being early shapes standards of care and contracts, and maintaining availability plus favorable reimbursement compounds this star.
- Speed: 1–3 days vs 3–6 weeks
- Access loss: ≈30% of autologous candidates
- Reimbursement: list prices ~$373k–$475k (2024)
Allogeneic NK: $14B, ~20% CAGR, 20–40% ORR
Nkarta sits in a $14B (2024) cell‑therapy market with ~20% CAGR to 2030; early ORRs 20–40% (2023–24) boost visibility but require sustained capital for pivotal trials. Scalable NK manufacturing (COGS often >50%) and 1–3 day infusion vs 3–6 weeks for CAR‑T are durable advantages. Reimbursement range ~$373k–$475k (2024).
| Metric | 2024 |
|---|---|
| Market size | $14B |
| CAGR to 2030 | ~20% |
| ORR range | 20–40% |
| Time-to-infusion | 1–3 days |
What is included in the product
Detailed Word Document
Concise BCG Matrix for Nkarta: assesses Stars, Cash Cows, Question Marks, Dogs with investment and divestment guidance.
Customizable Excel Spreadsheet
One-page Nkarta BCG Matrix that clarifies portfolio priorities and kills guesswork for faster capital decisions.
Cash Cows
Strategic partnerships and option deals
Upfronts and milestone payments in cell‑therapy option deals commonly range from tens to hundreds of millions, and when structured well they can outpace program burn on specific Nkarta programs. In mature collaborations incremental costs are low while cash inflows persist, not product revenue but funding the pipeline. Maintain partner satisfaction and these recurring inflows become reliable fuel for development.
Grant and non-dilutive funding streams
Selective grants and non-dilutive awards in cell therapy (notably SBIR/STTR and disease-specific foundations) can recur with minimal commercial spend, often covering core translational work while preserving equity; in 2024 many programs targeted early-stage allogeneic approaches.
Administrative lift is modest—commonly under 10% of comparable trial budgets—so net contribution versus trial spend is attractive and smooths revenue volatility without heavy promotional spend.
Maintain tight eligibility and crisp, timely reporting (quarterly or per award terms) to sustain repeatability and minimize audit risk.
Platform IP out-licensing niches
Targeted method or tech licenses can generate upfront fees and recurring royalties (typical biotech royalty ranges 3–8% and upfronts commonly $1–50M) with little incremental opex. Growth is inherently limited, but margins are high once papered, often yielding double‑digit to >70% gross contribution. Choose non‑core territories or indications to avoid channel conflict. These quiet cash flows help fund headline programs.
Process improvements that lower COGS
Process improvements that lower COGS convert directly to cash: a 10% yield gain produces ~9.1% lower COGS per unit (cost/1.1), and a 20% cycle time reduction raises throughput proportionally, cutting burn and time-to-data. Mature Nkarta processes need little incremental capex to keep paying back; bank those savings and redeploy to pivotal-enabling trials.
- Yield up 10% → COGS/unit ≈ down 9.1%
- Cycle time −20% → throughput +25%
- Mature processes = low incremental investment
Cash runway management and interest income
With disciplined treasury, interest on cash can meaningfully offset ops in low-growth periods; 2024 3–6 month US Treasury and money-market yields ran roughly 4.5–4.8%, with institutional sweep rates often above 4%, reducing burn without promotion. It requires minimal overhead, is not a growth lever but dependable, and extends runway across the portfolio without dilution.
- Offset ops: yields ~4.5–4.8% (2024)
- Low overhead, no promotion
- Not growth, dependable cash source
- Extends runway; portfolio-wide benefit
Cash cows: upfronts $1-50M, royalties 3-8% extend runway
Cash cows: repeatable upfronts/licensing ($1–50M) and royalties (3–8%) plus milestone inflows fund R&D with low incremental opex; grants (SBIR/STTR) and admin lift <10% sustain translational work; process gains (yield +10% → COGS/unit −9.1%) and treasury yields (~4.5–4.8% in 2024) extend runway.
| Source | 2024 Metric | Impact |
|---|---|---|
| Upfronts | $1–50M | Pipeline funding |
| Royalties | 3–8% | High margin |
| Treasury | 4.5–4.8% | Burn offset |
What You See Is What You Get
Nkarta BCG Matrix
The file you're previewing is the exact Nkarta BCG Matrix you'll receive after purchase. No watermarks or demo content—just a fully formatted, analysis-ready report crafted for clarity and action. After buying, the full document is delivered directly to your inbox, ready to edit, print, or present. No surprises, just strategic insight you can use immediately.
Original: $10.00
-65%$10.00
$3.50Description
Unlock Strategic Clarity
Want a straight answer on where Nkarta’s offerings sit—Stars, Cash Cows, Dogs or Question Marks? This preview scratches the surface; buy the full BCG Matrix to get quadrant-by-quadrant placement, data-backed recommendations, and a clear playbook for where to invest or cut. Instant download includes a polished Word report plus an actionable Excel summary so you can present and act fast.
Stars
Allogeneic NK platform leadership
The off-the-shelf NK cell platform sits in a fast-growing cell therapy market estimated at about $14 billion in 2024 with a projected CAGR near 20% to 2030. Nkarta’s engineered NK approach places it among a small set of visible leaders, gaining rising clinician and investor attention. It still needs sustained capital for clinical validation and scale-up. With continued momentum it can mature into a durable franchise.
Manufacturing know-how at scale
Consistent, scalable NK manufacturing is rare and valuable in a sprinting cell-therapy category; manufacturing often represents >50% of COGS for advanced cell therapies, so Nkarta’s process know-how is high-leverage. Owning process IP, QC systems and incremental yield gains builds practical market power and supply reliability. It burns cash now but anchors future margins; with targeted throughput lowering COGS by tens of percent, this can form a durable strategic moat.
Clinical proof-of-concept traction
Early clinical signals—ORRs around 20–40% in small NK cell cohorts reported across 2023–24 studies—are driving mindshare as payers and physicians seek safer, repeat-dosing platforms versus autologous CAR-T. Visibility has catalyzed partnerships and site activation, with deal structures in 2024 commonly including upfronts plus up to mid-single-digit to >$500M milestone pools. The catch: each new cohort or combo adds incremental Phase 1–2 spend (commonly $2–8M), but share of voice rises as the NK field expands.
Partnerable combo ecosystem
NK plays well with antibodies, cytokines and checkpoints—exactly where pharma is investing; combo optionality expands paths to pivotal trials and label breadth, though multi-arm studies raise clinical spend. In 2024 immuno-oncology combos dominated late-phase activity, giving Nkarta multiple shots on goal; securing a marquee partner combo would cement category leadership and de-risk commercialization.
- Partnerable ecosystem
- Combo optionality = more pivotal paths
- High cash burn for trials
- Marquee combo = leadership
First-mover advantage in off-the-shelf access
Ready-when-needed off-the-shelf NK therapy closes a logistics gap that causes ≈30% of intended autologous CAR-T patients to never be infused; time-to-infusion falls from 3–6 weeks to 1–3 days. Speed is a key differentiator in heme malignancies and will matter for solid tumors; being early shapes standards of care and contracts, and maintaining availability plus favorable reimbursement compounds this star.
- Speed: 1–3 days vs 3–6 weeks
- Access loss: ≈30% of autologous candidates
- Reimbursement: list prices ~$373k–$475k (2024)
Allogeneic NK: $14B, ~20% CAGR, 20–40% ORR
Nkarta sits in a $14B (2024) cell‑therapy market with ~20% CAGR to 2030; early ORRs 20–40% (2023–24) boost visibility but require sustained capital for pivotal trials. Scalable NK manufacturing (COGS often >50%) and 1–3 day infusion vs 3–6 weeks for CAR‑T are durable advantages. Reimbursement range ~$373k–$475k (2024).
| Metric | 2024 |
|---|---|
| Market size | $14B |
| CAGR to 2030 | ~20% |
| ORR range | 20–40% |
| Time-to-infusion | 1–3 days |
What is included in the product
Detailed Word Document
Concise BCG Matrix for Nkarta: assesses Stars, Cash Cows, Question Marks, Dogs with investment and divestment guidance.
Customizable Excel Spreadsheet
One-page Nkarta BCG Matrix that clarifies portfolio priorities and kills guesswork for faster capital decisions.
Cash Cows
Strategic partnerships and option deals
Upfronts and milestone payments in cell‑therapy option deals commonly range from tens to hundreds of millions, and when structured well they can outpace program burn on specific Nkarta programs. In mature collaborations incremental costs are low while cash inflows persist, not product revenue but funding the pipeline. Maintain partner satisfaction and these recurring inflows become reliable fuel for development.
Grant and non-dilutive funding streams
Selective grants and non-dilutive awards in cell therapy (notably SBIR/STTR and disease-specific foundations) can recur with minimal commercial spend, often covering core translational work while preserving equity; in 2024 many programs targeted early-stage allogeneic approaches.
Administrative lift is modest—commonly under 10% of comparable trial budgets—so net contribution versus trial spend is attractive and smooths revenue volatility without heavy promotional spend.
Maintain tight eligibility and crisp, timely reporting (quarterly or per award terms) to sustain repeatability and minimize audit risk.
Platform IP out-licensing niches
Targeted method or tech licenses can generate upfront fees and recurring royalties (typical biotech royalty ranges 3–8% and upfronts commonly $1–50M) with little incremental opex. Growth is inherently limited, but margins are high once papered, often yielding double‑digit to >70% gross contribution. Choose non‑core territories or indications to avoid channel conflict. These quiet cash flows help fund headline programs.
Process improvements that lower COGS
Process improvements that lower COGS convert directly to cash: a 10% yield gain produces ~9.1% lower COGS per unit (cost/1.1), and a 20% cycle time reduction raises throughput proportionally, cutting burn and time-to-data. Mature Nkarta processes need little incremental capex to keep paying back; bank those savings and redeploy to pivotal-enabling trials.
- Yield up 10% → COGS/unit ≈ down 9.1%
- Cycle time −20% → throughput +25%
- Mature processes = low incremental investment
Cash runway management and interest income
With disciplined treasury, interest on cash can meaningfully offset ops in low-growth periods; 2024 3–6 month US Treasury and money-market yields ran roughly 4.5–4.8%, with institutional sweep rates often above 4%, reducing burn without promotion. It requires minimal overhead, is not a growth lever but dependable, and extends runway across the portfolio without dilution.
- Offset ops: yields ~4.5–4.8% (2024)
- Low overhead, no promotion
- Not growth, dependable cash source
- Extends runway; portfolio-wide benefit
Cash cows: upfronts $1-50M, royalties 3-8% extend runway
Cash cows: repeatable upfronts/licensing ($1–50M) and royalties (3–8%) plus milestone inflows fund R&D with low incremental opex; grants (SBIR/STTR) and admin lift <10% sustain translational work; process gains (yield +10% → COGS/unit −9.1%) and treasury yields (~4.5–4.8% in 2024) extend runway.
| Source | 2024 Metric | Impact |
|---|---|---|
| Upfronts | $1–50M | Pipeline funding |
| Royalties | 3–8% | High margin |
| Treasury | 4.5–4.8% | Burn offset |
What You See Is What You Get
Nkarta BCG Matrix
The file you're previewing is the exact Nkarta BCG Matrix you'll receive after purchase. No watermarks or demo content—just a fully formatted, analysis-ready report crafted for clarity and action. After buying, the full document is delivered directly to your inbox, ready to edit, print, or present. No surprises, just strategic insight you can use immediately.











