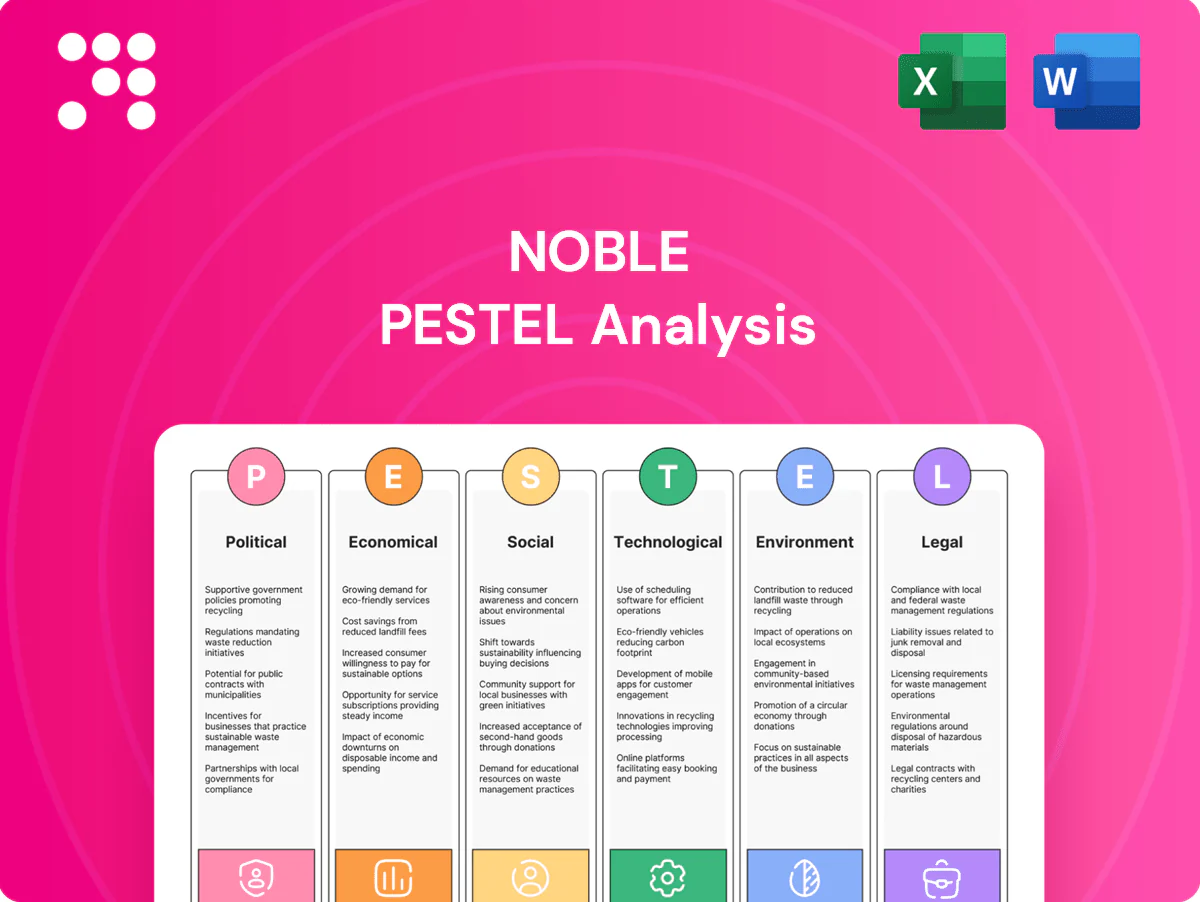
Noble PESTLE Analysis

Your Shortcut to Market Insight Starts Here
Unlock strategic clarity with our expert PESTLE Analysis tailored for Noble—concise, actionable, and grounded in current macro trends. Learn how political shifts, economic pressures, and emerging technologies will shape Noble’s trajectory and where risks and opportunities lie. Purchase the full report for the complete breakdown, editable charts, and instant insight to inform your next investment or strategy move.
Political factors

Geopolitical stability in drilling regions
Operations across the Gulf of Mexico, North Sea, West Africa, Middle East and Brazil expose Noble to distinct political risks—coups, sanctions or maritime disputes can delay mobilizations and depress dayrates. Approximately 80% of global trade by volume moves by sea (UNCTAD), so port access and government-to-government agreements materially affect uptime. Noble must diversify regional exposure and keep contingency plans for rapid redeployment.
Resource nationalism and local content
Host states increasingly mandate local hiring, procurement and in‑country fabrication—Nigeria (NOGICD Act 2010) and Angola (local content legislation 2018) are prominent examples—raising compliance costs and extending timelines; industry estimates often cite cost uplifts and schedule delays in the mid‑single to low‑double digit percentages and penalties (including fines and contract/license loss, sometimes up to ~10% of contract value) for non‑compliance. Strong local partnerships improve award prospects and reduce permitting friction.

Offshore licensing and fiscal regimes
Offshore licensing, bid rounds and fiscal terms directly drive FIDs and rig demand; predictable regimes in Norway (78% combined petroleum tax) and the UK and Brazil support multi-year visibility. Brazil applies ~10% royalties plus variable special participation on large fields. Policy swings or windfall levies can cut project IRRs by double-digit percentage points, stranding assets or compressing margins.

Energy security policies
Governments promoting domestic production to boost energy security can fast-track offshore approvals and licensing, supporting higher drilling cadence; offshore fields supply roughly 30% of global oil production. Strategic reserves and import-substitution policies shape timing of campaigns, while subsidies for FPSOs and export hubs—capex typically $500m–1.5bn—catalyze projects. Political pivots toward imports can sharply damp activity.
- Fast-track approvals
- Strategic reserves influence timing
- FPSO capex $500m–1.5bn
- Offshore ≈30% of oil supply
- Import pivots reduce campaigns
International sanctions and trade controls
Sanctions on specific NOCs, operators and regions (eg Russia, Iran) materially restrict contracts, vessel movements and supply-chain access, complicating project delivery. Export controls on high-spec drilling tech and spare parts impede maintenance of advanced rigs and can extend downtime. Robust screening of counterparties, cargoes and end‑users is mandatory; breaches can trigger regulatory fines in the hundreds of millions and severe reputational damage.
- Sanctions: contract/logistics limits
- Export controls: parts/tech shortages
- Compliance: mandatory screening
- Risk: fines (hundreds of millions) + reputational loss
Offshore energy risk: port access, local content and sanctions threaten uptime and capex
Noble faces sovereign risk across Gulf, North Sea, West Africa, ME and Brazil; ~80% of trade by sea (UNCTAD) and offshore supplies ≈30% of oil, so port access and G2G deals affect uptime. Local content laws (e.g., Nigeria, Angola) raise capex/time; FPSO capex $500m–1.5bn. Sanctions/export controls (Russia, Iran) restrict ops; fines can reach hundreds of millions.
| Metric | Value |
|---|---|
| Global sea trade | ≈80% |
| Offshore oil | ≈30% |
| Norway tax | 78% |
What is included in the product
 Detailed Word Document
Analyzes how Political, Economic, Social, Technological, Environmental and Legal forces uniquely impact Noble, with each category expanded into data-backed subpoints and trend-driven examples; designed for executives, consultants and investors to identify risks, opportunities and inform scenario-driven strategy and funding decisions.

 Customizable Excel Spreadsheet
A concise, visually segmented Noble PESTLE summary that distills external risks and opportunities for quick reference in meetings or presentations, with editable notes for regional or business-line specifics to speed alignment and decision-making.
Economic factors

Oil price and operator capex cycles
Brent volatility (averaging about $86/bbl in 2024 and trading near $80–85/bbl through mid‑2025) directly compresses exploration and development budgets. Sustained prices above ultra‑deepwater breakevens (~$50–60/bbl) spur multi‑year awards. Price shocks can freeze tenders and force dayrate renegotiations. Noble’s multi‑year backlog and rig optionality buffer these cycle swings.
Rig supply, utilization, and dayrates
Tight supply of high-spec drillships and harsh-environment jackups has pushed floater utilization to about 82% and H‑E jackup utilization to ~76% (IHS Markit, 2024), boosting dayrates. Reactivations need months and millions in capex, underpinning pricing power. Newbuild drillship orderbook remains tiny (~4% of fleet), while ~70 older units stacked globally cap upside in select basins.

Cost inflation and supply chain
Steel input costs rose about 15% year-on-year while lead times for critical spares lengthened roughly 30%, and Brent averaged near $86/bbl in 2024, driving fuel inflation for Noble operations. OEM concentration in subsea and BOP components amplifies pricing and supply risk, with few suppliers commanding premiums. Long-term contracts and strategic inventory holdings have reduced disruption frequency, but downtime from parts shortages still erodes margins at an estimated $100,000–$500,000 per day.

Interest rates and refinancing
- Higher rates: raises financing costs
- Contracts/advances: fund capex
- Balance sheet: improves bids
- Rate cuts: may enable reactivations
Currency and emerging market exposure
Revenue is often invoiced in USD while costs are paid in local currencies, creating FX basis risk; emerging market inflation averaged about 8% in 2024 (IMF), pressuring local wage bills and margins. Hedging programs reduce reported volatility but add explicit costs and can shave 1–2% off margins; capital controls and repatriation limits in jurisdictions like parts of Africa and Latin America constrain cash flow timing.
- USD revenues vs local-costs: FX basis risk
- EM inflation ~8% (2024 IMF): wage pressure
- Hedging cuts volatility but costs margins ~1–2%
- Capital controls/repatriation limits restrict cash flows
Offshore energy risk: port access, local content and sanctions threaten uptime and capex
Brent ~80–86$/bbl (2024–mid‑2025) compresses E&P budgets, but multi‑year awards persist; shocks freeze tenders and push dayrate renegotiations. Fleet tightness (floater util ~82%, H‑E jackups ~76%) and small newbuild orderbook sustain dayrates; reactivations need months and $m capex. Input costs: steel +15% y/y, spares lead times +30%; benchmark rates ~5–5.5% raise cost of debt. EM inflation ~8% (2024); hedging trims volatility but costs ~1–2% margins.
| Metric | 2024–25 |
|---|---|
| Brent | $80–86/bbl |
| Floater util | ~82% |
| H‑E jackup util | ~76% |
| Steel cost | +15% y/y |
| Rates | 5–5.5% |
| EM inflation | ~8% |
Full Version Awaits
Noble PESTLE Analysis
The preview shown here is the exact Noble PESTLE Analysis you'll receive after purchase—fully formatted, professionally structured, and ready to use. No placeholders or teasers: the layout, content, and insights displayed are delivered exactly as seen. After checkout you'll instantly download this final, actionable document.

Your Shortcut to Market Insight Starts Here
Unlock strategic clarity with our expert PESTLE Analysis tailored for Noble—concise, actionable, and grounded in current macro trends. Learn how political shifts, economic pressures, and emerging technologies will shape Noble’s trajectory and where risks and opportunities lie. Purchase the full report for the complete breakdown, editable charts, and instant insight to inform your next investment or strategy move.
Political factors
Geopolitical stability in drilling regions
Operations across the Gulf of Mexico, North Sea, West Africa, Middle East and Brazil expose Noble to distinct political risks—coups, sanctions or maritime disputes can delay mobilizations and depress dayrates. Approximately 80% of global trade by volume moves by sea (UNCTAD), so port access and government-to-government agreements materially affect uptime. Noble must diversify regional exposure and keep contingency plans for rapid redeployment.
Resource nationalism and local content
Host states increasingly mandate local hiring, procurement and in‑country fabrication—Nigeria (NOGICD Act 2010) and Angola (local content legislation 2018) are prominent examples—raising compliance costs and extending timelines; industry estimates often cite cost uplifts and schedule delays in the mid‑single to low‑double digit percentages and penalties (including fines and contract/license loss, sometimes up to ~10% of contract value) for non‑compliance. Strong local partnerships improve award prospects and reduce permitting friction.
Offshore licensing and fiscal regimes
Offshore licensing, bid rounds and fiscal terms directly drive FIDs and rig demand; predictable regimes in Norway (78% combined petroleum tax) and the UK and Brazil support multi-year visibility. Brazil applies ~10% royalties plus variable special participation on large fields. Policy swings or windfall levies can cut project IRRs by double-digit percentage points, stranding assets or compressing margins.
Energy security policies
Governments promoting domestic production to boost energy security can fast-track offshore approvals and licensing, supporting higher drilling cadence; offshore fields supply roughly 30% of global oil production. Strategic reserves and import-substitution policies shape timing of campaigns, while subsidies for FPSOs and export hubs—capex typically $500m–1.5bn—catalyze projects. Political pivots toward imports can sharply damp activity.
- Fast-track approvals
- Strategic reserves influence timing
- FPSO capex $500m–1.5bn
- Offshore ≈30% of oil supply
- Import pivots reduce campaigns
International sanctions and trade controls
Sanctions on specific NOCs, operators and regions (eg Russia, Iran) materially restrict contracts, vessel movements and supply-chain access, complicating project delivery. Export controls on high-spec drilling tech and spare parts impede maintenance of advanced rigs and can extend downtime. Robust screening of counterparties, cargoes and end‑users is mandatory; breaches can trigger regulatory fines in the hundreds of millions and severe reputational damage.
- Sanctions: contract/logistics limits
- Export controls: parts/tech shortages
- Compliance: mandatory screening
- Risk: fines (hundreds of millions) + reputational loss
Offshore energy risk: port access, local content and sanctions threaten uptime and capex
Noble faces sovereign risk across Gulf, North Sea, West Africa, ME and Brazil; ~80% of trade by sea (UNCTAD) and offshore supplies ≈30% of oil, so port access and G2G deals affect uptime. Local content laws (e.g., Nigeria, Angola) raise capex/time; FPSO capex $500m–1.5bn. Sanctions/export controls (Russia, Iran) restrict ops; fines can reach hundreds of millions.
| Metric | Value |
|---|---|
| Global sea trade | ≈80% |
| Offshore oil | ≈30% |
| Norway tax | 78% |
What is included in the product
Detailed Word Document
Analyzes how Political, Economic, Social, Technological, Environmental and Legal forces uniquely impact Noble, with each category expanded into data-backed subpoints and trend-driven examples; designed for executives, consultants and investors to identify risks, opportunities and inform scenario-driven strategy and funding decisions.
Customizable Excel Spreadsheet
A concise, visually segmented Noble PESTLE summary that distills external risks and opportunities for quick reference in meetings or presentations, with editable notes for regional or business-line specifics to speed alignment and decision-making.
Economic factors
Oil price and operator capex cycles
Brent volatility (averaging about $86/bbl in 2024 and trading near $80–85/bbl through mid‑2025) directly compresses exploration and development budgets. Sustained prices above ultra‑deepwater breakevens (~$50–60/bbl) spur multi‑year awards. Price shocks can freeze tenders and force dayrate renegotiations. Noble’s multi‑year backlog and rig optionality buffer these cycle swings.
Rig supply, utilization, and dayrates
Tight supply of high-spec drillships and harsh-environment jackups has pushed floater utilization to about 82% and H‑E jackup utilization to ~76% (IHS Markit, 2024), boosting dayrates. Reactivations need months and millions in capex, underpinning pricing power. Newbuild drillship orderbook remains tiny (~4% of fleet), while ~70 older units stacked globally cap upside in select basins.
Cost inflation and supply chain
Steel input costs rose about 15% year-on-year while lead times for critical spares lengthened roughly 30%, and Brent averaged near $86/bbl in 2024, driving fuel inflation for Noble operations. OEM concentration in subsea and BOP components amplifies pricing and supply risk, with few suppliers commanding premiums. Long-term contracts and strategic inventory holdings have reduced disruption frequency, but downtime from parts shortages still erodes margins at an estimated $100,000–$500,000 per day.
Interest rates and refinancing
- Higher rates: raises financing costs
- Contracts/advances: fund capex
- Balance sheet: improves bids
- Rate cuts: may enable reactivations
Currency and emerging market exposure
Revenue is often invoiced in USD while costs are paid in local currencies, creating FX basis risk; emerging market inflation averaged about 8% in 2024 (IMF), pressuring local wage bills and margins. Hedging programs reduce reported volatility but add explicit costs and can shave 1–2% off margins; capital controls and repatriation limits in jurisdictions like parts of Africa and Latin America constrain cash flow timing.
- USD revenues vs local-costs: FX basis risk
- EM inflation ~8% (2024 IMF): wage pressure
- Hedging cuts volatility but costs margins ~1–2%
- Capital controls/repatriation limits restrict cash flows
Offshore energy risk: port access, local content and sanctions threaten uptime and capex
Brent ~80–86$/bbl (2024–mid‑2025) compresses E&P budgets, but multi‑year awards persist; shocks freeze tenders and push dayrate renegotiations. Fleet tightness (floater util ~82%, H‑E jackups ~76%) and small newbuild orderbook sustain dayrates; reactivations need months and $m capex. Input costs: steel +15% y/y, spares lead times +30%; benchmark rates ~5–5.5% raise cost of debt. EM inflation ~8% (2024); hedging trims volatility but costs ~1–2% margins.
| Metric | 2024–25 |
|---|---|
| Brent | $80–86/bbl |
| Floater util | ~82% |
| H‑E jackup util | ~76% |
| Steel cost | +15% y/y |
| Rates | 5–5.5% |
| EM inflation | ~8% |
Full Version Awaits
Noble PESTLE Analysis
The preview shown here is the exact Noble PESTLE Analysis you'll receive after purchase—fully formatted, professionally structured, and ready to use. No placeholders or teasers: the layout, content, and insights displayed are delivered exactly as seen. After checkout you'll instantly download this final, actionable document.
Description
Your Shortcut to Market Insight Starts Here
Unlock strategic clarity with our expert PESTLE Analysis tailored for Noble—concise, actionable, and grounded in current macro trends. Learn how political shifts, economic pressures, and emerging technologies will shape Noble’s trajectory and where risks and opportunities lie. Purchase the full report for the complete breakdown, editable charts, and instant insight to inform your next investment or strategy move.
Political factors
Geopolitical stability in drilling regions
Operations across the Gulf of Mexico, North Sea, West Africa, Middle East and Brazil expose Noble to distinct political risks—coups, sanctions or maritime disputes can delay mobilizations and depress dayrates. Approximately 80% of global trade by volume moves by sea (UNCTAD), so port access and government-to-government agreements materially affect uptime. Noble must diversify regional exposure and keep contingency plans for rapid redeployment.
Resource nationalism and local content
Host states increasingly mandate local hiring, procurement and in‑country fabrication—Nigeria (NOGICD Act 2010) and Angola (local content legislation 2018) are prominent examples—raising compliance costs and extending timelines; industry estimates often cite cost uplifts and schedule delays in the mid‑single to low‑double digit percentages and penalties (including fines and contract/license loss, sometimes up to ~10% of contract value) for non‑compliance. Strong local partnerships improve award prospects and reduce permitting friction.
Offshore licensing and fiscal regimes
Offshore licensing, bid rounds and fiscal terms directly drive FIDs and rig demand; predictable regimes in Norway (78% combined petroleum tax) and the UK and Brazil support multi-year visibility. Brazil applies ~10% royalties plus variable special participation on large fields. Policy swings or windfall levies can cut project IRRs by double-digit percentage points, stranding assets or compressing margins.
Energy security policies
Governments promoting domestic production to boost energy security can fast-track offshore approvals and licensing, supporting higher drilling cadence; offshore fields supply roughly 30% of global oil production. Strategic reserves and import-substitution policies shape timing of campaigns, while subsidies for FPSOs and export hubs—capex typically $500m–1.5bn—catalyze projects. Political pivots toward imports can sharply damp activity.
- Fast-track approvals
- Strategic reserves influence timing
- FPSO capex $500m–1.5bn
- Offshore ≈30% of oil supply
- Import pivots reduce campaigns
International sanctions and trade controls
Sanctions on specific NOCs, operators and regions (eg Russia, Iran) materially restrict contracts, vessel movements and supply-chain access, complicating project delivery. Export controls on high-spec drilling tech and spare parts impede maintenance of advanced rigs and can extend downtime. Robust screening of counterparties, cargoes and end‑users is mandatory; breaches can trigger regulatory fines in the hundreds of millions and severe reputational damage.
- Sanctions: contract/logistics limits
- Export controls: parts/tech shortages
- Compliance: mandatory screening
- Risk: fines (hundreds of millions) + reputational loss
Offshore energy risk: port access, local content and sanctions threaten uptime and capex
Noble faces sovereign risk across Gulf, North Sea, West Africa, ME and Brazil; ~80% of trade by sea (UNCTAD) and offshore supplies ≈30% of oil, so port access and G2G deals affect uptime. Local content laws (e.g., Nigeria, Angola) raise capex/time; FPSO capex $500m–1.5bn. Sanctions/export controls (Russia, Iran) restrict ops; fines can reach hundreds of millions.
| Metric | Value |
|---|---|
| Global sea trade | ≈80% |
| Offshore oil | ≈30% |
| Norway tax | 78% |
What is included in the product
Detailed Word Document
Analyzes how Political, Economic, Social, Technological, Environmental and Legal forces uniquely impact Noble, with each category expanded into data-backed subpoints and trend-driven examples; designed for executives, consultants and investors to identify risks, opportunities and inform scenario-driven strategy and funding decisions.
Customizable Excel Spreadsheet
A concise, visually segmented Noble PESTLE summary that distills external risks and opportunities for quick reference in meetings or presentations, with editable notes for regional or business-line specifics to speed alignment and decision-making.
Economic factors
Oil price and operator capex cycles
Brent volatility (averaging about $86/bbl in 2024 and trading near $80–85/bbl through mid‑2025) directly compresses exploration and development budgets. Sustained prices above ultra‑deepwater breakevens (~$50–60/bbl) spur multi‑year awards. Price shocks can freeze tenders and force dayrate renegotiations. Noble’s multi‑year backlog and rig optionality buffer these cycle swings.
Rig supply, utilization, and dayrates
Tight supply of high-spec drillships and harsh-environment jackups has pushed floater utilization to about 82% and H‑E jackup utilization to ~76% (IHS Markit, 2024), boosting dayrates. Reactivations need months and millions in capex, underpinning pricing power. Newbuild drillship orderbook remains tiny (~4% of fleet), while ~70 older units stacked globally cap upside in select basins.
Cost inflation and supply chain
Steel input costs rose about 15% year-on-year while lead times for critical spares lengthened roughly 30%, and Brent averaged near $86/bbl in 2024, driving fuel inflation for Noble operations. OEM concentration in subsea and BOP components amplifies pricing and supply risk, with few suppliers commanding premiums. Long-term contracts and strategic inventory holdings have reduced disruption frequency, but downtime from parts shortages still erodes margins at an estimated $100,000–$500,000 per day.
Interest rates and refinancing
- Higher rates: raises financing costs
- Contracts/advances: fund capex
- Balance sheet: improves bids
- Rate cuts: may enable reactivations
Currency and emerging market exposure
Revenue is often invoiced in USD while costs are paid in local currencies, creating FX basis risk; emerging market inflation averaged about 8% in 2024 (IMF), pressuring local wage bills and margins. Hedging programs reduce reported volatility but add explicit costs and can shave 1–2% off margins; capital controls and repatriation limits in jurisdictions like parts of Africa and Latin America constrain cash flow timing.
- USD revenues vs local-costs: FX basis risk
- EM inflation ~8% (2024 IMF): wage pressure
- Hedging cuts volatility but costs margins ~1–2%
- Capital controls/repatriation limits restrict cash flows
Offshore energy risk: port access, local content and sanctions threaten uptime and capex
Brent ~80–86$/bbl (2024–mid‑2025) compresses E&P budgets, but multi‑year awards persist; shocks freeze tenders and push dayrate renegotiations. Fleet tightness (floater util ~82%, H‑E jackups ~76%) and small newbuild orderbook sustain dayrates; reactivations need months and $m capex. Input costs: steel +15% y/y, spares lead times +30%; benchmark rates ~5–5.5% raise cost of debt. EM inflation ~8% (2024); hedging trims volatility but costs ~1–2% margins.
| Metric | 2024–25 |
|---|---|
| Brent | $80–86/bbl |
| Floater util | ~82% |
| H‑E jackup util | ~76% |
| Steel cost | +15% y/y |
| Rates | 5–5.5% |
| EM inflation | ~8% |
Full Version Awaits
Noble PESTLE Analysis
The preview shown here is the exact Noble PESTLE Analysis you'll receive after purchase—fully formatted, professionally structured, and ready to use. No placeholders or teasers: the layout, content, and insights displayed are delivered exactly as seen. After checkout you'll instantly download this final, actionable document.











